


Introduction
Food contamination is one of the leading causes of illness and mortality worldwide (Havelaar et al., Reference Havelaar, Kirk, Torgerson, Gibb, Hald, Lake, Praet, Bellinger, de Silva, Gargouri, Speybroeck, Cawthorne, Mathers, Stein, Angulo and Devleesschauwer2015). Forty-eight million people fall ill, hundred and thirty thousand are hospitalized, and three thousand die from foodborne diseases annually in the U.S. (Centers for Disease Control and Prevention, 2010). The annual economic burden of foodborne illnesses has been estimated at $17.6 billion (U.S. Department of Agriculture, 2021a), including medical costs, productivity losses, premature mortality, and loss of quality-adjusted life years.Footnote 1
Laws and regulations can influence consumers' and producers' illness prevention behavior (Kolstad et al., Reference Kolstad, Ulen and Johnson1990; Roe, Reference Roe2004; Yoder, Reference Yoder2008). Product liability laws may affect product safety outcomes and complement other regulations (Kolstad et al., Reference Kolstad, Ulen and Johnson1990; Roe, Reference Roe2004; Shavell, Reference Shavell1984). Liability laws enable consumers affected by food contamination to seek compensation. Most legal cases in response to foodborne illnesses are subject to product liability laws, which differ across U.S. states. According to Buzby and Frenzen (Reference Buzby and Frenzen1999), foodborne illness lawsuits are based on strict liability, negligence, and breach of warranty doctrines.
The strict liability doctrine is the most common legal framework in the U.S. food industry (Loureiro, Reference Loureiro2008; Pouliot and Sumner, Reference Pouliot and Sumner2008). Under this rule, a producer whose product causes illness is fully responsible for the damages (Viscusi, Reference Viscusi2012). Under the negligence rule, the regulator sets a safety standard. If a foodborne illness occurs, the producer is liable for damages only if it can be shown that they violated the established safety standard. The breach of warranty pertains to cases where products do not meet express or implied warranty standards (Buzby and Frenzen, Reference Buzby and Frenzen1999). Some states also have Veggie Libels laws, which enable the producer to sue for defamation (Blattner and Ammann, Reference Blattner and Ammann2019). In addition to product liability, punitive damages can be imposed as penalties in excess of compensation for damages (Loureiro, Reference Loureiro2008).
According to Polinsky and Rogerson (Reference Polinsky and Rogerson1983), the liability law does not affect output and producer safety care in competitive markets with Coasian bargaining. However, market failures such as transaction costsFootnote 2 and asymmetric information impede efficient bargaining (Shavell, Reference Shavell1980). Therefore, interventions, such as product liability laws, are used to improve food safety and encourage desired care by producers (Viscusi, Reference Viscusi2012). Liability costs and damages to reputation can serve as incentives for producers to ensure food safety (Pouliot and Sumner, Reference Pouliot and Sumner2008). However, Garber (Reference Garber1998) demonstrates that product liability increases economic efficiency by supporting adequate food safety for under-informed consumers. On the other hand, product liability may result in excessive food safety efforts (Garber, Reference Garber1998) and production costs (Viscusi, Reference Viscusi2012).
Shavell (Reference Shavell1987) examines strict liability and negligence rules for efficient risk management. He argues that strict liability does not incentivize the consumers to take efficient risk-reducing care. Under a strict liability law, the consumers receive full compensation, which reduces their incentives to avoid risk, while producers invest in prevention. Under a negligence standard, producers avoid liability by investing in prevention that corresponds to the safety standard established by the regulation. Hence, when producers comply with the safety standard, consumers are responsible for losses and have the incentive to avoid risk. As a result, strict liability may produce poorer safety outcomes than negligence rules.
Following Shavell (Reference Shavell1987), a large body of economic literature investigates how strict liability and negligence standards affect risk mitigation efforts. For instance, Langpap and Wu (Reference Langpap and Wu2021) examine the effects of liability rules on reducing the risk of wildfire in the U.S. Their findings suggest that strict liability rules can be ineffective for increasing risk mitigation efforts. A negligence standard, on the other hand, can increase prevention efforts when the risk mitigation threshold is set optimally. Chen and Hua (Reference Chen and Hua2012) also show that partial producer liability can generate greater consumer surplus than full producer liability.
The effects of product liability can depend on market structure. Baumann et al. (Reference Baumann, Friehe and Rasch2016) show that in monopolistic markets, consumer harm heterogeneity results in lower product safety when accident losses are shifted from consumers to producers. The relationship between market competitiveness and product liability was also examined by Chen and Hua (Reference Chen and Hua2017) and Boyd (Reference Boyd1994). Alberini and Austin (Reference Alberini and Austin1999) show that the effects of strict liability on producer prevention efforts depend on firm size.
Only a few studies investigate the relationship between foodborne poisoning incidents and liability laws. For instance, Pouliot and Sumner (Reference Pouliot and Sumner2008) find that traceability improves food safety by supporting strict product liability. Traceability systems from retail to farms enable marketers to pass liability costs upstream, encouraging better safety throughout the supply chain. Using panel negative binomial models and 1990–2000 data for the U.S., Loureiro (Reference Loureiro2008) finds that strict product liability and punitive damages decrease reported foodborne illnesses. Roe (Reference Roe2004) examines the role of regulatory instruments in inducing optimal sharing of prevention efforts by consumers and producers. His results illustrate that optimal arrangement depends on the interdependence of consumer and producer efforts and the convexity of damage functions.
Numerous regulations and policies have been implemented in the U.S. to reduce food safety risks (Doyle et al., Reference Doyle, Erickson, Alali, Cannon, Deng, Ortega, Smith and Zhao2015). For instance, the Food Safety Modernization Act (FSMA), introduced in 2011 by the U.S. Food and Drug Administration (FDA), focuses on preventing rather than responding to foodborne illness incidents (FDA, 2015). FSMA introduced regulations that prioritized better growing, harvesting, and processing practices. For example, FSMA includes explicit guidelines for irrigating produce that is consumed fresh to prevent contamination with E. coli present in irrigation water (FDA, 2015). The Hazard Analysis Critical Control Points (HACCP) rule adopted in 1997 addresses food safety in terms of control and analysis of chemical, physical, and biological hazards in production, handling, manufacturing, distribution, and consumption (FDA, 2018). Nganje et al. (Reference Nganje, Miljkovic and Voica2016) show that PR/HACCP (Pathogen Reduction, Hazard Analysis, and Critical Points)-related information can influence consumer risk perceptions about food safety, which can affect efforts to prevent exposure. In addition, improved surveillance systems (e.g., the Centers for Disease Control's Foodborne Disease Active Surveillance Network) enable earlier and better identification of foodborne outbreaks (Biggerstaff, Reference Biggerstaff2016). Despite these and other regulations of processes and technologies, food safety threats (e.g., new and evolving pathogens) persist.
The objective of this study is to empirically examine the effect of product liability laws on the reported number of foodborne illnesses. Does product liability affect foodborne illness and/or the reporting of such incidents? Heterogeneities in strict product liability laws across states may lead to different foodborne illness and reporting outcomes. We take advantage of this heterogeneity across states to explore the relationship between product liability and foodborne illness outcomes.
We use panel Poisson and ordinary least squares (OLS) regression models and the U.S. data between 1998 and 2018 from the Centers for Disease Control (CDC) to examine the relationship between product liability laws and reported foodborne illnesses. The identification strategy exploits the variation in regulatory regimes across states and over time. Four state-year measures for foodborne illnesses are used: the number of reported individual illnesses associated with food contamination, the number of reported outbreaks, the number of hospitalizations related to foodborne illnesses, and the number of deaths due to foodborne illnesses.
Data
Data used in this study come from secondary sources. Table 1 provides summary statistics. Reported foodborne illnesses and outbreaks are obtained from the CDC National Outbreak Reporting System (NORS).Footnote 3 NORS provides information on foodborne, waterborne, person-to-person transmitted, animal contact, environmental contamination, and other illness outbreaks. The outbreaks include at least two people being sick from a common food or drink. The CDC database includes all reported foodborne disease outbreaks within the U.S. per state since 1998. We also include multi-state illness outbreaks and illnesses using the CDC data.Footnote 4 Multi-state cases of reported foodborne illnesses are available only after 2009, while single-state illnesses are available from 1998. On the other hand, single- and multi-state outbreaks are available for 1998–2018. Figures 1 and 2 show aggregate single- and multi-state foodborne illnesses and outbreaks over time. Although foodborne-related illnesses and outbreaks have generally decreased, they grew after 2017.
Table 1. Summary statistics for U.S. 50 states plus D.C. for the period 1998–2018 (n = 1071)


Figure 1. Number of reported single- and multi-state foodborne illnesses in the U.S.
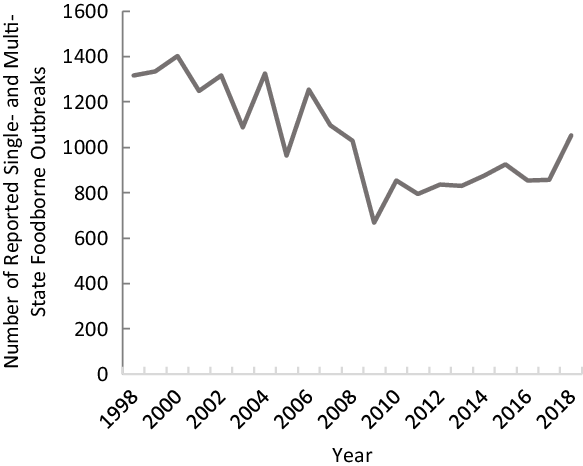
Figure 2. Number of reported single- and multi-state foodborne outbreaks in the U.S.
The CDC database also includes state-level data on the number of foodborne-related deaths and hospitalizations since 1998. However, these data do not provide state numbers on deaths and hospitalizations for multi-state outbreaks. Therefore, only single-state deaths and hospitalizations are included in this study. The frequency plots show that the distributions of foodborne illness-related deaths and hospitalizations are left-skewed (see Appendix Figure A.1). Due to the prevalence of observations with zero values, we use indicator variables equal to one if there is a foodborne illness-related hospitalization or death, respectively, and zero otherwise.
Our variable of interest is strict product liability law with the possibility of claiming punitive damages (Loureiro, Reference Loureiro2008). We obtain the state data on product liability laws with punitive damages from annual issues of Product Liability Desk Reference-A 50 State Compendium (Daller, Reference Daller1998–2018). Another regulatory variable included in this study is Veggie Libel, which is included in our analysis as a control for lobbying efforts of food businesses against wrongful claims. To date, these laws exist in 13 states in the U.S.Footnote 5
The annual data on state-level strict product liability with punitive damages from Daller (Reference Daller1998–2018) allow us to measure changes in product liability over time and across states. Seventy-five percent of observations have strict liability with punitive damages. In 1999, Alabama, Oklahoma, and the District of Colombia changed from deregulation to regulation in terms of adopting strict liability and punitive damages, while four states, including Florida, Kentucky, New Mexico, and Ohio moved from regulation to deregulation. Wyoming adopted strict liability and punitive damages in 2016. Delaware, Louisiana, Massachusetts, Michigan, Nebraska, New Hampshire, North Carolina, Virginia, and Washington did not adopt strict liability and punitive damages during 1998–2018. Other states adopted strict liability and punitive damages and did not change their regulations during the study time frame.
State characteristics such as population, income, and political preferences may affect foodborne illnesses. Data on population, the percentage of the population living in the metropolitan areas, the percentage of people living below the poverty line, the percentage of non-White population, the number of lawyers per thousand people representing access to legal services, the number of retail food stores and restaurants per thousand people representing food consumption choices, and the number of Republican and Democrat representatives in Congress as measures of political preferences are obtained from the Statistical Abstract of the United States. Poverty is included to control for the difference in foodborne disease risk exposure. Studies find that higher-income groups are associated with risk factors such as consuming raw and uncooked fruits, vegetables, and meat and eating at restaurants more often (Quinlan, Reference Quinlan2013; Whitney et al., Reference Whitney, Mainero, Humes, Hurd, Niccolai and Hadler2015). Metropolitan residence is included because higher population density in metropolitan areas facilitates transmission of illnesses (Loureiro, Reference Loureiro2008). The percentage of non-White population is included to account for the differences between White and non-White populations in terms of food safety practices (Chang et al., Reference Chang, Groseclose, Zaidi and Braden2009). We also control for political preferences because republican states may be less prone to market regulation (Loureiro, Reference Loureiro2008). Access to legal services is included to account for the potential effect on reporting foodborne illnesses. We also include per capita expenditure on health care in real terms obtained from the Bureau of Economic Analysis, since individuals without access to health care are less likely to seek medical care and therefore are less likely to report and be diagnosed (Darcey, Reference Darcey2010).
According to the U.S. Department of Agriculture (USDA, 2021b), foodborne illnesses increase in the summer due to the faster growth of bacteria in warmer temperatures, and more food is prepared away from home. However, it is also possible that the warmer weather motivates an increase in precautionary measures to avoid food contamination (Loureiro, Reference Loureiro2008). We include the average July temperature as a control using data from the National Oceanic and Atmospheric Administration (NOAA).
Data used in robustness check
We also group foodborne illnesses by categories, including animal-related, seafood-related, plant-related, processed-food-related, unspecified, and water-related illnesses. Animal-related illnesses are traced to consumption of dairy, eggs, meat, and game. Seafood-related foodborne illnesses include fish, shellfish, and other aquatic animals. Produce, grains, beans, nuts, and seeds-related illnesses are in the plant group. Each category is represented with a binary variable equal to one if state-year illnesses include at least one case from the corresponding category and zero otherwise. Hence, these binary variables are not mutually exclusive and can overlap. These binary variables are used as explanatory variables in specifications for robustness checks.
Empirical methods
We use panel OLS regression to examine the relationship between strict liability with punitive damages and the number of reported foodborne illnesses and outbreaks. The dependent variables in the OLS models are the number of reported foodborne illnesses, outbreaks, hospitalizations, and deaths per thousand people. As a robustness check, we also use Poisson regression, given the nature of our dependent variables. In the Poisson estimation, we use the number of reported foodborne illnesses, outbreaks, hospitalizations, and deaths as integer outcome variables.
Main model
In the OLS estimation, the equation of interest is:
 $${y_{it}} = \alpha + {x_{it}}\beta \; + {D_{it}}\delta + {\gamma _i} + {\mu _t} + {\varepsilon _{it}}$$
where, ${y_{it}}$
is one of the dependent variables in state i in year t.
${y_{it}}$
is one of the dependent variables in state i in year t. $\;x\;$
is the vector of control variables. D is the treatment variable, which is one if state i has strict product liability with punitive damages in year t and zero otherwise.
$\;x\;$
is the vector of control variables. D is the treatment variable, which is one if state i has strict product liability with punitive damages in year t and zero otherwise. $\;\gamma \;$
is a vector of state fixed effects.
$\;\gamma \;$
is a vector of state fixed effects. $\mu $
is a vector of year fixed effects. is the error term. We test the null hypothesis of no effect of strict liability and punitive damages on reported foodborne illness incidents (
$\mu $
is a vector of year fixed effects. is the error term. We test the null hypothesis of no effect of strict liability and punitive damages on reported foodborne illness incidents ( ${H_0}:\delta = 0$
) versus the alternative hypothesis
${H_0}:\delta = 0$
) versus the alternative hypothesis ${H_A}:\delta \ne 0$
.
${H_A}:\delta \ne 0$
.
The lack of multi-state illnesses data before 2009 may introduce bias in the analysis. Therefore, following Bellemare and Nguyen (Reference Bellemare and Nguyen2018), we estimate two additional specifications of equation (1) to control for the change in the data structure in 2009 when the CDC started reporting foodborne illnesses for multi-state outbreaks. The first specification assumes that exclusion of multi-state illnesses only affects the intercept:
 $${y_{it}} = \alpha + {x_{it}}\beta \; + {D_{it}}\delta + {m_t}\rho + {\gamma _i} + {\mu _t} + {\varepsilon _{it}}$$
where, $\;{m_{t\;}}$
is an indicator variable equal to zero if multi-state outbreak data are available in year t, and one otherwise. This variable accounts for the missing multi-state foodborne illnesses. In the second specification, it is assumed that the exclusion of the multi-state illnesses affects the intercept as well as the slope of equation (1). Hence, in this specification, we estimate
$\;{m_{t\;}}$
is an indicator variable equal to zero if multi-state outbreak data are available in year t, and one otherwise. This variable accounts for the missing multi-state foodborne illnesses. In the second specification, it is assumed that the exclusion of the multi-state illnesses affects the intercept as well as the slope of equation (1). Hence, in this specification, we estimate
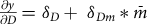
 $${y_{it}} = \alpha + {x_{it}}\beta \; + {D_{it}}{\delta _D} + ({D_{it}}*{m_t}){\delta _{Dm}} + {m_t}\rho + {\gamma _i} + {\mu _t} + {\varepsilon _{it}}$$
where the marginal effect of strict liability with punitive damages depends on pre- versus post-2009 sample period and is as ${{\partial y} \over {\partial D}} = {\delta _D} + \;{\delta _{Dm}}*\bar m$
.
${{\partial y} \over {\partial D}} = {\delta _D} + \;{\delta _{Dm}}*\bar m$
. $\bar m$
is the sample mean of
$\bar m$
is the sample mean of ${m_t}$
and equals 0.524 (multi-state illness case data are missing for 11 out of 21 years). Following Bellemare and Nguyen (Reference Bellemare and Nguyen2018), we present the estimates from all specifications to demonstrate the robustness of the results. For the analysis of outbreaks (i.e., the number of reported foodborne illness outbreaks per thousand people), we only provide the results of equation (1) because the data set includes both single- and multi-state reported foodborne illness outbreaks during 1998–2018.
${m_t}$
and equals 0.524 (multi-state illness case data are missing for 11 out of 21 years). Following Bellemare and Nguyen (Reference Bellemare and Nguyen2018), we present the estimates from all specifications to demonstrate the robustness of the results. For the analysis of outbreaks (i.e., the number of reported foodborne illness outbreaks per thousand people), we only provide the results of equation (1) because the data set includes both single- and multi-state reported foodborne illness outbreaks during 1998–2018.
Finally, the number of foodborne illnesses and outbreaks is usually underreported. This can introduce attenuation bias to the estimated relationship between food safety laws and foodborne diseases. As discussed by Bellemare and Nguyen (Reference Bellemare and Nguyen2018), this measurement error would make rejecting the null hypothesis ( ${H_0}: = 0$
) less likely, meaning that a rejection of the null hypothesis, regardless of direction, would strengthen the results.Footnote
6
${H_0}: = 0$
) less likely, meaning that a rejection of the null hypothesis, regardless of direction, would strengthen the results.Footnote
6
Robustness check models
Poisson and negative binomial regression models are the most common techniques for nonnegative integer dependent variable analysis (Cameron and Trivedi, Reference Cameron and Trivedi2013). The Poisson model restricts the conditional mean and conditional variance of the dependent variable to be equal. However, many count data models violate this variance-mean equality assumption. The inequality of conditional mean and variance represents an over- or under-dispersion problem possibly due to unobserved heterogeneity (Cameron and Trivedi, Reference Cameron and Trivedi2013). Therefore, negative binomial models are commonly used. However, Wooldridge (Reference Wooldridge1999) shows that if the conditional mean function is correctly specified, the Poisson model produces consistent, efficient, and robust estimates of parameters, even when the response variable is over-dispersed. As such, the Poisson model is preferred over the negative binomial model for estimating the conditional mean parameters (Wooldridge, Reference Wooldridge2010). Therefore, this paper uses the Poisson model to explore the relationship between strict liability with punitive damages and foodborne illness.Footnote 7
In the Poisson model, the number of events $y{'_{it}}$
has a conditional mean λ
it
in state i and year t. In other words, the expected mean is
$y{'_{it}}$
has a conditional mean λ
it
in state i and year t. In other words, the expected mean is
 $$exp\left( {{x_{it}}\beta \; + {D_{it}}\delta + {\gamma _i} + {\mu _t} + {\varepsilon _{it}}} \right) = {\lambda _{it}}$$
The corresponding probability density function of $y'\;$
for individuals in state i in year t is (Cameron and Trivedi, Reference Cameron and Trivedi2005):
$y'\;$
for individuals in state i in year t is (Cameron and Trivedi, Reference Cameron and Trivedi2005):
 $$f(y{'_{it}}|{x_{it}},{D_{it}}) = {{{e^{ - {\lambda _{it}}}}{\lambda _{it}}^{y{'_{it}}}} \over {y{'_{it}}!}}$$
where the dependent variable, $y{'_{it}},\;$
is the count of reported foodborne illness outbreaks or number of illnesses in state i in year t. Similar to the OLS estimations, an additional specification is estimated to account for the change in the data structure pre- versus post-2009. This specification assumes that the exclusion of multi-state illnesses data affects the slope of the Poisson model. In other words, the expected mean is
$y{'_{it}},\;$
is the count of reported foodborne illness outbreaks or number of illnesses in state i in year t. Similar to the OLS estimations, an additional specification is estimated to account for the change in the data structure pre- versus post-2009. This specification assumes that the exclusion of multi-state illnesses data affects the slope of the Poisson model. In other words, the expected mean is
 $$exp\left( {{x_{it}}\beta {\rm{\;}} + {D_{it}}\delta + ({D_{it}}{\rm{*}}{m_t}} \right){\delta _{Dm}} + {\gamma _i} + {\mu _t} + {\varepsilon _{it}}) = {\lambda _{it}}$$
For single- and multi-state foodborne illness outbreaks as the dependent variable, we provide the results of Poisson estimation in equations (4) and (5) because the data include both single- and multi-state outbreaks during 1998–2018. For foodborne illnesses, we use (6).
All models used in the main and robustness check methods include state and year fixed effects. Year fixed effects are used to overcome unobserved state-invariant heterogeneity. Year fixed effects represent technological and other improvements in food safety control systems, such as the adoption of the HACCP. Similarly, state fixed effects are used to overcome unobserved and time-invariant heterogeneity across states.Footnote 8
We also estimate models using a linear time trend and U.S. Census Bureau region fixed effects.Footnote 9 Region fixed effects are included to account for specific characteristics of U.S. regions regarding food safety control and regulations that are not captured in other variables (Loureiro, Reference Loureiro2008). Additionally, we estimated spatial models to account for potential interdependencies across states. These models consider that the regulation adopted in one state can affect the number of illnesses and outbreaks in another.Footnote 10 Also, specifications that include indicator variables for foodborne illness categories are estimated as robustness checks.
Results
This section presents the regression results examining the effects of strict liability and punitive damages on the reported foodborne illnesses, outbreaks, documented hospitalizations, and deaths. Multiple specification results are provided for each analysis as robustness checks. Additional results, including specifications with region rather than state fixed effects, random effects, a linear time trend rather than year fixed effects, spatial weight matrixes to account for spillover effects across states, and indicator variables for foodborne illness categories in OLS and Poisson models, are provided in the Appendix A.
Single- and multi-state reported foodborne illnesses and outbreaks
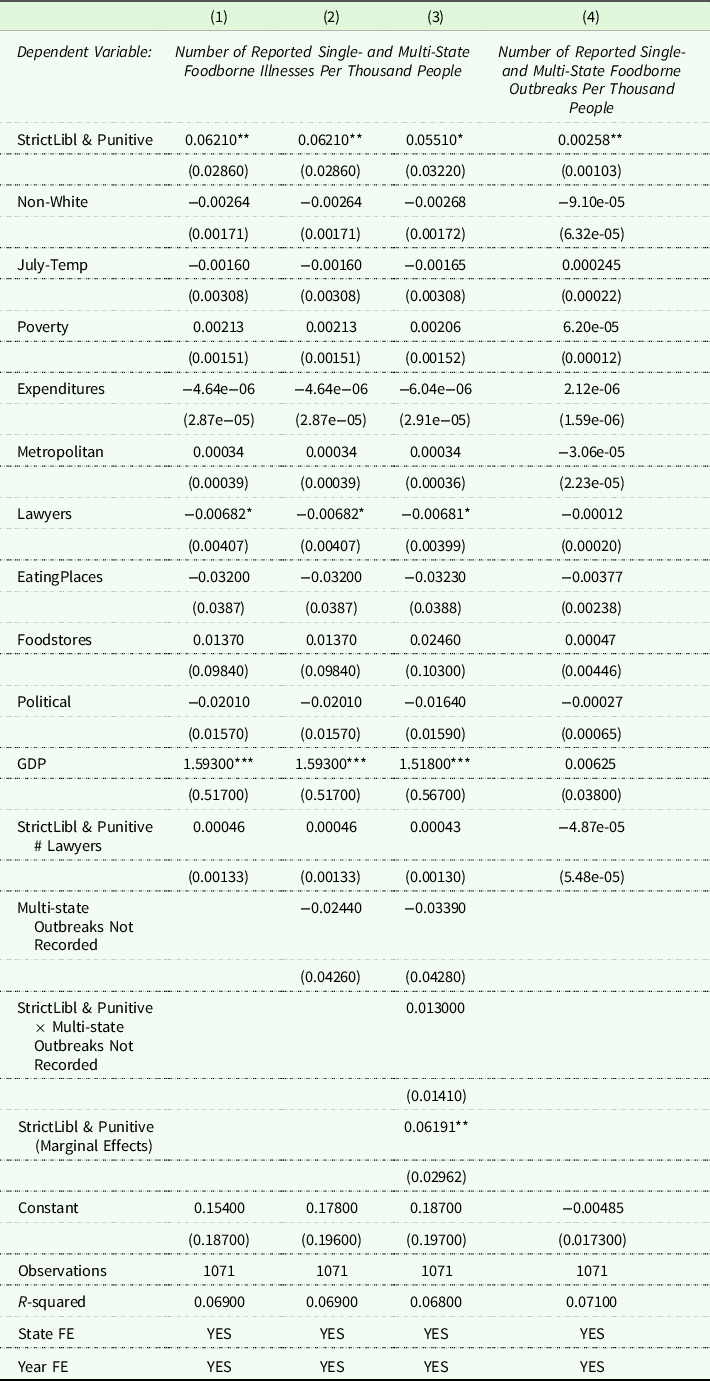
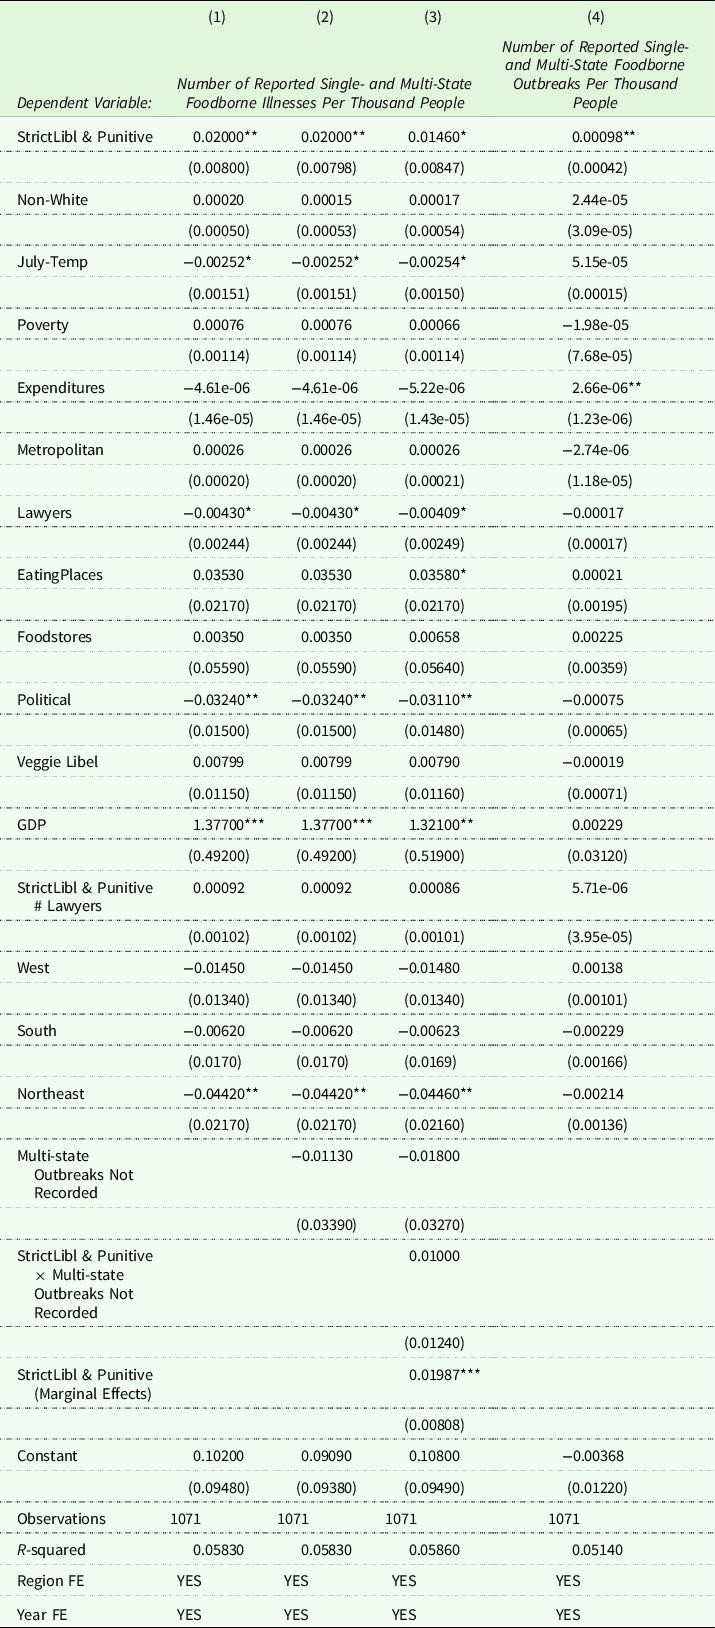
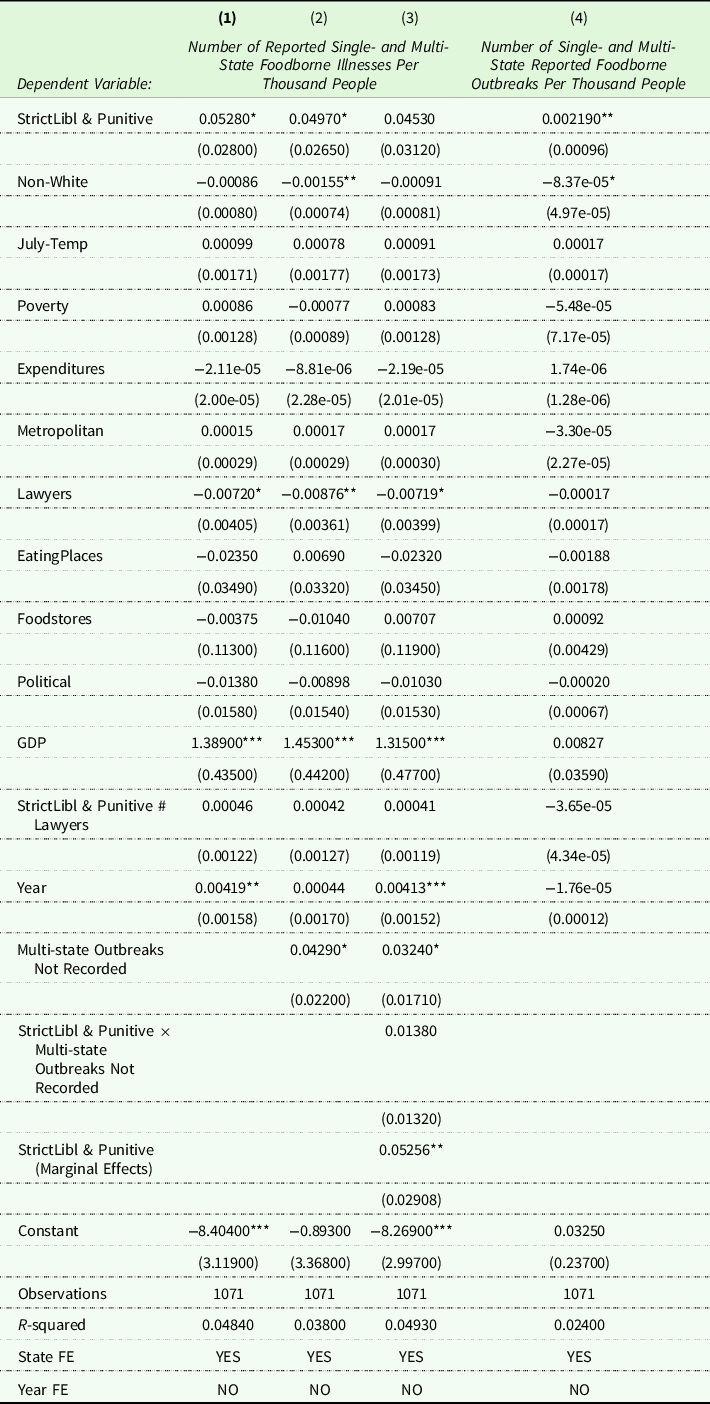
OLS estimates are provided in Table 2. Columns (1) to (3) present estimates for models (1), (2), and (3) for the number of reported single- and multi-state foodborne illnesses per thousand people, respectively. Column (4) shows the results for the number of reported single- and multi-state foodborne illness outbreaks per thousand people.Footnote 11 All models in Table 2 tell the same story. After controlling for the year and state fixed effects and other variables, there is a positive and statistically significant relationship between strict liability with punitive damages and the number of reported foodborne illnesses and outbreaks. A positive coefficient for strict liability with punitive damages means that states with this rule have more reported foodborne illnesses and outbreaks. States that have adopted strict product liability with punitive damages experience 62 additional reported foodborne illnesses (columns 1, 2, 3) and around 3 more reported foodborne illness outbreaks (column 4) relative to states without a liability law.
Table 2. OLS estimates for the number of reported single- and multi-state foodborne illnesses and outbreaks per thousand people
Notes: Standard errors in parentheses are clustered by states.
***, **, and * indicate the significance levels at 1%, 5%, and 10%, respectively.
Veggie Libel dropped because it is constant within group.
These results are consistent with an expectation that strict product liability can reduce consumer incentives to engage in risk mitigation efforts relative to consumer behavior under a negligence standard (Shavell, Reference Shavell1987). Other studies have also found that strict liability may produce poorer product safety outcomes depending on market structure, firm size, and other factors (Boyd, Reference Boyd1994; Chen and Hua, Reference Chen and Hua2012; Baumann et al., Reference Baumann, Friehe and Rasch2016; Chen and Hua, Reference Chen and Hua2017; Langpap and Wu, Reference Langpap and Wu2021).
A secondary explanation for the positive and statistically significant relationship between strict product liability with punitive damages and the number of reported foodborne illnesses and outbreaks can be the reporting effect (Alberini and Austin, Reference Alberini and Austin1999). Strict liability laws may incentivize individuals to report more foodborne illness incidents. While false reporting can be costly, better reporting of food safety incidents can improve foodborne incident cost estimates (Frenzen, Reference Frenzen2004), especially since foodborne illnesses are generally underreported and under-diagnosed (Scallan et al., Reference Scallan, Hoekstra, Angulo, Tauxe, Widdowson, Roy, Jones and Griffin2011; Arendt et al., Reference Arendt, Rajagopal, Strohbehn, Stokes, Meyer and Mandernach2013).
Results also indicate a positive and statistically significant relationship between per capita GDP and reported foodborne illnesses (Table 2). States with higher GDP may have more resources to report diseases and inform their residents of foodborne illnesses. These states may also provide more critical health care resources allowing more people to seek medical care to treat foodborne illnesses. Also, the results show a negative and statistically significant relationship between the number of lawyers per thousand people and reported foodborne illnesses. A greater number of lawyers per thousand people may correlate with a more substantial threat of lawsuits in case of food contamination. Thus, an increase in the number of lawyers may result in better food safety practices along the supply chain and fewer reports of foodborne illnesses. Alternatively, Buzby and Frenzen (Reference Buzby and Frenzen1999) argue that uncertainty regarding the outcome of a lawsuit and high transaction costs, including lawyers' fees, may disincentivize pursuits of food safety litigations.
Robustness check for single- and multi-state reported foodborne illnesses and outbreaks
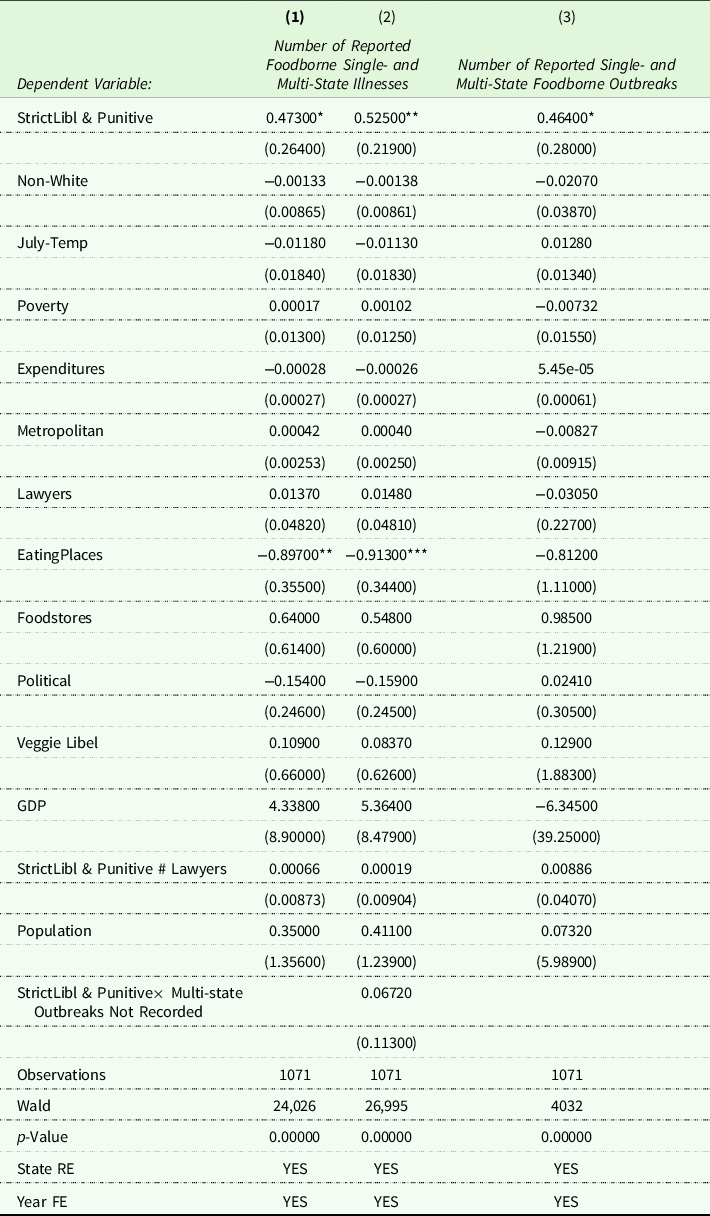
Appendix Table A.1 presents the results for the Poisson models. Consistent with the OLS results, we observe that after controlling for the year and state fixed effects and other control variables, there is a positive and statistically significant relationship between strict product liability law with punitive damages and the number of reported foodborne illnesses and outbreaks. These results also show that the number of restaurants has a statistically significant and negative relationship with the number of reported foodborne illnesses. This result is consistent with the finding of other studies, which show that foodborne illnesses are more frequent in at-home consumption settings than in restaurants (Byrd-Bredbenner et al., Reference Byrd-Bredbenner, Berning, Martin-Biggers and Quick2013).
Additional robustness checks for the results in Tables 2 and 3 are provided in Tables A.2 to A.13 in Appendix A. These results consider region fixed effects, random effects, a linear time trend, spatial weight matrixes, and indicator variables for foodborne illness categories. The positive and significant relationship between strict liability with punitive damages and the number of reported foodborne illnesses and outbreaks appear to be mostly stable. This supports the robustness of our results regarding the effect of omitted variables bias (Bellemare and Nguyen, Reference Bellemare and Nguyen2018).
Table 3. Estimation results for number of single-state foodborne illness hospitalizations and deaths
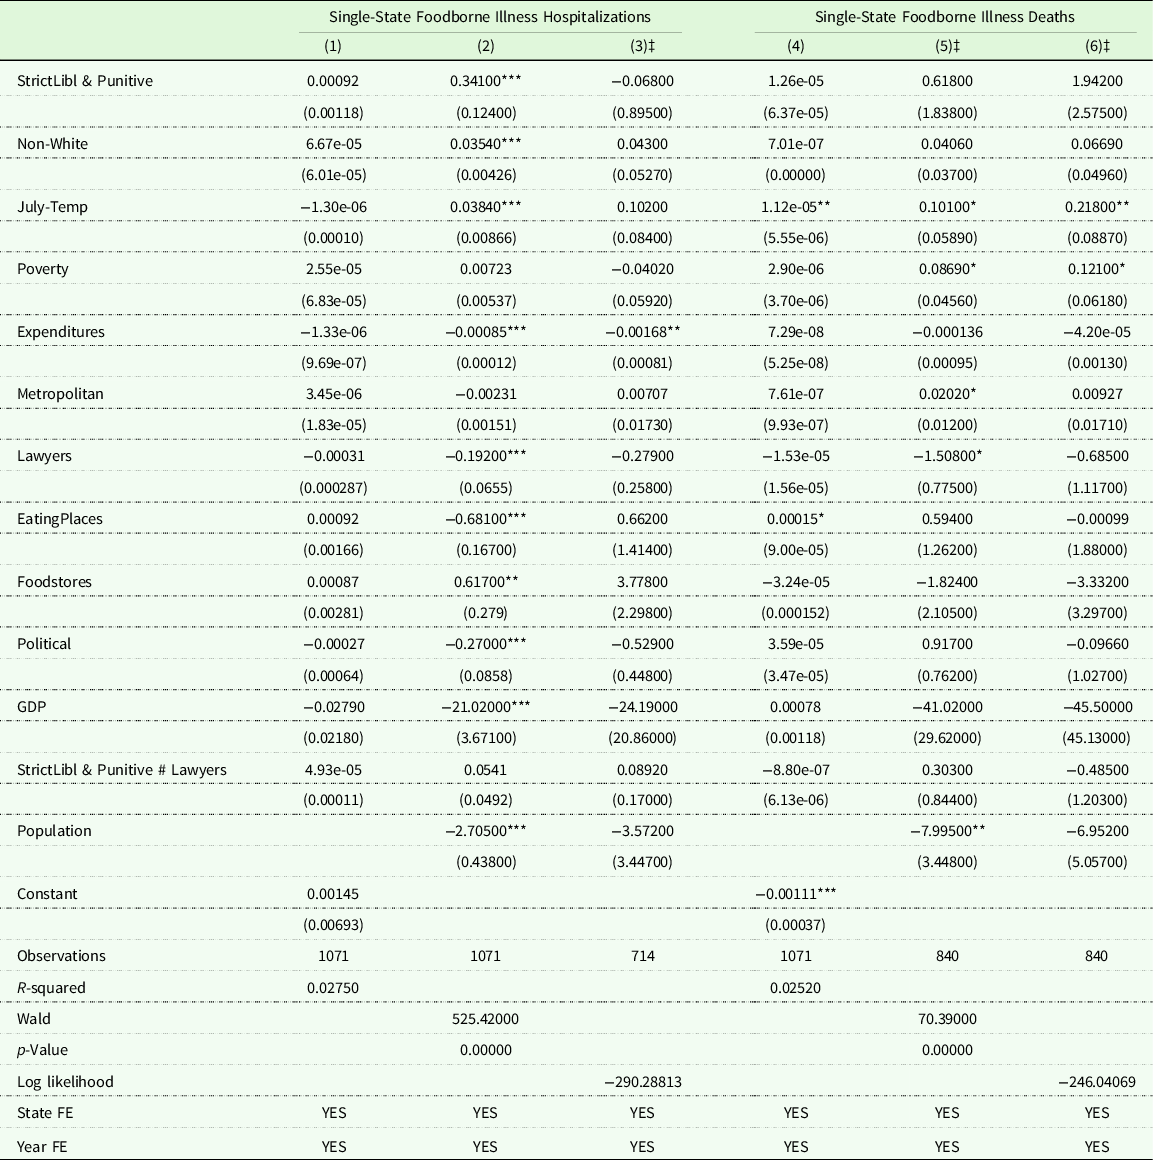
Notes: Columns (1) and (4) show the OLS estimation results where the dependent variables are the number of foodborne illness hospitalization and deaths per thousand people, respectively. Columns (2) and (5) show the Poisson results where the dependent variables are the number of foodborne illness hospitalization and deaths, respectively. Columns (3) and (6) show Logit results where the indicator variables are one if there are reported foodborne illness hospitalization or death, respectively, and zero otherwise. Standard errors in parentheses in columns (1), (2), (4), and (5) are obtained by clustering over state. Veggie Libel dropped because it is constant within group. ***, **, and * indicate the significance levels at 1%, 5%, and 10%, respectively.
‡ Observations dropped because of no variation in the dependent variable.
Single-state hospitalizations and deaths
To test our secondary explanation for the positive and significant relationship between strict product liability and foodborne illnesses, we examine the effect of strict liability and punitive damages on the number of single-state foodborne hospitalizations/deaths. Assuming that the share of foodborne illnesses that results in hospitalizations/deaths is unaffected by the strict liability laws, a statistically significant relationship between foodborne hospitalizations/deaths and strict liability should correspond to the proportional effect of the liability law on actual foodborne illnesses. In turn, if the relationship between strict liability and the number of hospitalizations/deaths is not statistically significant, then one can also expect an insignificant relationship between the regulation and foodborne illnesses.
Table 3 shows panel OLS, Poisson, and LogitFootnote 12 model results. Columns (1) and (4) present OLS results where the dependent variables are foodborne illness hospitalizations/deaths per thousand people, respectively. Columns (2) and (5) show the corresponding results from Poisson regressions. Columns (3) and (6) present Logit model results where the dependent variables are one if there is foodborne illness hospitalization/death, and zero otherwise. Based on the CDC data availability, the dependent variables only include single-state hospitalizations or deaths.
Table 3 shows mostly no statistically significant relationship between the number of single-state foodborne-related hospitalizations/deaths and strict product liability law with punitive damages. The Poisson model shows a positive and significant relationship between strict product liability and the number of hospitalizations. However, the statistically insignificant coefficients in Tables A.12 and A.13 show that the positive effect of the liability law on the number of hospitalizations is not robust. The results from the Poisson model in Table A.1 also show a negative and significant relationship between population and foodborne illness-related hospitalizations/deaths. People in populated cities may be reluctant to seek medical help due to greater demand for hospital services with longer wait times. Death may also be more likely attributed to food poisoning than to other underlying conditions in smaller than larger states.
Our results show that strict product liability with punitive damages is positively correlated with the number of reported foodborne outbreaks and that the effect is statistically significant. However, strict liability with punitive damages is not statistically correlated with hospitalizations or deaths across most specifications. This may suggest that strict liability with punitive damages is positively correlated with reporting and may not necessarily correlate with actual illnesses.
Conclusions and policy implications
Food contamination is one of the leading causes of illness and mortality worldwide. Product liability laws allow consumers affected by unsafe products to take legal action and seek compensation for damages and costs. Heterogeneities in strict product liability laws across states may lead to different foodborne illness outcomes. We take advantage of this heterogeneity to explore the relationship between product liability law and foodborne illness and reporting outcomes. Despite the burden that foodborne illnesses impose on public health, there are limited studies on the relationship between liability laws and foodborne illness outcomes.
This study investigates the impacts of product liability laws on the number of reported foodborne illnesses, outbreaks, hospitalizations, and deaths in the U.S. during 1998–2018. Using panel OLS and Poisson models, we find a positive and statistically significant relationship between strict liability with punitive damages and the number of reported foodborne illnesses and outbreaks. These results are consistent with prior literature showing that strict liability can decrease product safety outcomes (Shavell, Reference Shavell1987; Chen and Hua, Reference Chen and Hua2012; Langpap and Wu, Reference Langpap and Wu2021). Strict liability shifts accident losses from consumers to producers and thus decreases the consumers' incentive to avoid risk. Furthermore, firm insolvency due to accident liability can also reduce firm prevention efforts under strict liability relative to negligence rule.
Another explanation for the positive relationship between liability law and foodborne illnesses may be that strict liability may encourage reporting and not necessarily increase actual foodborne illness cases. We examine the influence of strict liability on reported single-state hospitalizations and deaths and find no statistically significant relationship. If strict liability increases foodborne illnesses, then one may expect such a positive effect to be present both in reporting and in hospitalizations. The lack of statistical significance for the case of hospitalizations suggests that strict liability may not necessarily increase foodborne diseases but may encourage reporting. However, statistical insignificance of the effect on hospitalizations and deaths maybe because hospitalizations and deaths are extremely low probability events, resulting in low statistical power.
Food safety incidents are generally underreported (Scallan et al., Reference Scallan, Hoekstra, Angulo, Tauxe, Widdowson, Roy, Jones and Griffin2011; Arendt et al., Reference Arendt, Rajagopal, Strohbehn, Stokes, Meyer and Mandernach2013). Improved reporting can help public health agencies detect potential foodborne illness outbreaks. Sooner detection of foodborne illness outbreaks can help prevent the spread of illnesses. Improved reporting of food safety incidents can also improve foodborne illness morbidity cost estimates and support food safety policy decisions.
In sum, our results show that strict liability may result in more foodborne illnesses or greater reporting of such illnesses. This has two policy implications. On the one hand, strict liability with punitive damages does not necessarily decrease deaths or hospitalizations. In this respect, if the objective of the regulators is to minimize serious foodborne illnesses, strict liability with punitive damages does not appear to be an effective strategy. On the other hand, our examination of foodborne disease reports suggests that strict liability may increase foodborne diseases. In this respect, the liability rule may be useful if the aim is to improve foodborne illness reporting.
This study narrowly focuses on the relationship between product liability law and foodborne illnesses. Our findings do not allow for a cost-benefit analysis of strict liability rules. Therefore, we cannot provide recommendations as to whether the strict liability rule is economically efficient. We suggest that future research should compare costs and benefits of strict liability rule.
Data availability statement
Data and codes developed for and used in this analysis are available upon request from the corresponding author.
Funding statement
This work was supported by the National Institute of Food and Agriculture-United States Department of Agriculture (award number 1007004R). None of the coauthors have relevant material or financial interest in the subject matter addressed in this study.
Competing interests
None of the coauthors have competing interests.
Appendix A. Robustness check results
Table A.1. Poisson results for the number of reported single- and multi-state foodborne illnesses and outbreaks
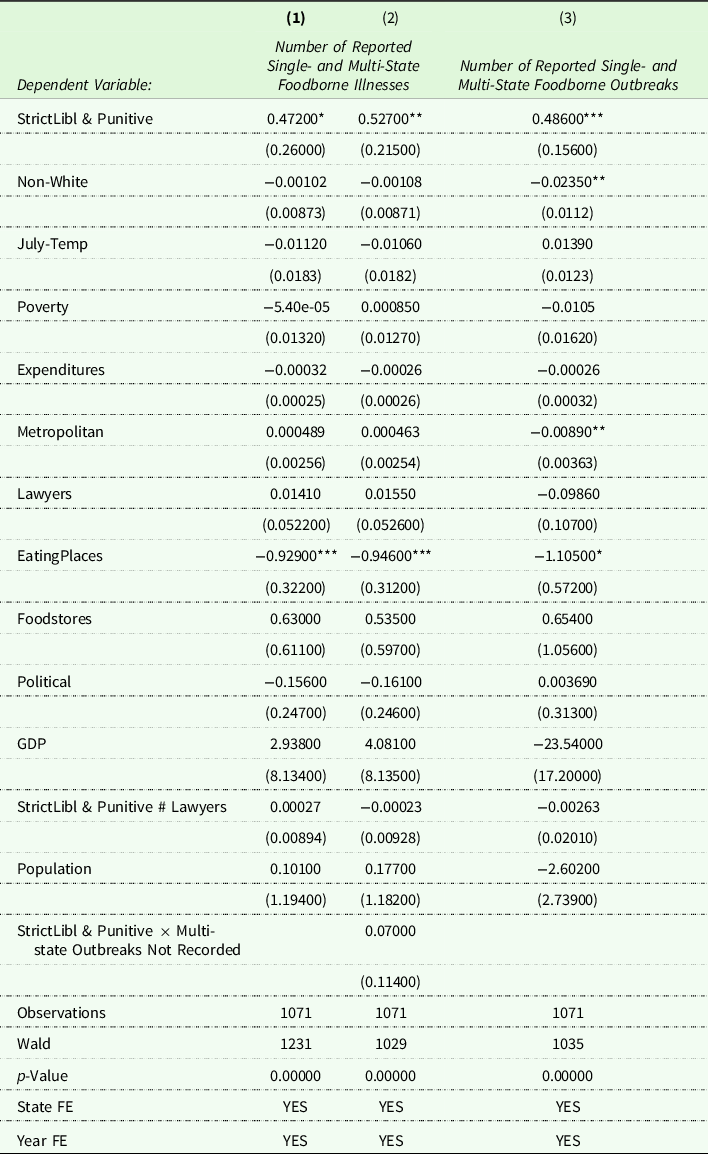
Notes: Standard errors in parentheses are clustered by states.
***, **, and * indicate the significance levels at 1%, 5%, and 10%, respectively.
Veggie Libel dropped because it is constant within group.
Table A.2. Regions fixed effect OLS estimates for the number of reported single- and multi-state foodborne illnesses and outbreaks per thousand people
Notes: Standard errors in parentheses are clustered by states.
***, **, and * indicate the significance levels at 1%, 5%, and 10%, respectively.
Table A.3. Regions fixed effect Poisson results for the number of reported single- and multi-state foodborne illnesses and outbreaks
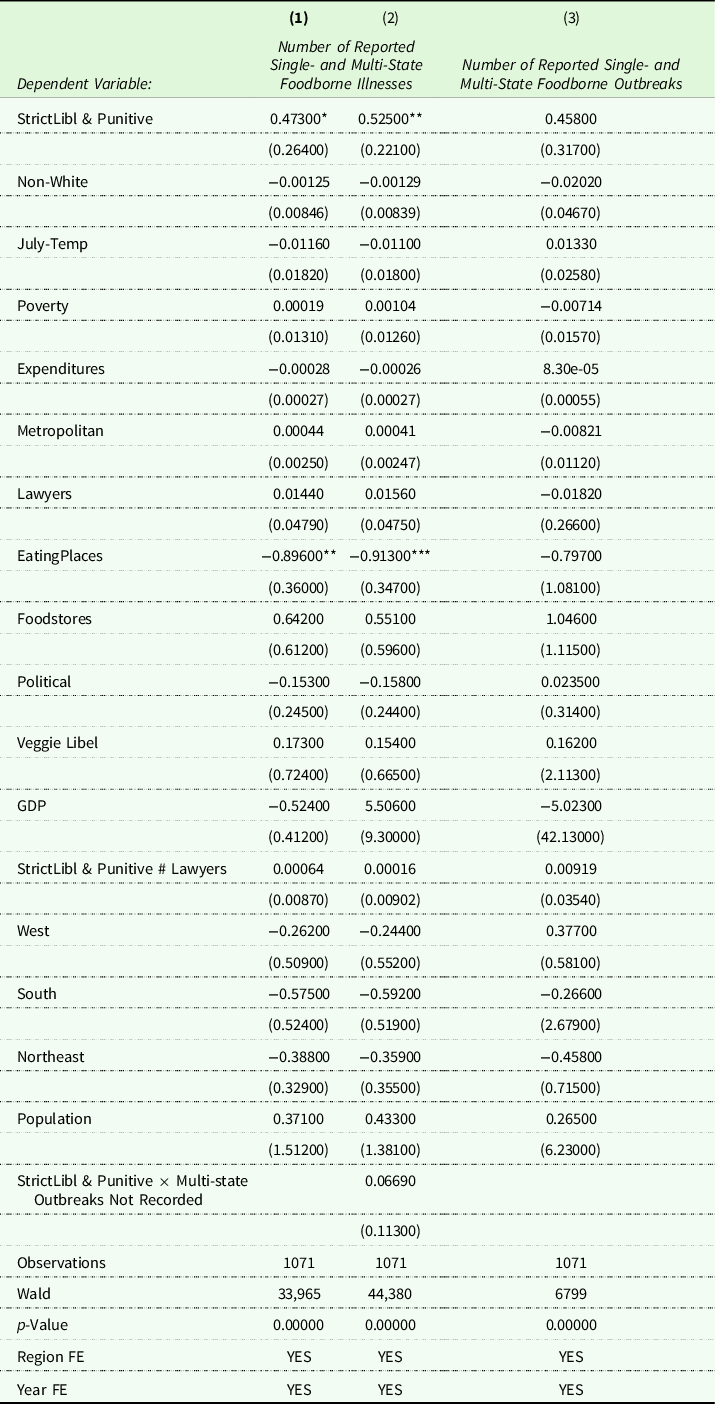
Notes: Standard errors in parentheses are clustered by states.
***, **, and * indicate the significance levels at 1%, 5%, and 10%, respectively.
Table A.4. Random effect OLS estimates for the number of reported single- and multi-state foodborne illnesses and outbreaks per thousand people
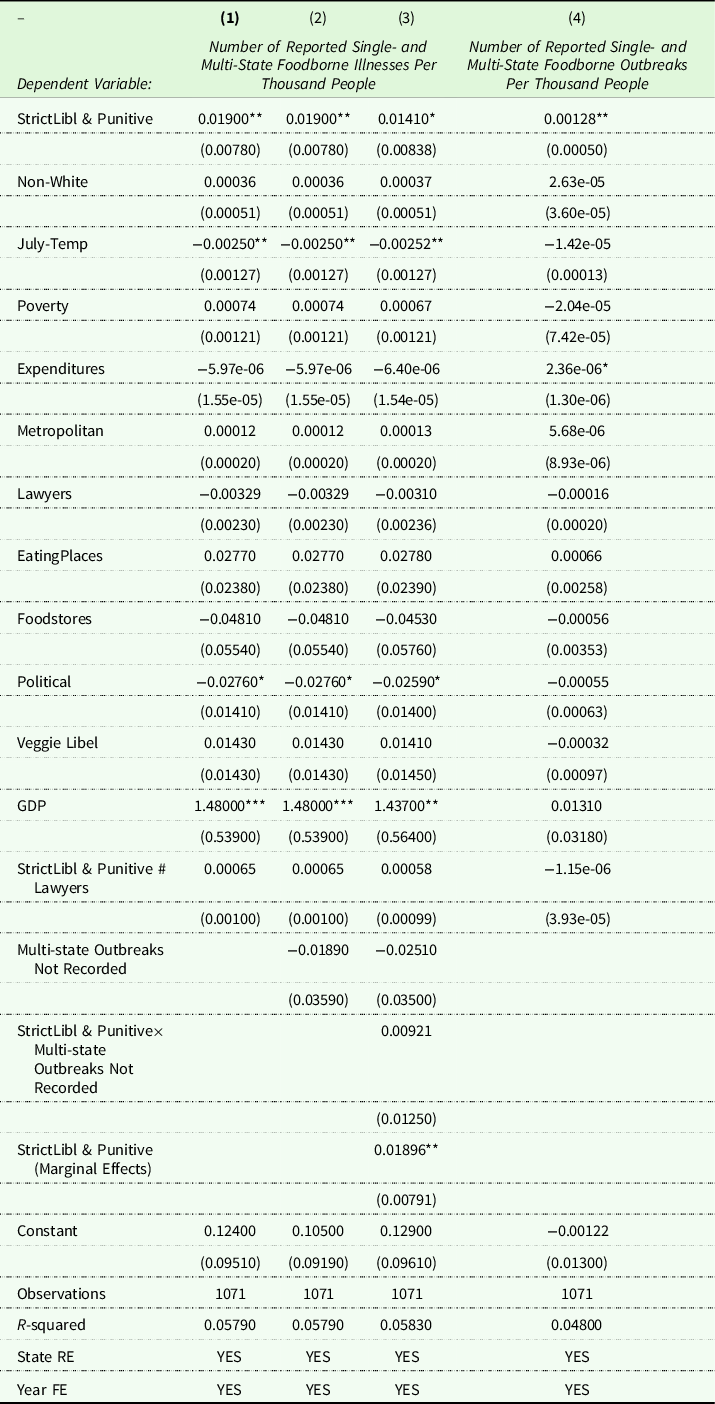
Notes: Standard errors in parentheses are clustered by states.
***, **, and * indicate the significance levels at 1%, 5%, and 10%, respectively.
Table A.5. Random effect Poisson results for reported single- and multi-state foodborne illnesses and outbreaks
Notes: Standard errors in parentheses are clustered by states.
***, **, and * indicate the significance levels at 1%, 5%, and 10%, respectively.
Table A.6. OLS estimates for reported single- and multi-state foodborne illnesses and outbreaks per thousand people with linear time trend
Notes: Standard errors in parentheses are clustered by states.
***, **, and * indicate the significance levels at 1%, 5%, and 10%, respectively.
Veggie Libel dropped because it is constant within group.
Table A.7. Poisson results for single- and multi-state foodborne illnesses and outbreaks with linear time trend

Notes: Standard errors in parentheses are clustered by states.
***, **, and * indicate the significance levels at 1%, 5%, and 10%, respectively.
Veggie Libel dropped because it is constant within group.
Table A.8. Spatially corrected OLS estimates for single- and multi-state foodborne illnesses and outbreaks per thousand people

Notes: Standard errors in parentheses are clustered by states.
***, **, and * indicate the significance levels at 1%, 5%, and 10%, respectively.
Table A.9. Spatially corrected Poisson results for single- and multi-state foodborne illnesses and outbreaks

Notes: Standard errors in parentheses are clustered by states.
***, **, and * indicate the significance levels at 1%, 5%, and 10%, respectively.
Table A.10. OLS estimates for single- and multi-state foodborne illnesses and outbreaks per thousand people including food categories
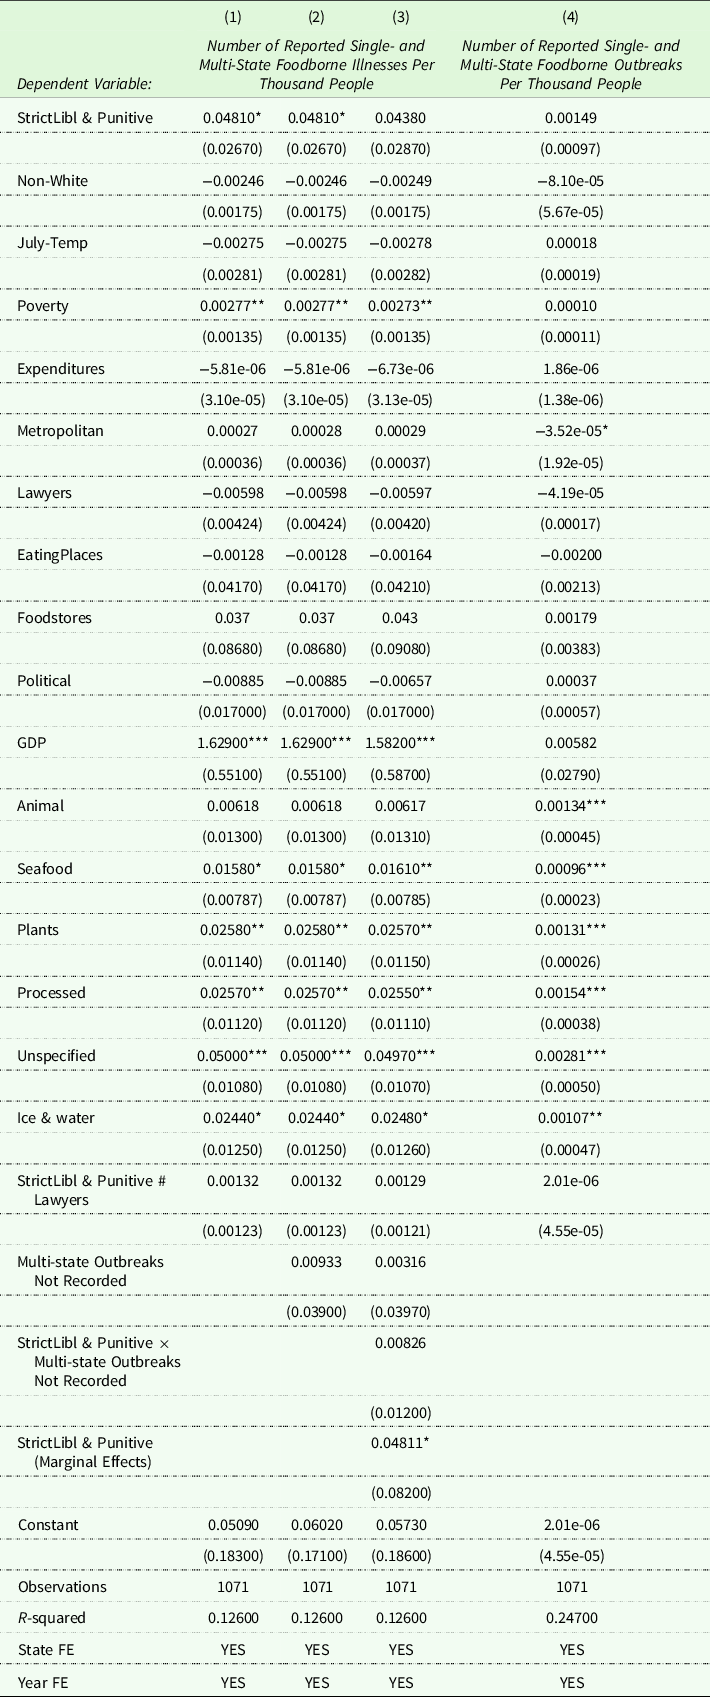
Notes: Standard errors in parentheses are clustered by states.
***, **, and * indicate the significance levels at 1%, 5%, and 10%, respectively.
Veggie Libel dropped because it is constant within group.
Table A.11. Poisson results for single- and multi-state foodborne illnesses and outbreaks including food categories

Notes: Standard errors in parentheses are clustered by states.
***, **, and * indicate the significance levels at 1%, 5%, and 10%, respectively.
Veggie Libel omitted because it is constant within group.
Table A.12. Regions fixed effect estimation results for single-state foodborne illness hospitalizations and deaths

Notes: Columns (1) and (5) report the OLS estimates where the dependent variables are the number of single-state foodborne illness-related hospitalization and deaths per thousand people, respectively. Column (2) presents the results of Poisson model where the dependent variables are the number of single-state foodborne illness hospitalizations and deaths, respectively. Columns (3) and (6) show the results of negative binomial model where the dependent variables are the number of single-state foodborne illness hospitalizations and deaths, respectively. Columns (4) and (7) show the results of Logit model where the indicator variables are equal to one if there is single-state foodborne illness hospitalization or death, respectively, and zero otherwise. Standard errors in parentheses in columns (1), (2), and (5) are clustered by states. The Poisson model with dependent variable as the number of foodborne illness deaths did not converge, hence, it is not reported here. ***, **, and * indicate the significance levels at 1%, 5%, and 10%, respectively.
Table A.13. Random effect estimation results for single-state foodborne illness hospitalizations and deaths

Notes: Columns (1) and (5) report the OLS estimates where the dependent variables are the number of single-state foodborne illness hospitalizations and deaths per thousand people, respectively. Columns (2) and (6) present the results of Poisson model where the dependent variables are the number of single-state foodborne illness hospitalization and deaths, respectively. Columns (3) and (7) show the results of negative binomial model where the dependent variables are the number of single-state foodborne illness-related hospitalization and deaths, respectively. Columns (4) and (8) show the results of Logit model where the indicator variables equal to one if there is single-state foodborne illness hospitalization or death, respectively, and zero otherwise. Standard errors in parentheses in columns (1), (2), (5), and (6) are clustered by states. ***, **, and * indicate the significance levels at 1%, 5%, and 10%, respectively.

Figure A.1. Distribution frequencies of foodborne illnesses, outbreaks, hospitalizations, and deaths.


 Open access