


Introduction
Economists frequently use auctions in experimental economics settings to measure consumers' preference for goods and services (List and Gallet Reference List and Gallet2001; Lusk, Feldkamp, and Schroeder Reference Lusk, Feldkamp and Schroeder2004; Lusk and Shogren Reference Lusk and Shogren2007). From a theoretical standpoint, most of these auctions (such as Vickrey, English, and Becker–DeGroot–Marschak (BDM)) are incentive compatible, meaning that participants have the incentive to bid their true willingness to pay (WTP)—the maximum amount they would be willing to spend on a product in a real market environment. Since a bid obtained from an auction is a point estimate of WTP, auctions are an attractive method as the data they generate is easier to work with econometrically and provide more efficient estimates than the information obtained from other methods such as yes/no decision in a posted pricesFootnote 1 format. Thus, it has become natural to emphasize auctions as a first-line valuation tool.
However, in the real world, consumers generally make purchasing decisions in a posted price setting, such as a grocery store or Amazon.com. In this environment, participants are price-takers, where they make yes/no decisions on whether or not to purchase an item at a given “posted” price. Therefore, what is implicit in the decision to use auction to understand consumer WTP is that, while some error in the value elicitation process may be inevitable, the WTP estimates from these auctions have applicability to decisions made in the more common postprice markets. However, since typical consumers rarely use auctions as their primary shopping method, an open question is whether consumers behave in an auction the way that is consistent with how they behave in a posted price market.
Researchers have been using posted price questions both in laboratory and in field settings to mimic a more common market setting. In this design, participants are asked a question: “Are you willing to purchase this item at $A?” Participants will spend $A to purchase the item if they choose “Yes”, while they will not get the item nor pay anything if they choose “No”. Since this framing of the purchase question resembles decisions consumers make every day about purchasing items at different posted prices, the design is easy for participants to understand. However, a disadvantage is that the experiment does not elicit the exact WTP for each participant—instead, it only indicates if WTP is above or below a certain value. Consequently, the mechanism is less statistically efficient and requires large sample sizes to produce the same level of precision as other methods (Loomis et al. Reference Loomis, Brown, Lucero and Peterson1997) such as auctions. Thus, a natural question arises: How do these two mechanisms compare?
In this research, we compare the estimated WTP from a variation of an English auction (Bernard Reference Bernard2006) and posted price questions. The experiment provided adult participants the opportunity to purchase jars of honey under these two mechanisms. Potential explanations of the discrepancy were also investigated. Furthermore, we compare the difference in marginal effects drawn from these two mechanisms.
Our results suggest that estimated mean WTP in auction is smaller than the posted price mechanism WTP in the range of 32–39 percent. We then seek to explain this result by testing different possible explanations. We found no evidence of anchoring effects. We did find evidence suggesting that the cause of low WTP estimates from auctions is associated with consumers' lack of familiarity with auctions, as well as the lack of engagement of off-margin bidders. In terms of the marginal effects of different product attributes, we find that the auction and posted price mechanisms provide consistent signs, which indicates that consumer preferences for different product attributes do not vary with the elicitation methods. While the signs of coefficients are consistent, the significance level is much higher in auctions. Therefore, a posted price mechanism requires a larger sample size to detect the same preference change.
Literature review
Auctions and posted price
Approaches involving incentive-compatible auction mechanisms (e.g., Vickrey, English, BDM, and random n th price) are widely used in experimental economics research to elicit values for consumer WTP as they provide a point estimate of WTP for each participant (Vickrey Reference Vickrey1961; Becker, DeGroot, and Marschak Reference Becker, DeGroot and Marschak1964; Shogren et al. Reference Shogren, Margolis, Koo and List2001). An auction is considered to be theoretically incentive compatible if the dominant strategy for participants is to bid their true values.
In the context of private-value auctions, where each participant knows what the item is worth to her but is uncertain of its value to other participants, both Vickrey and English auctions are theoretically incentive compatible (Vickrey Reference Vickrey1961). It has also been shown that the Vickery auction and English auction generate roughly equivalent results (Lucking-Reiley Reference Lucking-Reiley1999). This study implements an English auction with the sealed bids feature of the Vickrey auction (Bernard Reference Bernard2006; Dillaway et al. Reference Dillaway, Messer, Bernard and Kaiser2011). The auction is theoretically incentive compatible, and Bernard (Reference Bernard2006) demonstrated empirically that the participants were able to better learn and retain the dominant strategy of this auction mechanism, compared with traditional English and Vickrey auctions.
Economists have also adopted various posted price mechanisms in evaluation studies. For example, double-bounded posted price questions are widely used to elicit consumer WTP for new technologies (Li and McCluskey Reference Li and McCluskey2017), and researchers have studied how to best implement such a mechanism (e.g., Yoo and Yang Reference Yoo and Yang2001). In experimental settings with real monetary incentives, a single-bounded posted price format has become popular recently (Venkatachalam Reference Venkatachalam2004; Li, Kecinski, and Messer Reference Li, Kecinski and Messer2017). This is mainly because posted price choice activities are easy to implement, especially in field experiments that usually happen in real marketplaces surrounded by many distractions.
Comparisons of posted prices and auctions
The results are mixed from the few studies that have empirically compared relative WTP from posted price and auctions using incentive-compatible methods. In a recent article, Berry, Fischer, and Guiteras (Reference Berry, Fischer and Guiteras2020) compared WTP elicited from BDM and TIOLI (take-it-or-leave-it or posted price) mechanisms in a field setting in Ghana. It is reported that the average WTP for the baseline in the BDM was approximately 17 percent lower than that from TIOLI. Furthermore, the WTP estimates from the BDM were consistently lower than those from TIOLI in the actual rounds as well as the practice rounds, where different items were used. Frykblom and Shogren (Reference Frykblom and Shogren2000) compared a nonhypothetical posted price question to a Vickrey auction using a market good and did not find significant differences in resulting WTP estimates of the two methods. However, that experiment lacked training and practice rounds for the participants, which helps the participants to understand that the dominant strategy is to bid their true value (Lusk, Feldkamp, and Schroeder Reference Lusk, Feldkamp and Schroeder2004).
It is worth noting the stream of literature on the comparison of auctions and real choice experiments (RCE). In RCE, participants are presented with combinations of products at different price levels and are asked to choose the one they prefer most. Posted price could be viewed as a special case of RCE when there is only one choice combination. Most studies on this topic found that empirical WTP from RCE are significantly higher than WTP from auctions (Lusk and Schroeder Reference Lusk and Schroeder2006; Gracia, Loureiro, and Nayga Reference Gracia, Loureiro and Nayga2011), but other studies found contradicting results (Su et al. Reference Su, Adam, Lusk and Arthur2011), or no significant difference (Banerji et al. Reference Banerji, Chowdhury, Groote, Meenakshi, Haleegoah and Ewool2018). Corrigan et al. (Reference Corrigan, Depositario, Nayga, Wu and Laude2009) found that RCE provided more stable WTP estimates compared with auctions. RCE and posted prices are similar in the way that consumers make decisions rather than submitting bids. However, they differ significantly since participants in posted price make separate decisions for each product, while in RCE, participants make choices based on various product-price combinations.
Besides using auction and posted price mechanisms to elicit valuations for a product or environmental service, economists are often interested in the marginal effects of explanatory variables estimated in different applications. For example, many researchers and policymakers are interested in the WTP premium for specific environmental attributes in a product, such as the location (Wu et al. Reference Wu, Fooks, Messer and Delaney2015) and growing methods (Loureiro, McCluskey, and Mittelhammer Reference Loureiro, McCluskey and Mittelhammer2002). Surprisingly, little attention has been paid to comparing the marginal effect estimates between these two elicitation mechanisms. We fill this gap by including a comparison of the marginal effect estimates.
Potential explanations of the WTP difference
In the existing literature, several possible reasons on what might have caused the difference in WTP estimates of auction and posted price have been investigated. These candidate explanations include the anchoring effect, the asymmetric inconsistent preferences effect, and the lack of familiarity with auction formats.
The anchoring effect (also known as starting-point bias) occurs when respondents’ valuations are influenced by and biased toward the posted offer in posted price questions (Tversky and Kahneman Reference Tversky and Kahneman1974; Herriges and Shogren Reference Herriges and Shogren1996). This anchoring effect could influence both the decisions in the posted price setting and the subsequent auction bids (Ariely, Loewenstein, and Prelec Reference Ariely, Loewenstein and Prelec2003). While Frykblom and Shogren (Reference Frykblom and Shogren2000) did not observe any anchoring effect in posted price decisions and Kriström (Reference Kriström1993) as well as Berry, Fischer, and Guiteras (Reference Berry, Fischer and Guiteras2020) observed no anchoring effect in the auction bids, Green et al. (Reference Green, Jacowitz, Kahneman and McFadden1998) found strong evidence of anchoring on both tasks.
The asymmetric inconsistent preferences effect originates from the “yea-saying” effect in the contingent-valuation literature that describes a tendency for some respondents in hypothetical choice settings to choose affirmatively in a posted price setting regardless of their true preferences (Couch and Keniston Reference Couch and Keniston1960; Ready, Buzby, and Hu Reference Ready, Buzby and Hu1996). Therefore, it leads to an overestimation of overall WTP in the posted price setting. For instance, Kanninen (Reference Kanninen1995) concluded that 20 percent of respondents in the sample were “yea-sayers”. Ready, Buzby, and Hu (Reference Ready, Buzby and Hu1996) found similar evidence with 20–22 percent of the respondents being “yea-sayers” in a split sample contingent-valuation study for food safety improvements. However, as Frykblom and Shogren (Reference Frykblom and Shogren2000) noted, “nay-saying” has received little attention and seems to have been generally ignored in the contingent-valuation literature, while this effect would lower WTP from posted price settings. In the posted price setting with real economic incentives, it is possible that similar effects might still be present. If these effects resulted in differences in WTP estimates between posted price and auction, we could treat the auction bids as the “undisturbed preferences” and test whether the participants deviated significantly to one side from the bids. For example, one inconsistency resulting from “yea-saying” would be when the auction bid is lower than the posted price offer, but the participant accepted the posted price; the inconsistency resulting from “nay-saying” would be when the auction bid is higher than the posted price offer, but the participant rejected the price. These two inconsistent preferences would cause WTP discrepancies between posted price and auction if their effects were asymmetric.
A lack of familiarity with auction is another potential explanation. Plott (Reference Plott, Arrow, Colombatto, Perlman and Schmidt1996) in the discovered preference hypothesis (DPH) casts economic decision-making as a process of discovery that assumes that participants have stable underlying preferences that are consistent with expected utility maximization. If there is appropriate feedback, decision-making converges to expected utility behavior in a series of three steps, starting with myopic “impulsive” behavior and gradually advancing to behavior that is more systematic as the decision-maker gains additional information through familiarization and feedback. As the NOAA panel pointed out, open-ended questions typically lack realism and are sensitive to trivial characteristics of the scenario presented. In contrast, posted price questions better approximate an actual purchasing environment and are easier for respondents to answer accurately (Arrow et al. Reference Arrow, Solow, Portney, Leamer, Radner and Schuman1993). Although one cannot claim that either posted price or auction reveals the “correct” WTP, posted price is obviously the format that is more familiar, easier to understand, and similar to a real-world purchasing decision. Familiarity with auctions is a form of institutional information and choice framing, and many consumers may not be familiar with auction formats because they do not routinely participate in any form of auction. In that case, we would expect to see an experience effect as an auction's rounds progress. Empirically, Corrigan et al. (Reference Corrigan, Depositario, Nayga, Wu and Laude2009) observed such a round effect in uniform-price Vickrey auctions, suggesting that more effort must be taken to familiarize participants in auctions. Berry, Fischer, and Guiteras (Reference Berry, Fischer and Guiteras2020) also mentioned that misunderstanding or uncertainty of the BDM mechanism in a field experiment may contribute to a WTP estimate discrepancy from the posted price.
Beside the explanations offered in the literature, it is also possible that participant engagement plays a role in repeated auction experiments. Roosen, Marette, and Blanchemanche (Reference Roosen, Marette and Blanchemanche2010) explored how BDM compares with a discrete choice mechanism that evaluates WTP by measuring the propensity of substitution between two goods and found that differences in WTP disappear when considering only engaged bidders with nonzero bids. Even though the discrete choice mechanism is more similar to RCEs than posted price since participants are making a series of choices between two goods with different price vectors, the finding demonstrates that bidder engagement may impact the elicited WTP in auctions. Similarly, Berry, Fischer, and Guiteras (Reference Berry, Fischer and Guiteras2020) found in a field experiment with BDM that participants with less at stake may not take the auction seriously.
Contribution to the literature
Our study contributes to the literature in several ways. First, we carefully design an experiment that avoids many drawbacks of existing ones in the literature. Instead of using the student population, we made efforts to target on primary shoppers of households since it has been shown that experience with the good can reduce market anomalies (List Reference List2003). Compared with the literature, our experiment includes more extensive training, including written instructions, oral presentations, and two training rounds to give participants better understanding on their tasks. In a setting with unfamiliar tasks, extensive training is necessary because even if subjects are told it is in their best interest to bid their “true value”, subtle misconceptions about how the elicitation mechanism works might trigger subjects to default to the strategies associated with familiar auctions (Plott and Zeiler Reference Plott and Zeiler2005). Moreover, we argue that for our purposes, running an experiment in a more controlled environment in terms of information and feedback introduces less noise into participants' decision-making process compared with a field setting (Plott Reference Plott, Arrow, Colombatto, Perlman and Schmidt1996). Second, we test if discrepancies exist using both a within-subject and a between-subject design. Compared with the literature where only one kind of comparison is used, combining both within- and between-subject design adds robustness to our results. Third, we introduce more flexible price vectors into the posted price section. Since prices vary randomly for each posted price question, we control for the possibility that consumers treat the price offers as a quality signal and, therefore, alleviates valuation being anchored to the price offers. Using flexible price vectors also avoids picking inappropriate price offers in the situation where it is difficult to form fixed price points or appropriate widths between each price point. Fourth, we explicitly test for several possible explanations for the discrepancy and provide our own explanation. Lastly, few studies have compared important findings generated by auctions versus posted price mechanisms other than the mean WTP. However, auctions are not mainly used to measure average WTP for products. Rather, they are often adopted to measure the relative WTP for product attributes, information and policy treatment effects, and heterogeneous demographic responses. Therefore, we further extend the research question to comparing the sign and statistical significance of coefficient estimates.
Experimental design
We designed a homegrown-value artefactual field experiment in which we offered adult subjects the opportunity to purchase honey presented in a variety of jars. This research was conducted in an experimental economics laboratory at a large university in the Northeastern United States. We recruited 115 adult participants through various sources that included the university's online newspaper, local community meetings, emails to staff members, and the laboratory's Web site. We endeavored to recruit adult consumers rather than students so that the sample would better represent the community as a whole and to ensure that participants were experienced buyers (List Reference List2003; Chang, Lusk, and Norwood Reference Chang, Lusk and Norwood2009; Gracia, Loureiro, and Nayga Reference Gracia, Loureiro and Nayga2011).
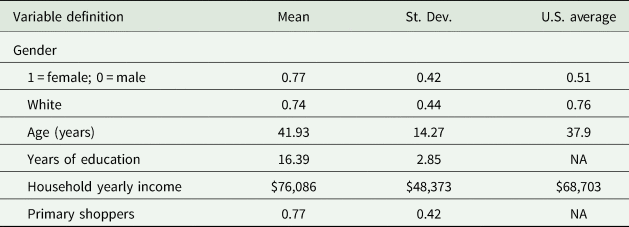
Table 1 describes the socio-demographic characteristics of the participants as well as a comparison with the U.S. Census. The average participant age was about 42 years. Most of the participants were female and it was expected and desirable, as we targeted primary shoppers in the households. About 74 percent of the participants identified themselves as white, which is close to the national average of 76 percent. The average household income was between $70,000 and $80,000 and the average number of years of education was 16. The relatively high education level and income among the participants likely reflects the population of a university town.
Table 1. Sample demographic characteristics
As with most experimental studies, sample representativeness is a concern. The participants in our sample may not be perfectly representative of the honey consumer population. Meanwhile, there may be some sample selection bias as we likely oversample people who are interested in participating in research studies and are interested in scientific information.
Fifteen 1-h sessions were held, with participants receiving $20 in cash and/or products for the session ($5 showup fee and $15 to be spent during the experiment). The participants were informed that they could keep any portion of the money that they did not spend and that they would be given the opportunity to purchase a jar of honey during the session. The participants received the money and products purchased at the end of the session.
At the beginning of the experiment, the administrator randomly assigned the participants to computer terminals equipped with privacy screens to ensure confidentiality. The participants were asked to read information about the experiments once they were seated. A presentation then was given to explain the steps involved and how to use the program. No communication among the participants was permitted, but the participants were welcomed to ask questions to the administrator at any time. Data was collected through the use of Excel files that were programmed with Visual Basic with Applications and stored in an Access database.
The experiment involved investigating the effects of labeling and packaging on consumers' WTP for honey products. Specifically, we tested WTP for honey of three origins (local, domestic, and international) that were each distributed to five types of jars that had different shapes but the same volume (12 ounces), making 15 jar/origin combinations. In the auction, participants bid on all 15 honey products. In the posted price rounds, they made purchase decisions for the five jars of U.S. honey only. Therefore, each participant made 20 honey-purchasing decisions in total. In this article, we limit our comparison of WTP estimates with purchases of U.S. honey because it is the most commonly sold item in grocery stores and is the most familiar with the general public. A set of labeled jars (Jar 1, Jar 2,…, Jar 5) of honey was placed on the administrator's desk and on the desk of each participant throughout the experiment, and the participants were encouraged to examine the items, but not open the jars. Since the three types of honey (USA, international, and local) were indistinguishable in terms of appearance, we just displayed the U.S. honey due to desk space constraints. The sequence of the posted price experiment and the auction experiment was randomly determined before the session, and the order in which the products were presented was also randomized.
To address the concern of demand reduction, at the end of each session, only one of the 20 decisions made by the participants (15 in the auction and five in the posted prices) was selected at random to determine which product would be binding and used to calculate cash earnings (List and Lucking-Reiley Reference List and Lucking-Reiley2000; Lusk, Feldkamp, and Schroeder Reference Lusk, Feldkamp and Schroeder2004; Messer et al. Reference Messer, Poe, Rondeau, Schulze and Vossler2010). This binding decision was selected by having a volunteer draw a labeled ball from a cage containing 20 balls, each representing one decision. In order to reinforce the understanding of this concept, demonstrations of how the ball would be drawn to determine the binding round were shown to the participants prior to them making any decisions. It was also emphasized that no decision was affected by prior or subsequent decisions. As explaining the dominant strategy to participants in homegrown-value experiments is regarded as “best practice” and is widely used, we also informed the participants that it was in their best interest to bid as close to the worth of the item to them as possible (Rutström Reference Rutström1998; Lusk, Feldkamp, and Schroeder Reference Lusk, Feldkamp and Schroeder2004).
In the posted price experiment, the question to the participants was, “Are you willing to purchase Jar Y of U.S. honey at $A?” The price of each product varied randomly for each decision and was distributed uniformly between $0 and $15. The participants were informed that clicking “yes” was a decision to purchase the jar of honey at the posted price; clicking “no” meant they would not receive Jar Y nor pay the price.
In the auction, a number representing the participant's bid for the item was shown on the screen in front of each participant. Once the auction started, this bid increased incrementally at a speed of about $0.10 per second from $0 to $15.Footnote 2 The participants were asked to click the “withdraw from auction” button when they saw the bid representing the maximum amount they were willing to pay for the product displayed on the screen. When they indicated a desire to withdraw from the auction, a second box appeared that asked them to confirm the number on their screen as their bid. The participants could choose to restart the auction round (incremental ascending increases in the number) from $0 and bid again or could confirm the bid and submit it. The auction stopped either when all participants' bids were confirmed or when the bid reached the preset upper limit of $15. The bids by each participant were stored in a database and the auction then proceeded to a new bidding decision.
To help the participants better understand the bidding procedure, two practice rounds were held first. The participants were given $3 in the practice rounds and were asked to submit bids on a pencil and a ballpoint pen. In the practice auction, the winner and the second highest bidder were announced after each round. It was emphasized to the participants that the winner pays only the amount of the second highest bid so it was in their best interest to focus on determining their own value for the item and to bid as closely to that as possible.
After the practice rounds, the participants were asked to submit bids on different jars of honey following the same procedure. This research followed the proposed “best practice” in Harrison, Harstad, and Rutström (Reference Harrison, Harstad and Rutström2004) to clearly train and inform the subjects that their dominant strategy is to bid their true value. At the beginning of each new purchasing decision, the participants were provided with the list of items already auctioned and the bids they submitted for each. After each decision, no feedback was given to the participants with regard to the winner or the winning price as a means of reducing market feedback (Corrigan et al. Reference Corrigan, Drichoutis, Lusk, Nayga and Rousu2011). At the end of the session, the participants were asked to fill out a survey about their demographics background and consumer behavior.
The only announcement was the winner of the binding round at the end of the experiment. This was done by having a volunteer draw a ball to determine which of the 20 purchase decisions was binding. Each participant's screen then displayed a chart showing their decisions and products. Based on this binding decision, the computer program calculated each participant's earnings and products purchased (if any) and displayed them on that person's screen to assist them in filling out receipts.
Model and testable hypotheses
In this section, we describe the model and the hypotheses that we will be testing in the experiment. We proceed by first verifying if WTP estimate difference exists between the two value elicitation methods. We then test if the observed difference (if any) is a result of the interinfluence between the posted price and the auction parts. Next, we examine two other behavioral factors that may result in WTP estimate differences. We conclude by comparing the marginal effects offered by the two elicitation methods.
Comparison of posted price and auction WTP elicitation
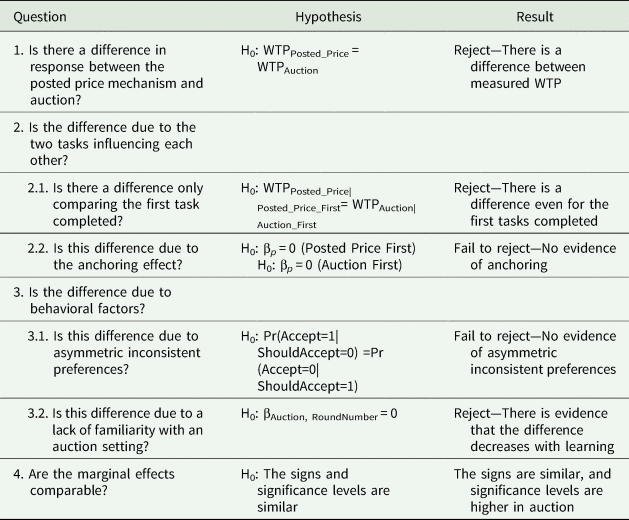
The series of hypotheses tested in this research are summarized in Table 2. The first hypothesis is that the WTP estimates from the posted price mechanism equal to those from the auction.

where WTPPosted_Price denotes WTP estimates obtained from the posted price questions and WTPAuction denotes WTP estimates derived from the experimental auctions.Footnote 3
Table 2. Hypotheses
The posted price generates binary responses, while the auction generates continuous bids. To make the two types of data comparable, the auction data can be transformed to simulated binary responses, or average WTP point estimates can be inferred from posted price responses. For consistency with the literature, we follow the procedure documented in Green et al. (Reference Green, Jacowitz, Kahneman and McFadden1998) and Frykblom and Shogren (Reference Frykblom and Shogren2000) where the auction data is transformed into synthetic binary responses and compared with the actual responses. Let bij denote the bid that participant i submit for good j, and pij denote the posted price offer of participant i for good j, and δij denote whether participant i responded yes in the posted price section for good j. Since each participant responded in both the auction and the posted price formats, we can compare their auction responses, bij, with the binary response that would be consistent with the prices they see in the posted price section, pij, for the same good. We generate a synthetic posted price choice response variable ${\rm \delta }_{ij}^{\prime}$ , where ${\rm \delta }_{ij}^{\prime} = 1$
 if bij ≥ pij; ${\rm \delta }_{ij}^{\prime} = 0$
 if bij < pij. Here, ${\rm \delta }_{ij}^{\prime}$
 can be interpreted as when facing the price offers, what participants' response would be based on the bids they indicated. Theoretically, if the null hypothesis holds, we will not observe a significant difference in the WTP inferred from δ and δ′.
To test if δ and δ′ significantly differ from each other, we perform both parametric and nonparametric tests. The advantage of a nonparametric test is that no distributional assumption is placed on the variables. Since δ and δ′ are binary variables and since these are considered as paired observations, we use McNemar's nonparametric test (McNemar Reference McNemar1947).
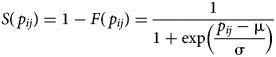
Since nonparametric tests generally have lower power than parametric tests, we also do a parametric test assuming a normal/logistic distribution on the underlying WTP (Frykblom and Shogren Reference Frykblom and Shogren2000). Formally, we assume that a consumer's WTP, w, follows some probability distribution with μ as the location parameter and σ as the scale parameter. We denote F as the cumulative distribution function and S as the survival (or duration) function. Therefore, for a given posted price offer p, F(p) = Prob(w ≤ p), S(p) = 1 − F(p) = Prob(w > p), f(p) = dF(p)/dp. So, the survival function, in this case, represents the probability that a “yes” response in the posted price format will continue above a given price. We estimate μ and σ by maximizing the log-likelihood function L, which is written as

where δij is equal to 1 if participant i accepted posted price offer for the j th object (p ij) and equal to 0 otherwise. The survival function for normal distribution is

For logistic distribution, the corresponding function is
The estimated mean for both distributions is μ, the estimated variance for normal distribution is σ2, while for the logistic distribution, it is σ2π2/3.
From this maximum likelihood estimation, we would be able to infer the distribution of WTP that generated the posted price responses. To test if the estimated mean from the two samples is different, we follow the same test as Frykblom and Shogren (Reference Frykblom and Shogren2000), which is recommended by Kimenta (Reference Kimenta1986):

where Z is an approximately standard normal variable, w k is the estimated mean in offer format k, $s_i^2$ is the estimated sample variance, and n i is the sample size.
Possible task interinfluences
Since our experiment consists of different tasks within a subject, we address the most common problem for a within-subject design—the tasks potentially influencing each other. We do this in two ways: first, we test if the difference still exists if we only utilize the first task that each participant completed; second, we test for the anchoring effect to see if the bids in the auction are influenced by posted price offers that were presented to the participant.
Testing for a difference using first task only
The intuition is to make comparisons only from data of the first task that a participant did. Specifically, we estimate WTP only from participants who went through the auction first and compare with posted price WTP estimates from participants who did the posted price first. In this way, we are actually making a between-subject comparison. The procedure used for this test is similar to the one described earlier where we transfer auction data into yes/no responses and compare it with the posted price data. One issue in generating the synthetic yes/no responses is that there does not exist a corresponding relationship between the auction-first group's bids and the posted price-first group's price offers. Therefore, we use a complete combinatorial approach similar to the one suggested in Poe, Giraud, and Loomis (Reference Poe, Giraud and Loomis2005). For every auction bid (suppose n 1 total observations), we generate a yes/no response according to every posted price offering (suppose n 2 total observations), resulting in n 1*n 2 pairs of observations on bids (b), synthetic yes/no (δ′), price offer (p), and real yes/no response (δ). Next, we compare δ with δ′ following the procedure discussed before.
Testing for the anchoring effect
We randomized the posted price offered for each decision in the experiment to control for a possible anchoring of participants' valuation of each item to the posted price. However, posted price offers might still be affecting consumers' value formation process in two ways. First, the WTP estimates from posted price could increase if the participant saw a higher posted price offer for the item (Frykblom and Shogren Reference Frykblom and Shogren2000). Second, the WTP estimates from the auction could be affected by the posted price offers if the subject participated in posted price first (Kriström Reference Kriström1993). We assume that if the underlying valuation of the product is changed by the posted price offer, it is likely reflected in both the posted price part and the auction part, meaning that the presence of the two presentations of anchoring effects is positively related. The design allows us to test for the second type of anchoring effect by a Tobit model that includes posted price offers as an independent variable. Since bids were limited to a range of $0–$15, a two-limit random-effects Tobit model was appropriate to analyze WTP.Footnote 4 The dependent variable is defined based on a latent variable $y_{ijk}^{\rm \ast }$ that cannot always be observed and is specified as

For subject i and item j, $y_{ij}^{\rm \ast }$ is limited to a value between 0 and 15 and depends linearly on Xij via a parameter (vector), β. The following random-effects Tobit model was used:

where α is the average bid for the entire population, Ui represents the individual random effects, and uij is the error term for individual i for product j. We also include a specification with bootstrap standard errors. The variables Jar type 2 through Jar type 5 are dummy variables indicating which item was auctioned.
Under the null hypothesis that there is no anchoring effect, we would expect that βp = 0 when the posted price section is before the auction. Meanwhile, when the posted price section is after the auction, it is expected that an anchoring effect should not be observed. We test these two hypotheses separately.Footnote 5 Specifically, as Hypothesis 2 in Table 1, we test:
-
H0: βp = 0 when posted price is before auction
-
H0: βp = 0 when posted price is after auction
Testing for behavioral factors
After testing for potential interinfluences between the tasks, we investigate behavioral factors that may result in WTP estimate differences between the two methods. As explained previously, asymmetric inconsistent preferences and the fact that participants are more unfamiliar with auctions may both lead to discrepancies in WTP estimates.
Asymmetric inconsistent preferences hypothesis
If asymmetric inconsistent preferences were the cause of the WTP discrepancy, we would expect to observe a difference in the following two inconsistencies: (1) when the bid is higher than the price and (2) when the bid is lower than the price. When a participant answers “yes” to a posted price question even though the price is higher than their bid, we define it as “affirmative inconsistent preference”. In contrast, when a participant answers “no” to a posted price question even when the price is lower than their bid, we define it as “negative inconsistent preference”. Affirmative inconsistent preference can be denoted as: WTP in posted price offer (p) > bid in auction (b), meaning when δ′ = 0, δ = 1. Negative inconsistent preference can be denoted as: WTP in posted price offer (p) < bid in auction (b), meaning when δ′ = 1, δ = 0. If the inconsistent preferences cause the WTP discrepancies, we would expect that one inconsistency would be more prevalent than the other. We test whether the probability of an affirmative inconsistent preference is larger than the probability of a negative inconsistent preference—specifically, whether Pr(δ = 1 | δ′ = 0) > Pr(δ = 0 | δ′ = 1). If this hypothesis is rejected, it means that participants are not more likely to have affirmative inconsistent behavior than negative inconsistent behavior, and asymmetric inconsistent preference does not explain any discrepancy.
Familiarity hypothesis
As compared with answering a posted price question, auction is a mechanism that is relatively unfamiliar with most participants. Even if participants do not receive direct feedback after each round, all information available to a participant may evolve due to additional opportunities for introspection, belief reinforcement, learning, and similar mechanisms. In that case, we would expect to see an experience effect as an auction's rounds progress. We test if roundnumber (the number of bidding decisions a participant has made) has an effect on the bids. Under the null, βAuction, RoundNumber would be significantly different from 0. Specifically,
-
H0: βAuction, RoundNumber = 0
Comparing marginal effects in the two methods
Despite any WTP estimate differences that may exist and the reasons that may cause the differences, in practical research, we are often not only interested in the absolute WTP estimates of a homegrown good, but also care about the marginal effects, or the ability that the estimation method is able to provide relative comparison conclusions on the effects of some particular attributes. When the research question is not about estimating absolute WTP values but instead about testing the marginal effects of attributes, it is important to learn if the two mechanisms provide similar results. We compare the marginal effect estimates on jar attributes from the two parts in terms of the signs and significance levels of the coefficients.
Results
Descriptive statistics on bids and posted price
A histogram on the frequency distribution of the bids is displayed in Figure 1. The majority of bids was in the $2.00–$4.00 range. The mean of the bids was $2.91 and the standard deviation was 1.97. Figure 2 shows the frequency distributions of posted prices conditioning on whether the posted price was accepted or declined. As expected, the number of “Yes” choices decreases as prices go up, and the number of declines increase as prices increase. In general, we do not observe fat tails in the distributions.
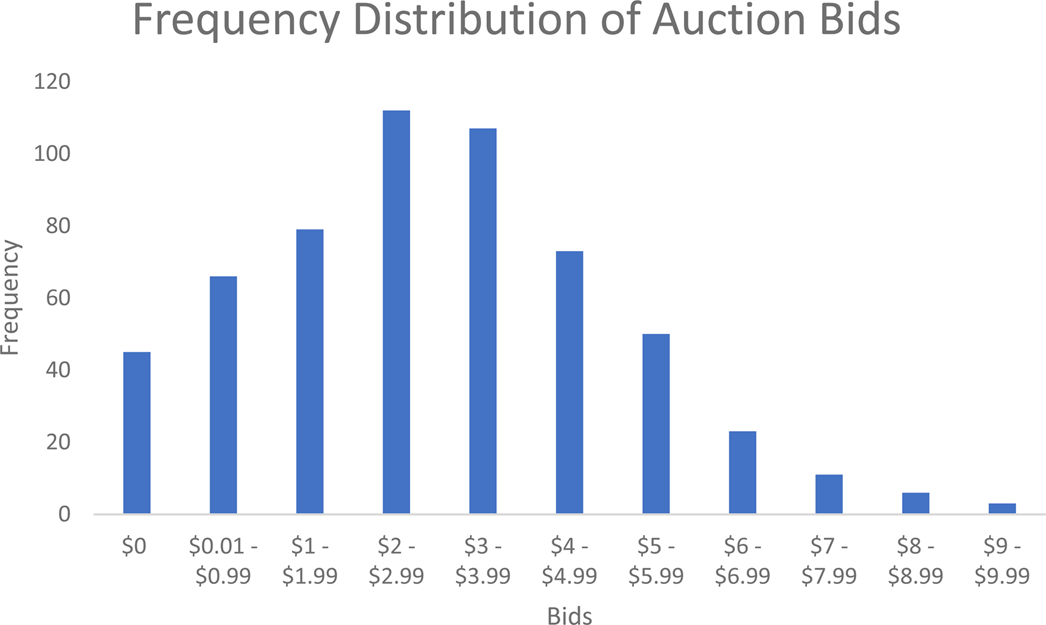
Figure 1. Frequency distribution of bid amounts in the auction
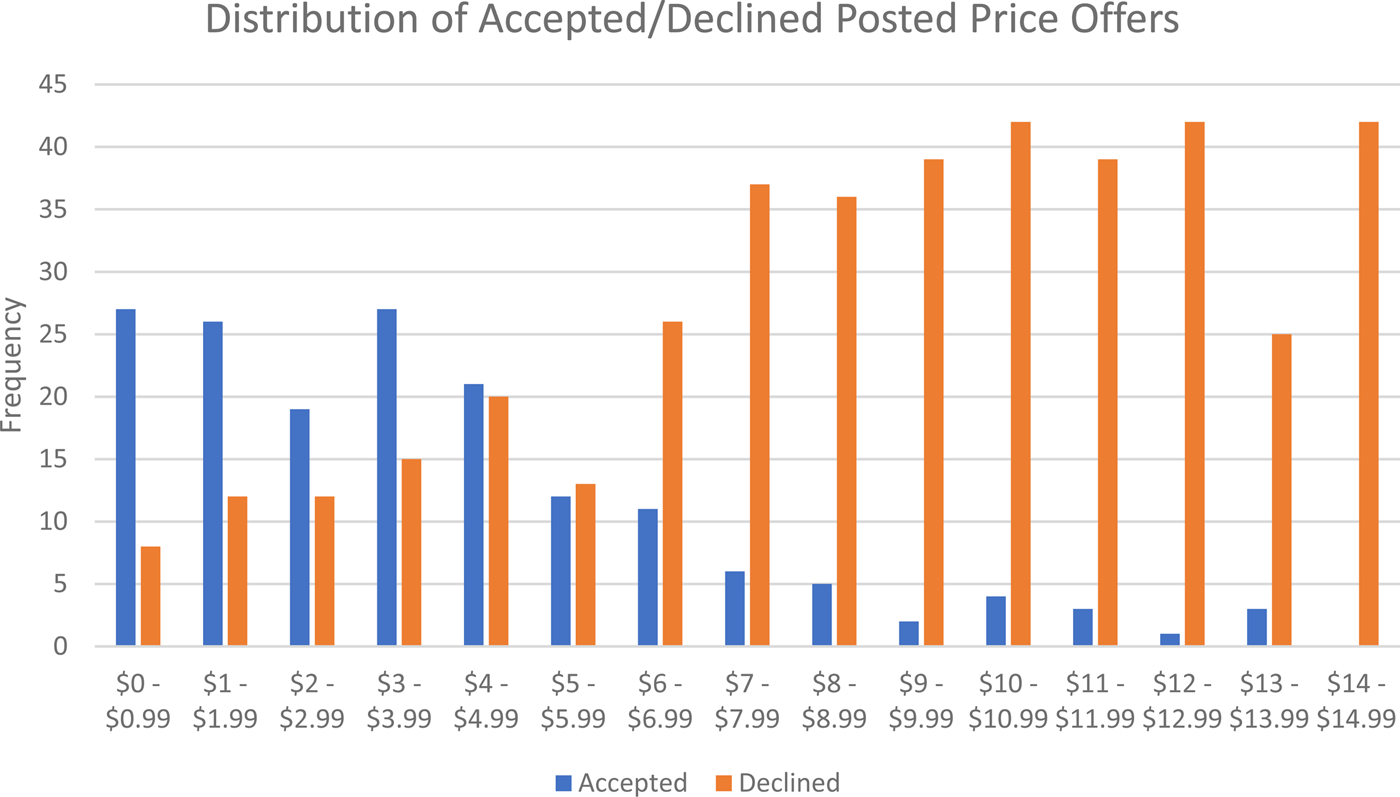
Figure 2. Frequency distribution of accepted and declined posted price offers
In total, there were 45 zero bids in the auction. Out of the 115 participants, four people (3.5 percent of the total participants) bid zero for all five auctions of honey. This seems to be a reasonable proportion of people who would not be interested in purchasing honey at any price. Of these four participants, three also declined the honey in all the posted price questions. So, their behavior appears to be generally consistent.
Hypothesis 1: test for response difference, H0: WTPposted_Price = WTPAuction
As shown in Panel A of Table 3, for a within-subject comparison, the average of the actual binary response (δ) in posted price is 0.2904; the average of the generated synthetic binary response (δ′) based on bids in the auction and posted price offer is 0.1652. Since McNemar's χ2 test statistic equals 150.45 and the corresponding p-value is less than 0.0001, we reject the null hypothesis.Footnote 6 This indicates that, compared with their actual behavior in posted price questions, participants are less likely to accept the same offer based on response inferred from their bids in auction.
Table 3. Within-subject comparison of estimated WTP from posted price and auction
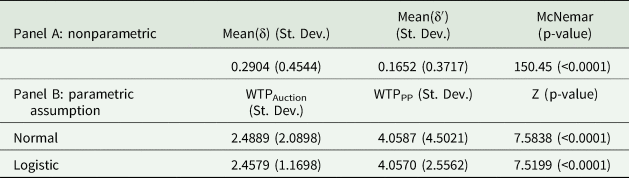
Table 4. Between-subject comparison of estimated WTP from posted price and auction
As discussed earlier, we also do parametric tests assuming that the underlying WTP distribution is either normal or logistic (Panel B of Table 3). With a normal distribution, the estimated WTP from auction bids has a mean of 2.4889, while the estimated mean of WTP from posted price is 4.0587. A Z test rejects the null hypothesis that the two WTP means are equal. With a logistic distribution assumption, the results are similar. The estimated mean of WTP is 2.4579 for auction bids and 4.0570 for posted price. The Z test also rejects the null at 1 percent level. The results suggest that WTP estimate from the auction is approximately 39 percent lower than that from posted price. The above results demonstrate that the WTP inferred from auction is significantly lower than that from posted price.
Test for task interinfluences
To address potential concerns that a within-subject design involving two tasks might influence each other, we test for the discrepancy using first task only and then test for anchoring effects between the tasks.
Hypothesis 2.1: test for discrepancy using first tasks only, H0: WTPPosted_Price|Posted_Price_First= WTPAuction|Auction_First
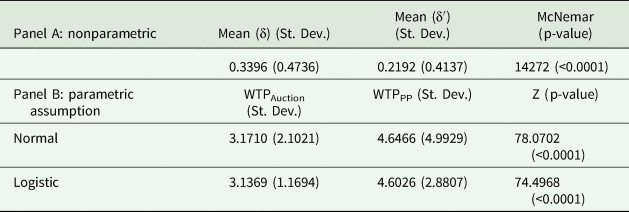
We conducted a between-subject comparison using data only from the first task each participant completes. In other words, we generate WTP estimates for auction from participants who did auction first and then generate WTP estimates for posted price from those participants who did posted price first. Since there is no one-to-one corresponding relationship between the bids and posted price offers, we do a complete combinatorial procedure (Poe, Giraud, and Loomis Reference Poe, Giraud and Loomis2005) on bids and price offers to generate a synthetic binary response (δ′) and compare it with the corresponding actual binary response (δ). Again, a McNemar's test rejects the null that the two series are equal, suggesting that participants are less likely to accept the same posted price offer based on response inferred from the auction (Table 4).
In a similar fashion, we conducted parametric tests assuming either normal or logistic distribution on the underlying WTP. Under normal distribution assumption, the estimated mean WTP is 3.171 for auction and 4.647 for posted price. Under the assumption of logistic distribution, the estimated mean WTP is 3.137 for auction and 4.603 for posted price. In both cases, Z test rejects the null that the two estimated means are equal. This indicates that estimated mean WTP from auction is approximately 32 percent lower than that from posted price.
Hypothesis 2.2: the anchoring effect
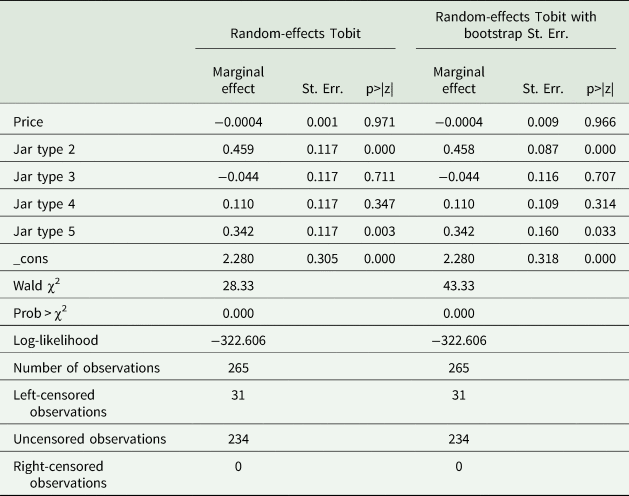
We perform a test similar to that of Kriström (Reference Kriström1993), where we examine if the respondents' auction bids are anchored to the posted price offers when they participated in the posted price setting first. To test H0: βp = 0 when posted price were conducted first, we regressed the bids on posted price offers from sessions in which the posted price mechanism was conducted first (Table 5). The left panel of Table 5 reports a random-effects Tobit model, while the right panel reports the same model with bootstrapped standard errors included. As shown in both panels of Table 5, H0: βp = 0 cannot be rejected, meaning we find no evidence that posted price in early rounds influenced subsequent bids in the auction.
Table 5. Test for anchoring when posted price is before auction
Similarly, to test H0: βp = 0 when auctions were held first, we regressed the bids on posted price offer from sessions in which the posted price mechanism was conducted first. Again, the left panel of Table 6 reports a random-effects Tobit model, while the right panel includes bootstrap standard errors. As both panels demonstrate, posted price offers do not have an effect on bids when auction was conducted first. Therefore, no anchoring effect is observed.
Table 6. Test for anchoring when posted price is after auction

In sum, we conclude that WTP estimates from auction significantly differ from WTP estimates from posted price and it is not likely a result of the two tasks influencing each other but rather due to behavioral reasons.
Tests for behavioral factors
Hypothesis 3.1: the asymmetric inconsistent preference effect
We test the hypothesis that the proportion of affirmative inconsistency is greater than the proportion of negative inconsistency. Of the 480 times when WTP estimated from the posted price setting was higher than WTP estimated from the auctions, affirmative inconsistency occurred 89 times. Of the 95 times when WTP under posted prices was lower than under auctions, negative inconsistency happened 17 times. A proportion test of equality does not reject the null hypothesis that the two proportions are equal (a p-value of 0.88). Thus, the proportion of affirmative inconsistency is not significantly greater than the proportion of negative inconsistency. Therefore, this hypothesis is rejected and asymmetric inconsistent preferences should not be driving the differences in WTP.
Hypothesis 3.2: a lack of familiarity with auction settings
Participants' institutional information might be affected by their lack of familiarity with auction formats. We test if roundnumber (the number of bidding decisions a participant has made) has an effect on the bids by specifically testing whether βAuction, RoundNumber = 0 holds. In order to gain more insights from the data, the regression in this part involves auction bids for all of the honey products (local, USA, and international). We test this hypothesis with a Tobit model, adding a set of experimental controls. The experiment controls include three information treatments, origin–information interactions, survey variables on consumer attitude toward honey, and other socio-demographic variables.Footnote 7 As shown in Table 7 column 1, βAuction, RoundNumber is significantly different from zero with a coefficient estimate of −0.039. Besides, in a logit model examining the probability that a participant submits a zero bid, we find that a zero bid is more likely to appear as the auction progresses (as shown in column 4, Table 7). Thus, the null hypothesis that βAuction, RoundNumber = 0 is rejected. As the auction rounds progress, participants tend to adjust their behavior based on information gathered through the process.
Table 7. The effect of round number
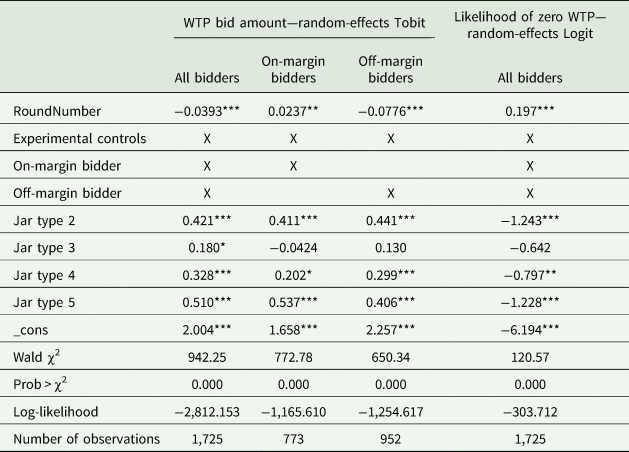
Notes: ***, **, and * represent significance at the 1 percent, 5 percent, and 10 percent levels, respectively. Estimates include subject random effects. Experimental controls include several order effects and information treatments, and details can be found in Wu et al. (Reference Wu, Fooks, Messer and Delaney2015).
The underlying reason for the change of WTP in the auctions in successive rounds is not obvious, especially since there was no feedback regarding the price and winners. Meanwhile, it is possible that some participants lost interest and stopped bidding. Thus, we considered if off-margin and on-margin bidders behaved differently. Given the size of the bids, it is reasonable to define “on-margin” bidders as those whose bids are less than $1 below the second highest bid and the rest as “off-margin” bidders:Footnote 8
-
On-margin: bid > second highest bid − $1;
-
Off-margin: bid ≤ second highest bid − $1.
Column 2 and 3 in Table 7 show Tobit regression results for on-margin and off-margin bidders, respectively, with experimental controls. The results are significant and robust to inclusions of demographic and attitude controls. In sum, bids by on-margin bidders increase $0.024 each round and bids by off-margin bidders decrease $0.078 each round. Therefore, on-margin bidders seem to show a gradually increasing pattern in their revealed WTP. Combined with the result that WTP elicited from the posted price section is higher than auctions and participants are generally more familiar with posted prices, this result adds some evidence to the DPH. With the more engaged responses, participants are gradually advancing to behavioral responses that are more systematic as the decision-maker gains additional information through familiarization and feedback. Even though the gap still exists between posted price and auction even with this gradual increase, it shows that interested participants are realizing and adjusting their bids to decrease this gap as the auction progresses. Note that even though we did 15 rounds of the auction, even by the end, the auction mechanism is still a relatively unfamiliar task. Therefore, even though the increase in bids of on-margin bidders may not explain the entire discrepancy, it could be a plausible explanation for this discrepancy. This reiterates the importance to have appropriate and sufficient training before an auction to familiarize participants with the mechanism. For off-margin bidders, the result may be of similar reason as pointed out by Knetsch et al. (Reference Knetsch, Tang and Thaler2001) and Shogren et al. (Reference Shogren, Margolis, Koo and List2001)—second price auctions may not work very well for off-margin bidders as they may lose interest if they know they cannot win. In our English auction, it is reflected as shorter waiting times, and hence, decreasing bids.Footnote 9
Hypothesis 4: marginal effects between two methods
In this part, we compare the marginal effect estimations in the two elicitation mechanisms. Since the auction bids implement a random-effects Tobit model and the posted price binary responses use a random-effects Logit model, the magnitudes of the variables are not directly comparable. However, the signs and significance levels of the attribute coefficients should be comparable. As demonstrated in Table 8, we examine the sign estimates and significance levels for the jar attributes in the posted price and auction parts. A positive sign in the coefficient would indicate a WTP premium for that attribute and a negative sign indicates the opposite. Significance levels indicate the ability to detect a preference for attributes.
Table 8. Marginal effect estimation comparison in posted price and auction
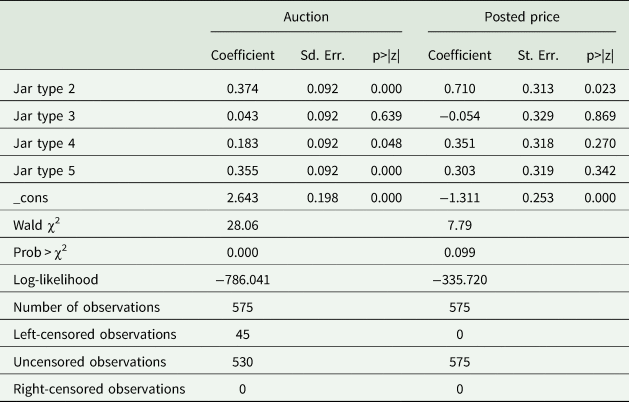
The first three columns show results for auction bids. Compared with the baseline Jar1, participants are willing to pay more for honey packaged in Jar2, Jar4, and Jar5. As shown in the last three columns for the posted price part, with the same number of observations, we can only demonstrate that the participants are significantly willing to pay more for Jar2, while the rest of the jar attributes are insignificant. However, if we focus on the sign estimates in the posted price part, the result suggests that the participants are willing to pay more for Jar4 and Jar5 than for Jar1, which is consistent with the auction. The coefficient is negative but insignificant for Jar2, which is also insignificant in the auction part. Therefore, even though we obtain less significance in the posted price part, the sign estimates mostly agree with the auction part. The above analysis suggests that posted price and auction generate similar qualitative marginal effects for attributes, but auctions are more efficient in revealing these underlying preferences.
Conclusion
Experimental auctions are a popular instrument for measuring consumer WTP for various attributes of a commodity or environmental service. A key attractive feature of auction mechanisms is that they provide point estimates of WTP. However, posted price formats are how most consumer choices are made. Inferring consumers' WTP for a posted price market from auction bids can be problematic, since consumers generally may have relatively limited experience with auctions and may not behave in a consistent manner in both mechanisms. Therefore, some attention has been paid to comparing the estimated mean WTPs using these two mechanisms. On the other hand, the comparison of other important aspects, such as the estimation of how WTP varies with certain product attributes, has not been thoroughly examined in the literature. In this research, we test the mean WTP differs in the two elicitation methods and further offer explanations of such a discrepancy using an artefactual field experiment. Moreover, we compare the signs and significance levels of marginal effects for different product characteristics.
First, in our auction, the estimates of WTP from bids are significantly less than estimates of WTP for the same product via the posted price mechanism. We conducted both within-subjects and between-subjects tests, and the results are robust. We test several potential explanations related to information and framing effects. The differences in WTP do not appear to be due to either an anchoring effect or asymmetric inconsistent preferences. The results do suggest that the reason for the difference in auctions is research participants' lack of familiarity with auctions. Second, we run regressions to test the marginal effects of different product attributes on WTP. The signs of coefficients are consistent in the auction and posted price mechanisms. Third, we find that the significance level is much higher using auctions for each confident.
Our research sheds light on which economic evaluation elicitation format, namely auctions and posted price mechanisms, is more suitable under different circumstances. We show that a WTP estimate difference does exist between the two mechanisms. Participants do demonstrate an adaption process in the auction format. Meanwhile, the posted price mechanism is more familiar with the general public and participants may focus more on the task itself. This is particularly true in a field setting where researchers usually recruit participants from busy marketplaces, where attention and time allocated to experiments are generally limited. However, we show that both methods elicit similar signs for the marginal effects of specific product attributes. Thus, using either auctions or posted price mechanisms can provide credible prediction on the marginal effects of important product characteristics. But auctions have a clear advantage over posted price in terms of statistical power, which indicates that a larger sample size is required for a posted price mechanism to reveal the preference for specific product attributes. Therefore, it is reasonable to consider using posted price when one's goal is to understand absolute WTP values and to use auctions when one is interested in relative WTP comparisons associated with different attributes.
Supplementary material
The supplementary material for this article can be found at https://doi.org/10.1017/age.2021.6.
Funding statement
This work was supported by the Northeast Center for Risk Management Education (grant no. RME-M7604495).
Competing interest
None declared.
Data availability statement
Replication materials are available in the supplementary materials section of the article.


 Open access