


Introduction
Farm to school programs have been touted as an opportunity to both support local agricultural producers and increase healthy food consumption among children and young adults. Though no formal definition exists, farm to school generally involves exposing students to local agriculture and food through new curriculum, the serving of local products in meals and snacks, or experiential activities such as farm tours, farmer visits, and school gardens. While farm to school programs have been shown to provide a multitude of benefits, a variety of both price and non-price barriers can impede implementation of these programs. Our research addresses the efficacy of two types of mechanisms that support farm to school programs: food hubs and state-level funded policies. This study provides timely guidance to both policy makers and agricultural stakeholders on how to best grow farm to school programs.
According to the United States Department of Agriculture (USDA), 10.5% of American households were categorized as food insecure in 2019 (Coleman-Jensen et al. Reference Coleman-Jensen, Rabbitt, Gregory and Singh2020), and school lunches are an important source of nutrients and calories for food insecure children (Ralston, Coleman-Jensen, and Guthrie Reference Ralston, Coleman-Jensen and Guthrie2017). For many students, including those from the 84% of food insecure households whose children qualify for free or reduced-price school lunches (Ralston, Coleman-Jensen, and Guthrie Reference Ralston, Coleman-Jensen and Guthrie2017), their healthiest meal will be provided at school (CDC 2021; Liu et al. Reference Liu, Micha, Li and Mozaffarian2021). Farm to school programs can play an important role in this process as they are associated with improved student knowledge of nutrition, an increased willingness to try new fruits and vegetables, and a potential expansion of produce consumption (Neff, Merrigan, and Wallinga Reference Neff, Merrigan and Wallinga2015; Prescott et al. Reference Prescott, Cleary, Bonanno, Costanigro, Jablonski and Long2020).
While all school meals must comply with federal nutritional guidelines, limited evidence suggests that meals incorporating local foods have increased and more varied levels of fresh vegetables (Gibson et al. Reference Gibson, Harvey, Kendra, Sullivan, Kate and Kunkel2014; Nicholson et al. Reference Nicholson, Turner, Schneider, Chriqui and Chaloupka2014), though the research on whether that translates into healthier consumption is mixed (Taylor and Johnson 2013). Studies have varied on whether farm to school programs lead to increased produce consumption (Rauzon et al. Reference Rauzon, Wang, Natalie and Crawford2010; solely increased vegetable consumption (Moss et al. Reference Moss, Smith, Null, Roth and Tragoudas2013; Jones et al. Reference Jones, Childers, Weaver and Ball2015; Kropp et al. Reference Kropp, Abarca-Orozco, Israel, Diehl, Galindo-Gonzalez, Headrick and Shelnutt2018; Hartson et al. Reference Hartson, King, O’Neal, Brown, Olajuyigbe, Elmore and Perez.2021) or have no discernible impact (IATP 2012; Ignasiak and Peterson Reference Ignasiak and Peterson2020). Several studies have suggested that the positive change in produce consumption may be reserved for those with the lowest baseline consumption levels (Smith et al. Reference Smith, Corriveau, Aaronson, Fitzgerald, Heeres, Eagle and DuRussel-Weston.2012; Bontrager Yoder et al. 2014). These differing results not surprising as a variety of distinct activities can be categorized as farm to school (Berlin et al. Reference Berlin, Norris, Kolodinsky and Nelson2013), and there is large variation in study quality and design (Taylor and Johnson 2013). Beyond produce consumption, lunches prepared with local products are associated with improvements in the nutritional quality of overall calories consumed, with shifts toward protein and whole grains and away from fats (Gibson et al. Reference Gibson, Harvey, Kendra, Sullivan, Kate and Kunkel2014), a pattern that increases with the length of the program (Bontrager Yoder and Schoeller 2014). The impact on plate waste is also mixed, as one USDA study suggested schools with farm to school programs exhibited less waste (Fox et al. Reference Fox, Gearan, Cabili, Dotter, Niland, Washburn, Paxton, Olsho, LeClair and Tran2019) while another observed local food being wasted more, though this was inversely related to the length of time of the program (Bontrager Yoder, Foecke, and Schoeller 2015).
The research on other potential benefits of farm to school programs paints a clearer picture. Students appear to have improved knowledge of nutrition, healthy behaviors, and the benefits of fruit and vegetable consumption (Rauzon et al. Reference Rauzon, Wang, Natalie and Crawford2010; Bevan, Vitale, ad Wengreen. Reference Bevan, Vitale and Wengreen2012; Moss et al. Reference Moss, Smith, Null, Roth and Tragoudas2013; Bontrager Yoder et al. 2014; Ignasiak and Peterson Reference Ignasiak and Peterson2020; Hartson et al. Reference Hartson, King, O’Neal, Brown, Olajuyigbe, Elmore and Perez.2021). More positive attitudes and willingness to try new fruits and vegetables have been reported both at school and home (Godfrey Reference Godfrey2010; Bontrager Yoder et al. 2014; Gibson et al. Reference Gibson, Harvey, Kendra, Sullivan, Kate and Kunkel2014; Izumi et al. Reference Izumi, Eckhardt, Hallman, Herro and Barberis2015; Jones et al. Reference Jones, Childers, Weaver and Ball2015; Thompson and Narciso 2017). School gardens specifically are associated with improved engagement and academic achievement (Klemmer, Waliczek, and Zajicek Reference Klemmer, Waliczek and Zajicek2005; Smith and Motsenbecker 2005; Berezowitz, Bontrager Yoder, and Schoeller 2015). On a community level, farm to school programs can positively impact the local economy (Tuck et al. Reference Tuck, Haynes, King and Pesch2010; Kane et al. Reference Kane, Kruse, Markesteyn Ratcliffe, Ananda Sobell and Tessman2011; Bauman and Thilmany McFadden 2017), lead to increased employment (Kluson, Reference Kluson2012; Pesch and Bhattacharyya Reference Nicholson, Turner, Schneider, Chriqui and Chaloupka2014; Holland et al. Reference Holland, Thompson, Godwin, Pavlovich and Stewart2015; Roche et al. Reference Roche, Becot, Kolodinsky and Conner2016; Christensen, Jablonski, and O’Hara Reference Christensen, Jablonski and O’Hara2017) and provide revenue streams for individual farmers (Izumi, Wright, and Hamm Reference Izumi, Wright and Hamm2010; Long et al. Reference Long, Jablonski, Costanigro and Frasier2021).
In recognition of these benefits, a variety of federal programs exist to support farm to school programming. The 2008 Farm Bill first allowed for a geographic preference in school food procurement to support locally grown unprocessed produce (USC 2011). While the 2004 Child Nutrition Reauthorization Act initially created a federal farm to school program, it was not until the 2010 Healthy, Hunger-Free Kids Act that a grant program was actually funded within the USDA, leading to the disbursement of $40 million in funding between 2013 and 2019 (Bobronnikov et al. Reference Bobronnikov, Boyle, Grosz, Lipton, Nutter, Velez and Yadav2021). Farm to school programs have seen tremendous growth throughout the United States, and local food procurement in schools has increased 55% between the 2011–2012 and 2013–2014 school years (USDA 2015). However, due to both price and non-price barriers, more than 50% of school districts do not currently have a farm to school program (USDA 2021). Specifically, there is a perception that locally grown food is more expensive, and procurement can require school food service directors to partner with a variety of nontraditional distributors (including purchasing directly from producers).
An important driver of the successful implementation of a farm to school program is the presence of an enthusiastic and dedicated “champion,” usually a food service director, who is willing to overcome these procurement barriers (Bagdonis, Hinrichs, and Schafft 2008; Schafft, Hinrichs, and Bloom 2010; Janssen Reference Janssen2018). While this characteristic is not readily measurable in quantitative data, the Farm to School census does ask school food authorities about their intention of beginning a farm to school program. Our study assesses the impact of two potential mechanisms that could support these individuals by addressing price and non-price barriers and facilitating local food procurement in schools. Food hubs, which the USDA defines as “a centrally located facility with a business management structure facilitating the aggregation, storage, processing, distribution, and/or marketing of locally/regionally produced food products,” can promote local food procurement by reducing the burden on schools that would otherwise need to source from multiple producers. While case studies suggest that food hubs can support farm to school programs (Roche, Conner, and Kolodinsky Reference Roche, Conner and Kolodinsky2015), this potential relationship warrants further study (Schafft, Hinrichs, and Bloom 2010). Farm to school policies, which can include grant programs or increased funding for school meals, serve to mitigate the increased costs of local food procurement. In essence, food hubs address non-price transactional barriers in the farm to school supply chain while funded policies focus on cost concerns. We will be testing whether these facilitation mechanisms impact the implementation of a farm to school program in schools across the U.S among those districts that have stated an intention of beginning a program.
The remainder of our paper proceeds as follows. We begin by reviewing the literature on farm to school programs and the corresponding role of state policies and food hubs. We then discuss our data set, cleaning process and economic model. Our analysis concerns school districts that had previously expressed an interest in initiating a farm to school program in order to identify what factors facilitated program creation in schools that want to begin a program but may face barriers to implementation. Using the 2013, 2015, and 2019 waves of the USDA’s national Farm to School Census, we find that touted facilitation mechanisms of food hubs and state policies do not impact farm to school programming. Instead, it is the largest-scale agricultural operations that have the greatest impact on program initiation, which may be at odds with the goal of using farm to school sales as a way of improving the profitability of small farms. However, this relationship may be changing over time.
Literature
School food service directors have identified a variety of benefits to local food procurement, including supporting local farmers and the economy (Gregoire and Strohbehn 2002; Starr et al. Reference Starr, Card, Benepe, Auld, Lamm, Smith and Wilken2003; Izumi, Alaimo, and Hamm Reference Izumi, Alaimo and Hamm2010; Motta and Sharma 2016), improved freshness and quality (Gregoire and Strohbehn 2002; Izumi, Alaimo, and Hamm Reference Izumi, Alaimo and Hamm2010; Motta and Sharma 2016), the ability to purchase smaller quantities (Gregoire and Strohbehn 2002), perceived food safety benefits (Gregoire and Strohbehn 2002), and the support of environmentally sustainable practices (Starr et al. Reference Starr, Card, Benepe, Auld, Lamm, Smith and Wilken2003). Food service buyers also noted that in addition to providing nutritious produce, when students interacted with farmers as they delivered produce it increased their interest in consuming these products (Izumi, Alaimo, and Hamm Reference Izumi, Alaimo and Hamm2010).
Despite these perceived benefits, schools have cited both financial and non-financial barriers to procuring local food, including seasonal availability (Gregoire and Strohbehn 2002; Low et al. Reference Low, Adalja, Beaulieu, Key, Martinez, Melton, Perez, Ralston, Stewart, Suttles, Vogel and Jablonski2015; Motta and Sharma 2016), consistency of quality and volume (Gregoire and Strohbehn 2002), a preference for partially processed produce (Motta and Sharma 2016), and a need to work with multiple vendors (Low et al. Reference Low, Adalja, Beaulieu, Key, Martinez, Melton, Perez, Ralston, Stewart, Suttles, Vogel and Jablonski2015). While local food premiums were viewed as a barrier to procurement, local food was often priced competitively with conventional produce, though at times lower or higher depending on the season and product (Izumi, Alaimo, and Hamm Reference Izumi, Alaimo and Hamm2010; Motta and Sharma 2016). In fact, school food directors stated that relationships with farmers allowed for discount purchases of excess products, but buying locally grown required additional effort and time (Izumi, Alaimo, and Hamm Reference Izumi, Alaimo and Hamm2010). Overall, these findings suggest that both price and non-price barriers must be considered when assessing the farm to institution supply chain.
Marketing mechanisms such as food hubs can help reduce barriers to local food procurement. However, participation in these Value Based Supply Chains (VSBCs) that connect local producers to institutions and customers requires strong partnerships (Dimitri and Gardner 2018) and rely on communication flow between parties (Feenstra et al. Reference Feenstra, Allen, Hardesty, Ohmart and Perez2011; Feenstra and Hardesty 2016; Dimitri and Gardner 2018), leading to a more complex supply chain structure and composition. In a case study of a Santa Barbara food hub that facilitated local food procurement for the University of California, Cleveland et al. (Reference Cleveland, Müller, Tranovich, Niki Mazaroli and Hinson2014) found that these successful partnerships led to the university procuring over 60% of its produce locally, but that it was a multiple-year effort with significant logistical challenges early on. Thus, while food hubs have the ability to overcome some of the logistical challenges of transacting directly with farmers, they may still not sufficiently replicate the ease of coordinating with traditional suppliers.
Prior research on farm to school programs has found that both school and county demographics impact their availability. Studies can generally be split into two categories: those that look at the probability of having a farm to school program and those that identify predictors of total expenditures. Variables that were positively related to the presence or continuation of a farm to school program included school size (O’Hara and Benson Reference O’Hara and Benson2017; Botkins and Roe Reference Botkins and Roe2018; Bonanno and Mendis Reference Bonanno and Mendis2021), local agricultural production (O’Hara and Benson Reference O’Hara and Benson2017), the proportion of local farms that participated in direct-marketing (Botkins and Roe Reference Botkins and Roe2018), the number of farmers’ markets (Botkins and Roe Reference Botkins and Roe2018), the percent of students that are Hispanic or Black (Botkins and Roe Reference Botkins and Roe2018), the proportion of nearby schools that already had a farm to school program (Botkins and Roe Reference Botkins and Roe2018), and being in a more urban location (Botkins and Roe Reference Botkins and Roe2018). Variables that had a negative relationship to the presence of a farm to school program included the county poverty rate (O’Hara and Benson Reference O’Hara and Benson2017), the percent of students eligible for reduced or free school lunch (O’Hara and Benson Reference O’Hara and Benson2017), local milk prices (Botkins and Roe Reference Botkins and Roe2018), and student expenditures (Bonanno and Mendis Reference Bonanno and Mendis2021). There were slightly different results when it came to local food expenditures as positive factors included the county population (O’Hara and Benson Reference O’Hara and Benson2017), school size (O’Hara and Benson Reference O’Hara and Benson2017), the percent of students eligible for reduced or free school lunch (Christensen et al. Reference Christensen, Jablonski, Stephens and Joshi2017; O’Hara and Benson Reference O’Hara and Benson2017), and the breadth of a school’s definition of local, while the county poverty rate still had a negative impact (O’Hara and Benson Reference O’Hara and Benson2017). Thus, while more impoverished schools may be less likely to begin a farm to school program, those that do are able to spend more funds on local procurement. Ralston, Coleman-Jensen, and Guthrie (Reference Ralston, Coleman-Jensen and Guthrie2017) found that school districts were more likely to serve local food daily if they were larger, or in more educated or urban counties, and less likely if they had low levels of fruit and vegetable acreage nearby or had high student expenditures. Our analysis includes these relevant school and county-level variables.
Prior studies have also looked at the relationship between facilitation mechanisms and farm to school programs. Though federal programs provide funding on a national level, states differ in their creation and implementation of policies. Schools located in states with farm to school legislation were more likely to have farm to school programs (Schneider et al. Reference Schneider, Chriqui, Nicholson, Turner, Gourdet and Chaloupka2012; Nicholson et al. Reference Nicholson, Turner, Schneider, Chriqui and Chaloupka2014; McCarthy, Steiner, and Houser Reference McCarthy, Steiner and Houser2017), as were those in states with a greater number of policies (Ralston, Coleman-Jensen, and Guthrie Reference Ralston, Coleman-Jensen and Guthrie2017). In Vermont, schools receiving state grant funding were more likely to both have a farm to school program and implement local procurement (Roche, Conner, and Kolodinsky Reference Roche, Conner and Kolodinsky2015). However, Bonanno and Mendis (Reference Bonanno and Mendis2021) found little relationship between farm to school policies and continuation of a farm to school program, though coordinators had a positive impact. While 41 states have enacted a farm to school policy or resolution, only 25 of them include a funded position or program (NFSN and CAFS 2019). Our study will differentiate between funded and non-funded policies when assessing their efficacy. Though nontraditional supply mechanisms such as food hubs may have a positive impact on the prevalence of farm to school programs (Botkins and Roe Reference Botkins and Roe2018), schools that relied on traditional distributors for local procurement were able to purchase more local foods (Christenson et al. 2017; Fitzsimmons and O’Hara Reference Fitzsimmons and O’Hara2019; Plakias, Klaiber, and Roe Reference Plakias, Klaiber and Roe2020). However, food hubs can supply large distributors in addition to schools directly (Colasanti et al. Reference Colasanti, Hardy, Farbman, Pirog, Fisk and Hamm2018).
Data processing and analysis
To investigate school districts’ probability of following through on stated intentions to begin a farm to school program, we developed a logistic model. The log odds of the binary participation decision are estimated as:
 $$\ln {p \over {1 - p}} = {\beta _0} + {\beta _1}*FoodHubs + {\beta _2}*Policy + {\beta _S}{X^S} + {\beta _L}{X^L} + {\varphi ^F} + \varepsilon $$
where p is the probability that the dependent variable equals 1. Our dependent variable, Follow Through, denotes whether a school that stated an intention to begin a farm to school program in the census actually did so. Our primary variables of interest are the facilitation mechanisms of food hubs and farm to school policies. X
S
is a vector of school-level variables, including size and food expenditures. X
C
is a vector of county-level locational variables such as agricultural characteristics and household demographics. ${\varphi ^F}$
represents region-level fixed effects, and the residual error is clustered by state.
${\varphi ^F}$
represents region-level fixed effects, and the residual error is clustered by state.
Our farm to school data comes from USDA’s Farm to School Census, which asked school food service directors about their farm to school activities. There have been three waves of the census. The first, in 2013, asked about the 2011–2012 school year, while the second, in 2015, asked for data from 2013–2014, and the most recent, in 2019, covers 2018–2019. We primarily use results from the 2015 wave, which also includes matched data from the Common Core of Data for the school year 2013–2014, and the 2019 wave. In the survey school districts were asked whether they conducted farm to school activities in the prior year, began activities in the current year, planned to start activities in the future, or did not intend to begin farm to school programming. For 2015, Follow Through represents whether school districts who replied that they “plan to start farm to school activities in the future” in the 2013 F2S survey had created a farm to school program at the time of the 2015 survey. Similarly, in 2019 a school district is assigned Follow Through equal to 1 if the school district had stated an intention to begin activities in the 2015 survey and had “followed through” on this by the 2019 survey. As a sub-analysis, we denote whether a school has begun local food procurement if they use local products in their breakfast, lunch, or snack programs.
Our main variables of interest are the availability of funded farm to school policies and food hubs. The specifics of farm to school policies for each state come from the State Farm to School Policy Handbook, which was created by the National Farm to School Network and Vermont Law School and funded by the USDA (NFSN and CAFS 2019). This guide characterizes policies based on whether they establish a farm to school coordinator, appropriate state funding, create a grant program, develop a reimbursement or incentive system, establish a statewide farm to school program, encourage local preference in procurement, support food or agricultural educational activities, create a state directory of interested parties, develop a pilot program or working group, create a promotional program, or introduce a resolution. We focus on policies that provide schools with funding and define a state as having a funded farm to school policy (Funded Policy) if it had either an appropriation, grant, or reimbursement policy. Appropriation policies allocate money to farm to school programs, grant programs authorize funds specifically for that purpose, and reimbursement policies provide schools with additional per-meal funds for including local foods in school meals. For the 2015 analyses, we only included policies launched before 2014, as only these would have impacted school decisions by the 2015 F2S Census, while for 2019 we added policies implemented prior to 2017. Data on food hubs come from the USDA’s Agricultural Marketing Service. As not all food hubs may advertise through this resource, we augmented this list by performing manual Google searches of the terms food hub+state for all states and D.C. For 2015, our food hub variable (Food Hubs) indicates solely how many food hubs existed in a state before 2015, while for 2019 it is the number of food hubs that were established before 2019.
To control for school resources, we included total school system expenditures (Total Expense), total expenditures on food service (Food Expense), and food service revenue from the federal government (Federal Food Revenue). As these variables were only available in the 2013 data set, we matched the 2013 and 2015 Farm to School census data, dropping any observations with missing district names or that were not surveyed in 2013. Schools were additionally characterized based on the number of students (Size) and the percentage of students eligible for free or reduced-price lunch (Perc Low Income) using the data from the 2013 census.
Each school district was then assigned the agricultural and demographic variables of the county in which it resides. The agricultural environment of each school was characterized by the percentage of farms that market directly to consumers (Percent Direct-Marketing Farms), total vegetable sales (Vegetable Income), the proportion of land dedicated to farming (Percent Farmland), and operator demographics (Percentage of Operators that are Female/Asian/Black/Hispanic). Total vegetable sales and farm acreage represent a proxy for the amount of available agricultural products, with vegetable income chosen as produce is the most commonly locally procured product (Bobronnikov et al. Reference Bobronnikov, Boyle, Grosz, Lipton, Nutter, Velez and Yadav2021). We control for direct-marketing farms as these types of enterprises are often encouraged to pursue intermediated channels and thus potentially represent the most relevant supply partners. The number of operators could either represent an increase in available suppliers or an increase in transaction costs; ex-ante, the sign on this variable is unknown. As smaller farms are more likely to participate in direct channels, we control for the impact of farm scale by differentiating operators based on the total sales of their agricultural enterprises, creating seven categories using the USDA Farm and Land in Farms 2019 Summary (USDA 2020). Finally, we control for the demographic characteristics of counties, including poverty rate (Poverty Rate), race and ethnicity (Percent Black/Asian/Hispanic), percentage of young people (Percent Population Under 18), and the urbanization of the county (Metro), which are taken from the USDA’s Food Environment Atlas. All variables are assessed at the county level. We use region fixed effects as prior research has demonstrated regional variation in farm to school policy implementation (Lyson Reference Lyson2016; Ralston, Coleman-Jensen, and Guthrie Reference Ralston, Coleman-Jensen and Guthrie2017), applications for federal farm to school grants (USDA 2016), and overall farm to school programming (Lyson Reference Lyson2016). However, there may be subregional state-level variation (Lyson Reference Lyson2016), and thus, we also run a specification with state-level fixed effects. Our final data set included 562 districts in 2015 and 510 in 2019.
Results
Both the 2015 and 2019 surveys asked SFA to list their largest barriers to participating in farm to school programs. In Table 1, we include the ten with the most important responses, leading to fourteen across the two waves. Question design stayed fairly consistent, though there were a few barriers addressed in one survey but not the other. However, in 2015 both those that did and did not have farm to table programs were asked to list their barriers, while in 2019 the questions were only targeted to those respondents that currently had a program. In line with prior literature, both price and non-price barriers are highly rated and primarily revolve around coordination, quality/quantity, and price. The top barrier, which is inherent to a local food production system, is the seasonality of product availability. However, the remaining barriers are primarily those that could be addressed by either food hubs (highlighted in pink) or funded policies (colored green). For instance, meal reimbursement policies target higher food prices while grants can be used to fund equipment purchases or staff training. Coordination issues, such as identifying new growers, or small farms lacking needed quality, quantity, variety, and delivery, are the types of problems addressed by aggregators such as food hubs. Similarly, while traditional vendors may not offer or identify local products, food hubs specialize in this area. The remaining barriers, a lack of staff time for preparation, and availability of processed local food, both represent the practical need for precut food items. While not inherent to a traditional food aggregator, food hubs are increasingly including additional services such as community kitchens to allow for processing before sale.
Table 1. Stated barriers to local food procurement

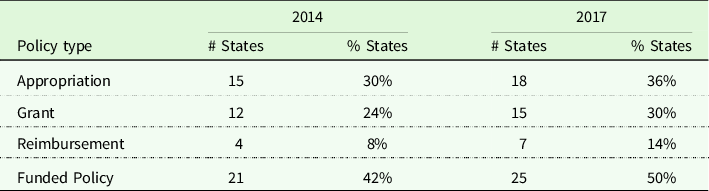
Using data from the USDA State Farm to School Policy Handbook (NFSN and CAFS 2019), Table 2 illustrates the distribution of funded farm to school policies in the United States in 2014 and 2017. Passage of policies of each type has grown over time, with the total rate of states with a funded policy increasing from 42% in 2014 to 50% in 2017. The most common type are appropriation policies, which direct state funds to farm to school programs, as in Massachusetts’ H.4001 that allocated money to promote buy local programs. This is followed by grant programs, an example of which is Vermont’s H. 456 that provided grants to schools for purposes such as purchasing kitchen equipment or providing professional development opportunities to teachers. The least common are meal reimbursement policies, which tend to directly incentivize local food procurement by addressing product pricing concerns. For all lunch programs, schools are reimbursed on a per-meal basis. Policies such as D.C.’s L.B. 564 then reimburse schools an additional five cents per-meal for each lunch that includes locally grown products. Our independent variable of interest is an indicator for whether a state has passed at least one funded policy, regardless of type. However, in the appendix we disaggregate our policy indicator variable for further analysis.
Table 2. Funded farm to school policies
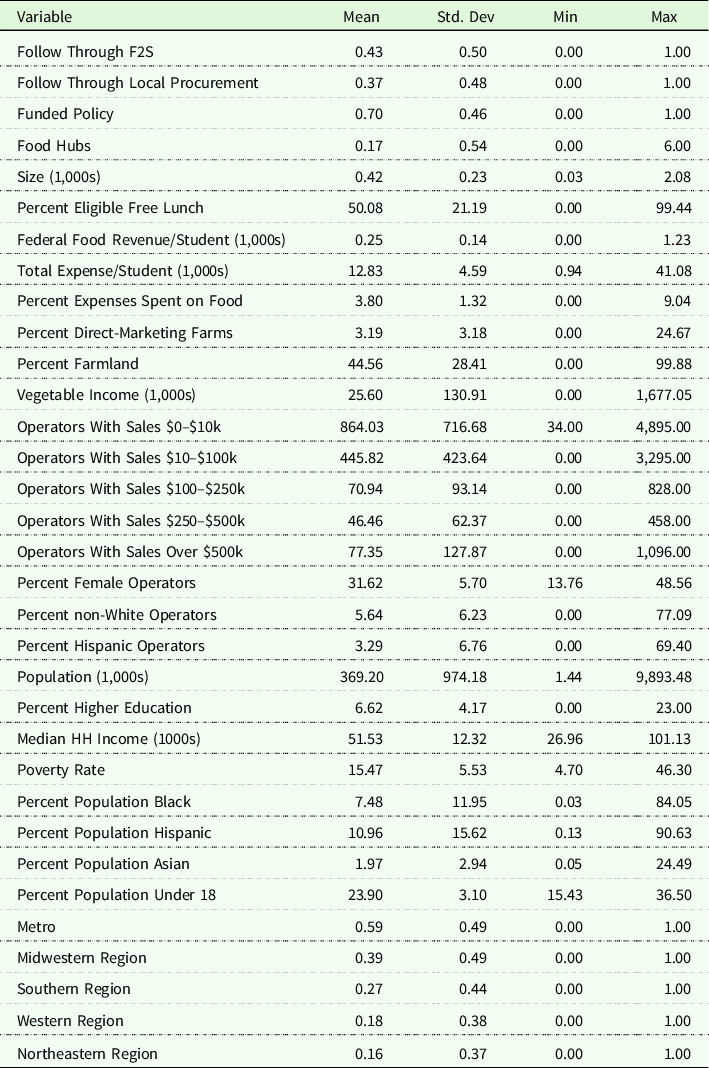
Descriptive statistics for the 2015 data can be found in Table 3. Our dependent variable is Follow Through F2S, which represents whether a school district that stated an intention to begin a farm to school program in the 2013 survey had started one as of the 2015 survey. Among the 562 included school districts, 43% have a farm to school program and 37% began incorporating local food into school meals. In terms of our main facilitation variables of interest, 70% of school districts are located in states with funded farm to school policies and the average number of food hubs in each county is 0.17. The average school district spends $12,830 per student, 3.8% of which is used for food, and has a school size of 420 students. The average county has 44.56% of land dedicated to farming, with $25,600 in vegetable sales. Slightly more than 30% of operators are female, less than 6% are non-White, and 3.29% are Hispanic. The mode operation scale is less than $10,000, though there is large variation in these size variables, and 3% of all farms practice direct-marketing. In terms of county demographics, 6.6% of the population have a bachelor’s degree or higher, median household income is slightly higher than $51,500, the overall poverty rate is 15%, and 59% of the counties are categorized as metro/urban. Nearly 40% of respondents come from the Midwest, 27% from the South, 18% from the West, and 16% from the Northeast.
Table 3. Summary statistics of 2015 survey data
We now turn to our primary analysis, which is assessing what impacts a SFA’s ability to follow through on its intention to begin a farm to school program. Our results for school districts that stated an intention to conduct a farm to school program can be found in Table 4, where we report both the regression coefficients and the robust standard errors in parentheses. Neither food hubs nor funded policies are significant factors in beginning a farm to school program. In line with prior research, the positive impact of the number of students decreases with school size, though the results are not significant. Schools that received additional federal funding per student are more likely to begin a farm to school program, while those that spend more per student, and spend a higher proportion on food, are less likely. While the number of operators with smaller farming operations has either a negative or no impact, mid-sized and the largest operations have a significantly positive impact. Turning to regional fixed effects, we find that schools in the West are less likely to follow through on their intentions than those in the Northeast.
Table 4. Logit regression for school districts following through in 2015 survey-dependent variable: follow through F2S
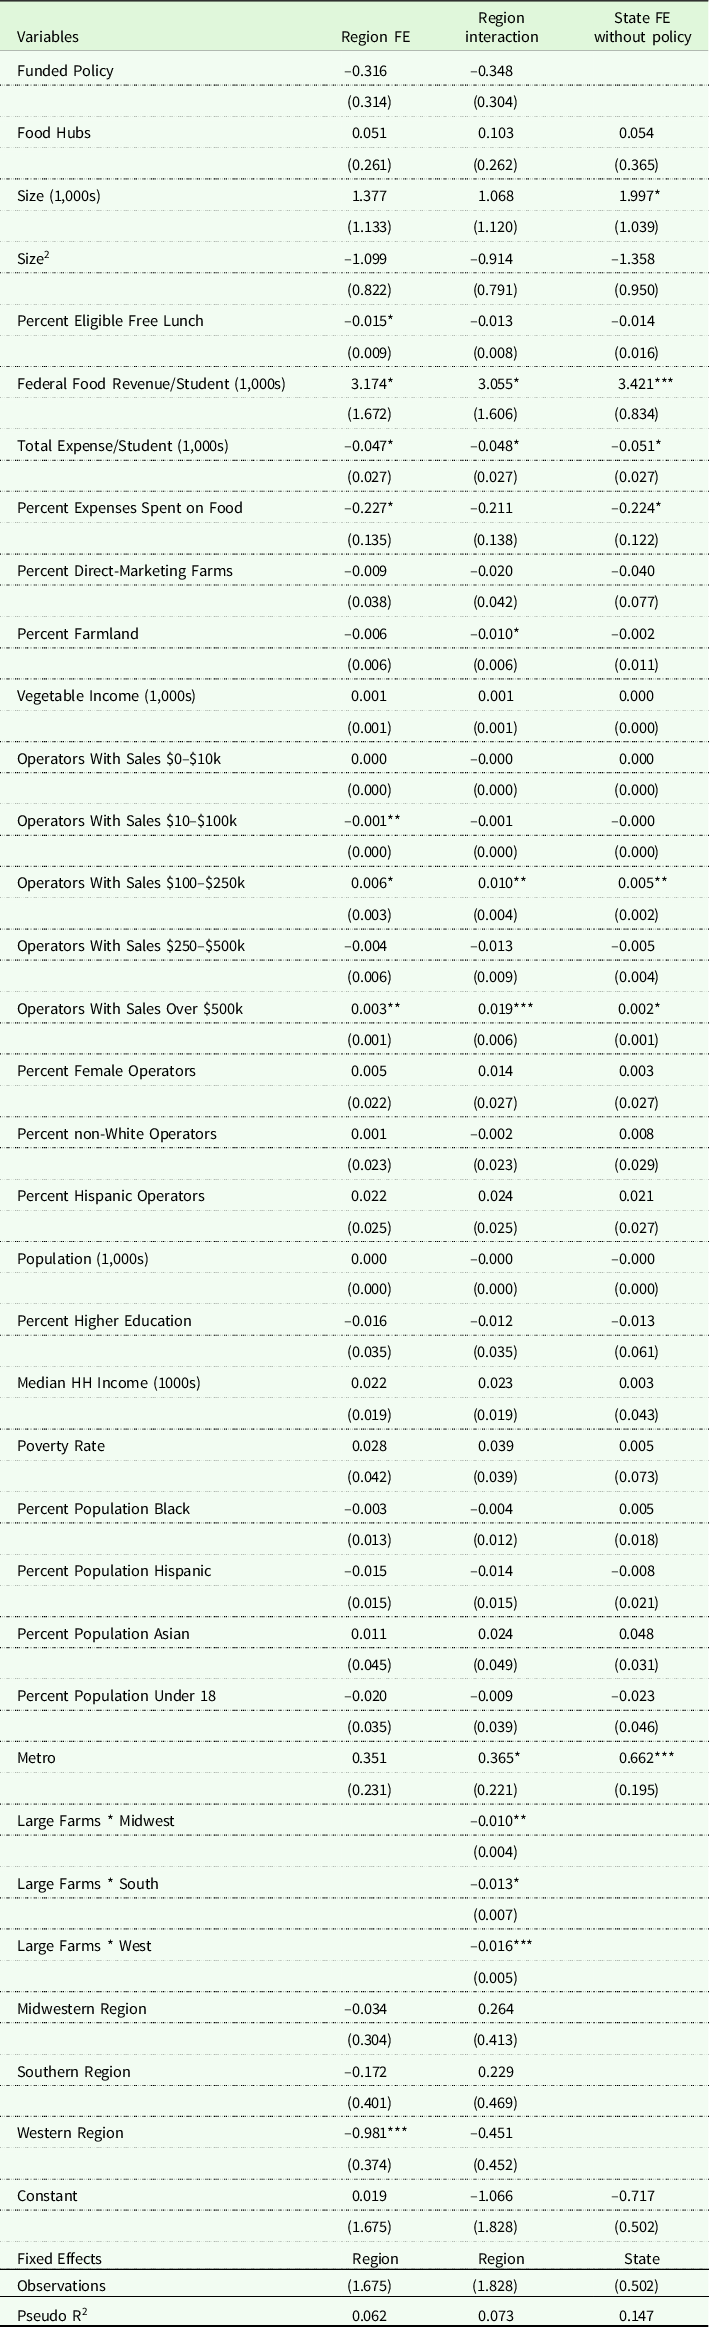
*, **, *** Denote two-tailed significance at the 1%, 5%, and 10% levels, respectively.
As the mean number of large farms per county varies so widely between regions, ranging from 36 in the Northeast to 123 in the West, in our second model we interact these variables to determine if the importance of large farms differs regionally. What we find is that relative to the Northeast, this impact is smaller in all other regions. Thus, despite the prevalence of smaller operations in the Northeast, it is there that the largest farms are most important for facilitation of farm to school programming. This could also represent that in other regions larger operations are more likely to be growing non-produce commodities. Interestingly, in this model the percentage of land dedicated to farming holds a negative relationship, even after controlling for vegetable income and urban location, which now has a positive impact.
Though the impact of funded policies is insignificant, its negative sign is surprising. However, given that our funded policy indicator variable is on a state level, it could be that this finding represents a state-based unobservable that is not constant within regions, such as the importance taxpayers place on education or providing nutritional lunches. As such, in our third model we include state fixed effects, which requires us to remove our policy variable. In this iteration, we find generally similar results. Larger schools are more likely to follow through on implementing farm to school, again with diminishing returns to size. SFAs that spend more money per student, especially on food, are less likely to participate in farm to school programming, though increased federal funding has the opposite effect. The largest farms still have a positive impact, as do medium-sized farms. Schools located in urban areas are more likely to follow through.
The types of activities that can be considered farm to school are varied, including farm field trips, incorporating educational material into the classroom, and running school gardens. As local food procurement is the activity most likely to have economic impacts for farmers and the economy, in Table 5 we assess solely the decision to begin serving local products in school meals. The results are similar to our general model. Both funded policies and food hubs remain insignificant. Again, school size has diminishing returns and federal funding has a positive impact, though there is no corresponding negative impact for school spending. However, we now see that for procurement specifically, there appears to be a negative relationship with the percent of students that are eligible for free or reduced-price school lunches. The percent of acreage dedicated to agriculture still has a negative impact only when using region and farm size interactions, and now solely, the largest sized farms impact a school’s ability to procure local food products.
Table 5. Logit regression for school districts following through in 2015 survey-dependent variable: follow through local procurement
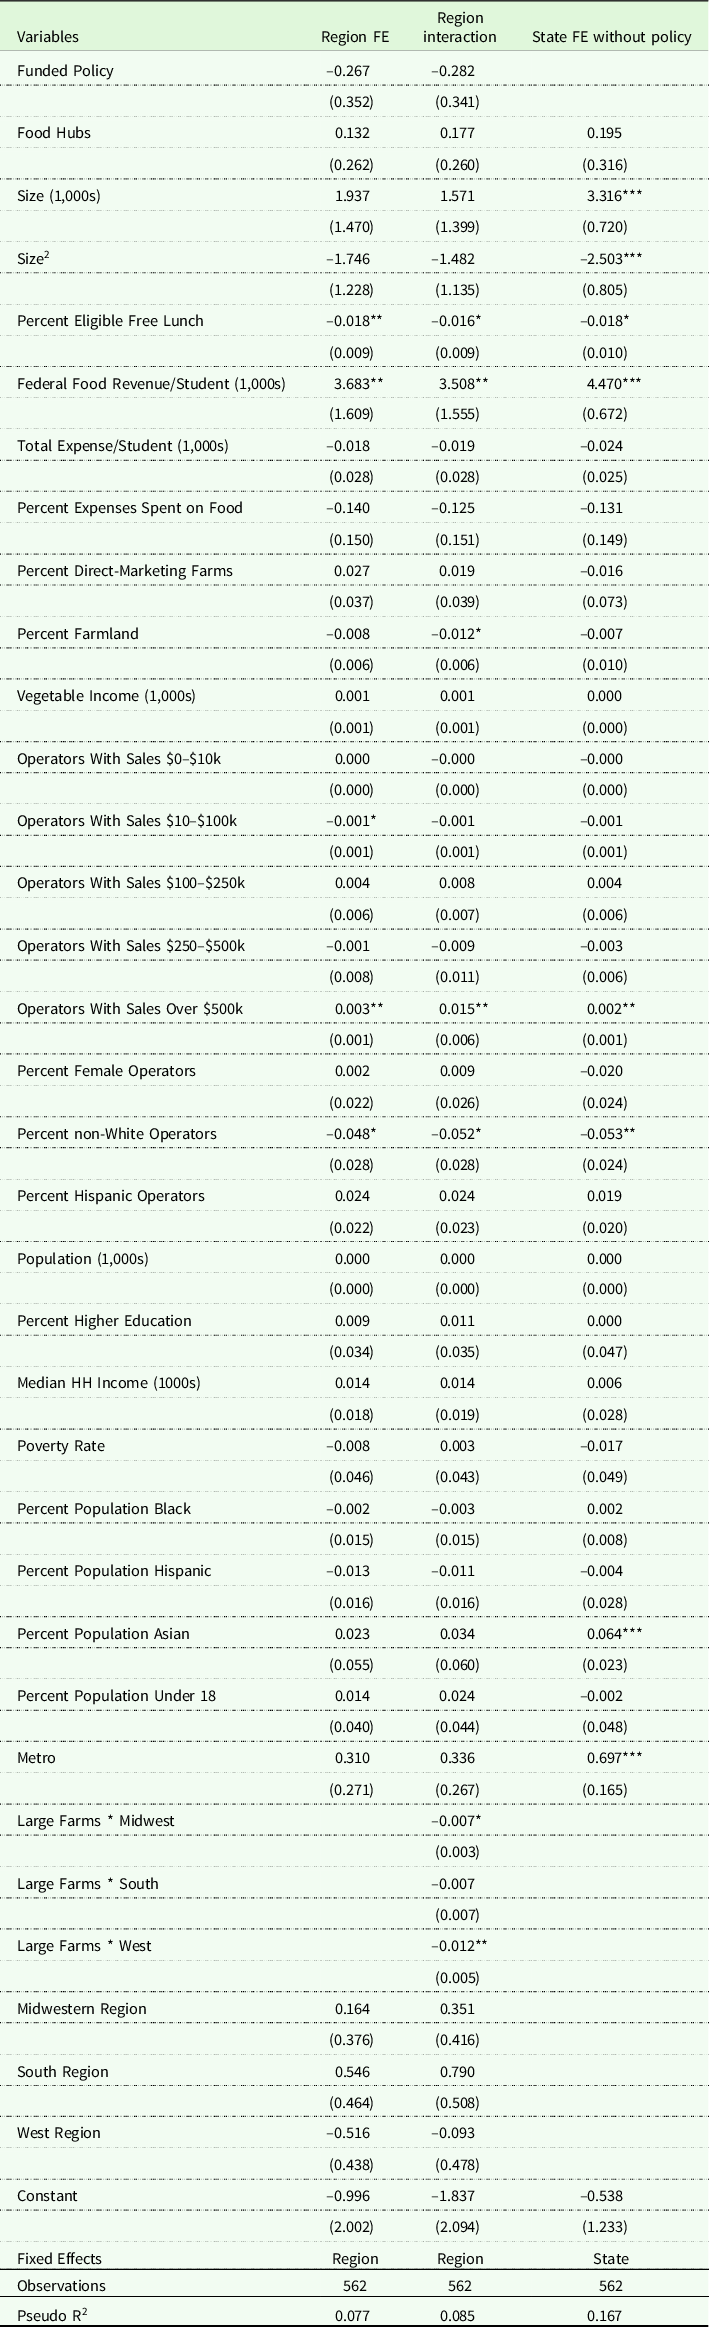
*, **, *** Denote two-tailed significance at the 1%, 5%, and 10% levels, respectively.
However, operator race and ethnicity are also significant, with a higher rate of non-White operators having a negative impact. While initially surprising as value-based supply chains have been proposed as a mechanism for underrepresented producers to overcome traditional barriers (Cooper Reference Cooper2018), there have been anecdotal concerns that these farmers have reduced access to intermediated channels, including the large distributors preferred by schools (Gingerella Reference Gingerella2021). We also find fewer regional differences for local food procurement compared to the factors that impact a farm to school program generally, though larger farms still play less of a role in the Midwest and West. Our state fixed effects model again mirrors the general model, though still with the negative relationship for the percentage of producers that are non-White. Interestingly, school districts are more likely to follow through on local food procurement if they are located in an area with a greater percentage of Asian residents.
Using the newly available wave of the Farm to School census, we replicate our analysis for schools that stated an intention to begin a farm to school program in 2015. As the questions were slightly different, we no longer know the exact number of students in the SFA or the percent of students that qualify for free or reduced lunch. Instead, each school was assigned a quartile for both school size and free/reduced lunch eligibility. Summary statistics can be found in Table 6. Follow through rates are much higher for these districts, as 83% have started a farm to school program since their stated intention in 2015, and 70% have begun to procure local food products. The average number of food hubs has increased from .17 to .28, and nearly 80% of school districts are located in a state with a funded policy. The majority of schools are either small or medium, though they are distributed fairly uniformly in terms of free/reduced-price eligibility, and thus student poverty. Agricultural values are generally similar to those in the 2015 analysis. This is unsurprising as the same Nass data are used in both, but it also underlies the similarly in the agricultural environment of responding school districts. However, the average county has a larger population and median income, slightly higher Hispanic population, and lower Asian population. Over 70% of districts are located in an urban county, and they are fairly uniformly distributed across regions.
Table 6. Summary statistics of 2015 survey data

Our regression results are located in Table 7. We find that larger schools are more likely to be able to follow through on program implementation, and presumably, there are still decreasing returns to size, though we cannot assess that factor. Similarly, we can no longer measure the impact of school funding. Unlike in 2015, total vegetable income has a negative impact. Conversely, smaller-sized farms now have a positive impact, suggesting newly created farm to school programs may have a different relationship to local agriculture. However, food hubs are still not a positive or significant factor, despite their potential to facilitate procurement from smaller farms. Farmer demographics are again significant, with a negative relationship with the percentage of operators that are female. In terms of the local environment, areas with a higher Hispanic population are more likely to follow through on their intention of beginning a program. Regionally, Southern states are less likely to implement farm to school relative to the Northeast. When using state-level fixed effects, which may be a more accurate representation of variation between areas but does not allow us to measure the impact of funded policies, we find that large farms have a significant impact, similar to the 2015 data. Districts located in urban counties, and those with a higher percentage of Black or Hispanic residents, are more likely to follow through on their proposed intention.
Table 7. Logit regression for school districts following through in 2019 survey-dependent variable: follow through F2S
*, **, *** Denote two-tailed significance at the 1%, 5%, and 10% levels, respectively.
Turning to Table 8, we measure the predictors of specifically beginning local procurement. School size is again positive, while total vegetable income is negative. The only positive association with farm size is now for the smallest farms, and there is still a negative relationship with the percentage of operators that are female. Unlike all prior analyses, median household income now has a negative impact, suggesting new priorities for where local food procurement is occurring. SFAs in urban areas are more likely to follow through on beginning local procurement and those in both the Midwest and the South are less likely to begin procuring local food relative to the Northeast. In the state fixed effects model, we find that the only relevant agricultural factors are a negative impact of both total vegetable income and the percent of farmers that are female. Median household income is still negative, as is total population, though it appears to have zero economic impact. Districts located in urban areas are more likely to begin serving local products in school meals.
Table 8. Logit regression for school districts following through in 2019 survey-dependent variable: follow through local procurement

*, **, *** Denote two-tailed significance at the 1%, 5%, and 10% levels, respectively.
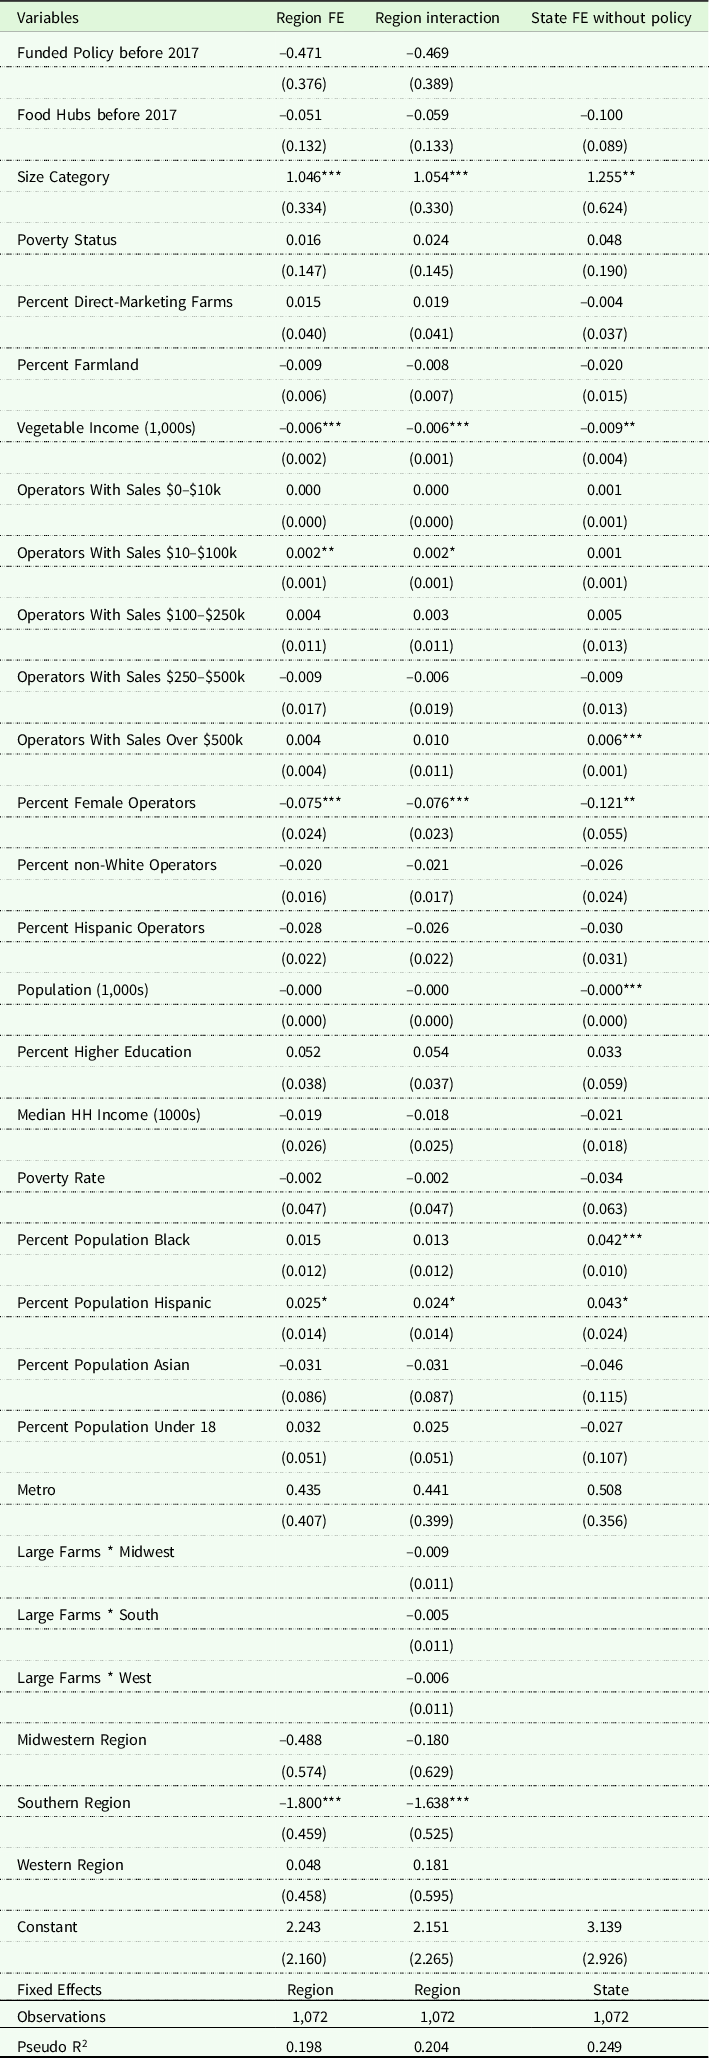
Finally, we run a combined analysis of both the 2015 and 2019 data in Tables 9 and 10. As in the separate analyses, funded state policies and food hubs have no discernible impact, while larger schools are significantly more likely to be able to follow through on their stated intention of beginning a farm to school program. Having a greater number of large farms in the area is a consistently positive factor, as is being located in an urban area. Regionally, the South and West are less likely to follow through, while larger farms play less of a role in the Midwest and South, relative to the Northeast. When using state fixed effects, we additionally find a negative impact on the proportion of female farmers and a positive one for the percentage of residents that are Black, as well as more variation in the farm size variables. However, the variable with the largest impact appears to be the data collection year. Specifically, schools that stated an intention to begin a program in 2015 are significantly more likely to have followed through than those in 2013. Starting a farm to school program may have become easier over time, potentially due to increased community interest and support, or other facilitation mechanisms that are not represented in the data.
Table 9. Logit regression for combined data set-dependent variable: follow through F2S
*, **, *** Denote two-tailed significance at the 1%, 5%, and 10% levels, respectively.
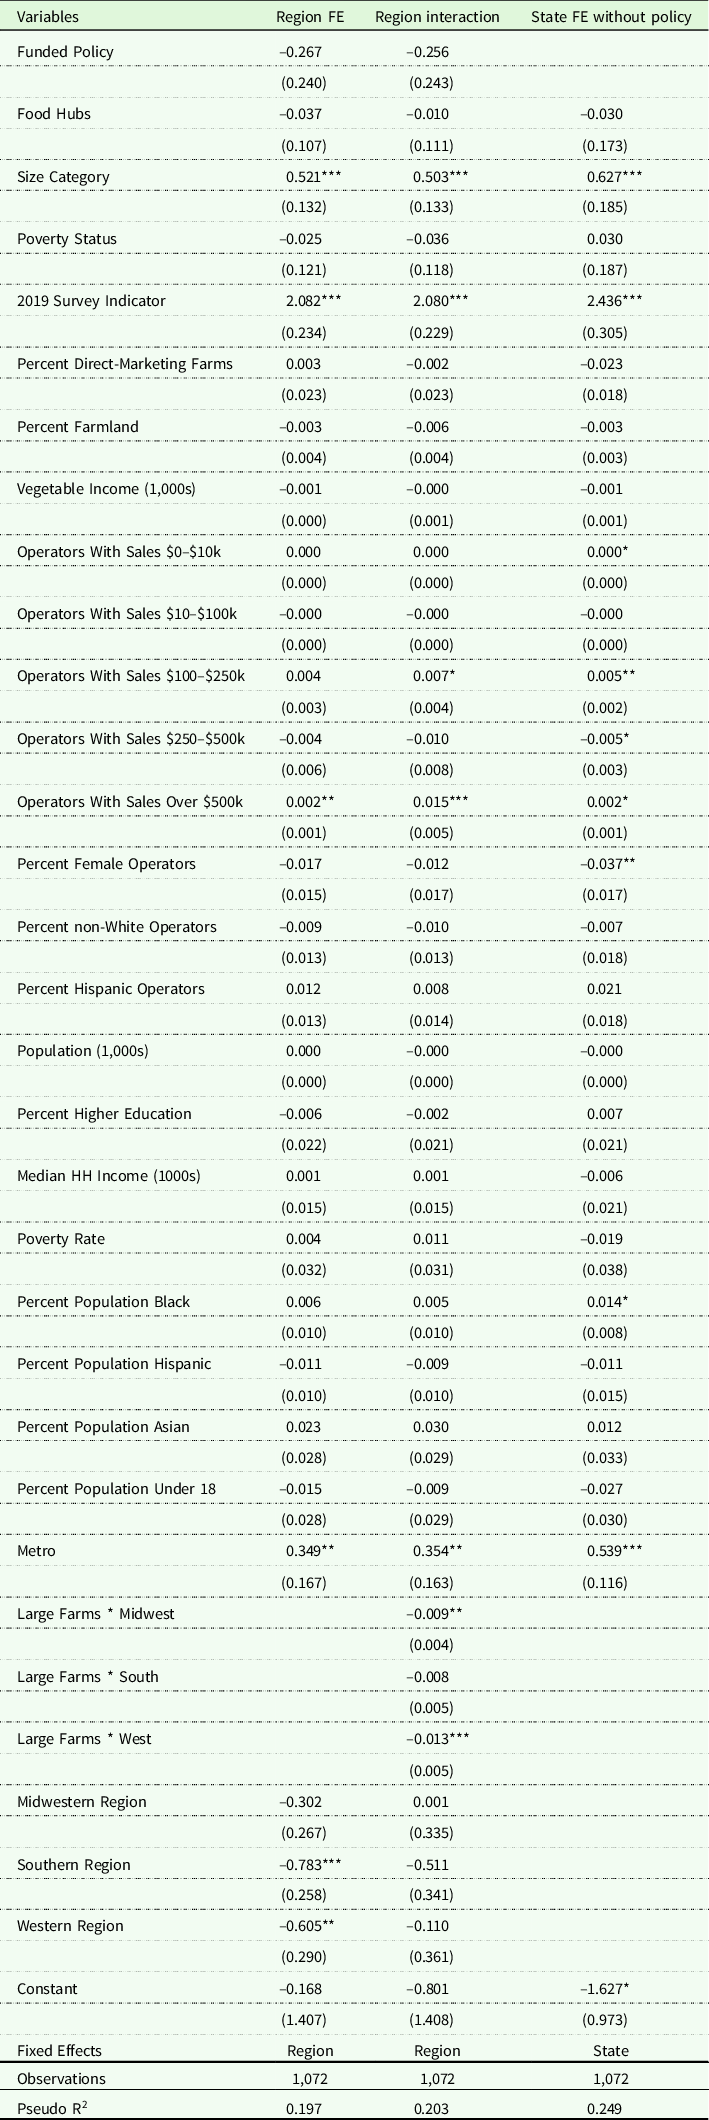
Table 10. Logit regression for combined data set-dependent variable: follow through local procurement

*, **, *** Denote two-tailed significance at the 1%, 5%, and 10% levels, respectively.
The combined analysis for local food procurement is in Table 10. While food hubs continue to be insignificant, we do find a negative impact of funded policies in our model with regional fixed effects. Across all three models, larger schools and those that considered beginning a program later are more likely to follow through. Vegetable income has a negative impact, while being located in a more urban area has a positive impact. While large farms have a positive impact in all three models, it is only significant with regional fixed effects. County demographics play a more important role in the state fixed effects model as schools in more educated areas with lower poverty rates are less likely to follow through.
The most surprising outcome of these analyses has been the insignificant, and occasionally negative, impact of funded farm to school policies. However, the 2019 wave of the census is the first to ask schools how they fund their farm to school programs, and the results in Table 11 are enlightening. Only 7% of respondents used state grant funding, despite the fact that these programs existed in 30% of states. While 16% incorporated school district funding, this is how all school meals are funded, so it is impossible to tease out how much of this is due to specific farm to school reimbursement policies. Thus, there appears to be low take-up of funded policies, which is in line with suggestions that school districts are not able to capitalize on state-level incentives (Roche, Conner, and Kolodinsky Reference Roche, Conner and Kolodinsky2015; Bonanno and Mendis Reference Bonanno and Mendis2021). In the Appendix, we disaggregate state policies to further explore this relationship, though we generally find that policies of all type are insignificant.
Table 11. Funding methods used

Conclusion
This paper aimed to improve our understanding of the role of facilitation mechanisms in farm to school implementation in the United States. Using data from the three waves of the Farm to School census, we found that neither food hubs nor state-level funded policies increased the probability of a school following through on an intention to begin a farm to school program. However, larger schools, and those with higher federal food revenues, were more likely to be able to follow through. This could represent the disparate impact of indirect and direct funding accessibility. As schools that serve more meals see increased economies of scale, and thus decreased per-meal costs, this could be driving the positive impact of school size. Similarly, increased federal food funding could also imply lower net meal costs. Thus, it may be that schools with lower meal costs as part of their daily operation are able to afford local food; this is bolstered by the negative impact of the percent of school funds spent on food. Conversely, funded policies may not have an impact because they require additional steps for a district to be able to take advantage of them, and most schools are not able to capitalize on that opportunity.
On the supply side, food hubs have been touted as a mechanism to improve small farm access to institutional channels by supplying marketing and aggregation functions. However, they appear to have no impact on a school’s ability to begin a farm to school program. Indeed, farm to school programs occur most often in areas that have larger-scale operations, rather than smaller farms. Thus, the expectation that farm to school programs could provide a new marketing avenue for small, direct-marketing farms may be unfounded. However, for the 2019 respondents it appears as though the smallest operations have the most impact, suggesting that over time there may be a movement toward supporting a wider array of farms. From an equity perspective, underrepresented producers seem less likely to play a role in farm to school sales, with a negative impact for non-White operators in 2015 and female farmers in 2019. Further research is needed to understand the dynamics present for different types of farming operations.
There are also significant regional differences on a district’s ability to follow through on an intention of beginning a farm to school program, though these differed over time. Despite Southern districts’ fairly similar representation across both waves (27% in 2015 and 22% in 2019), Southern schools were significantly less likely to follow through in 2019. However, looking at the combined data this appears to be more relevant for farm to school programming in general rather than local food procurement specifically. Urbanization also matters as districts located in metro counties were much more likely to follow through on their stated intention. In 2015, the impact of large farms was lower in both the Midwest and West, relative to the Northeast, though this difference had disappeared by 2019. While controlling for regions allows us to account for differences in the agricultural environment, there appear to be within region differences between states. Specifically, when including state fixed effects we find that county-level demographics, such as the poverty rate, educational attainment, and median household income, play a significant role.
In this study, we assessed the factors that aid districts in implementing farm to school programs, including local food procurement. Given the important role of dedicated personnel in farm to school (Bagdonis, Hinrichs, and Schafft 2008; Schaftt, Hinrichs, and Bloom 2010; Janssen Reference Janssen2018), we focused specifically on school districts that had stated an intention to implement programming. Touted facilitation mechanisms, specifically food hubs and state policies, do not appear to aid in this process. For funded policies, this could be due to a low take-up by schools, and further research is needed to understand how to better support schools in taking advantage of these opportunities. In terms of food hubs, if these enterprises are going to play a role in farm to school procurement, either by selling directly to schools or to larger distributors, changes may be required to their operational structure. However, it could be that connecting farms directly to distributors or schools is more efficient. This finally brings us to the question of equity, and the types of farms that are able to participate farm to school channels. If food hubs are intended to facilitate this relationship, that does not appear to currently be occurring. However, the difference in the impact of farm size between the 2015 and 2019 censuses suggests changes in the interaction between the local agricultural environment and school buyers, and a potential for increased inclusivity. Understanding these distinct relationships should be a focus of further studies.
Author contributions
The authors confirm contribution to the paper as follows: study conception and design: Cristina Connolly; data collection: Ce Wen; analysis and interpretation of results: Ce Wen, Cristina Connolly; draft manuscript preparation: Ce Wen, Cristina Connolly. All authors reviewed the results and approved the final version of the manuscript.
Conflicts of interest
None.


 Open access