


Perishable artifacts often present unique problems for archaeologists, analysts, and heritage specialists alike, from in situ documentation to recovery, analysis, curation, and subsequent dissemination to researchers, stakeholder communities, and the wider public. For instance, the fragility of many perishable artifacts remains an issue of critical concern throughout the chaîne opératoire of recovery through dissemination. It poses a particular challenge in furthering access to those objects that often require specialized environmental controls for long-term curation. The site of Cache Cave, located in California—containing a remarkably extensive assemblage of perishable materials cached within a complex cave/rock shelter system—has presented challenges in all these aspects of dealing with perishable finds. We aimed to establish methods that usefully enable the creation of a visual database of perishable artifacts that can include initial discovery, postexcavation analysis, and online dissemination. This article details our findings on the utility and limitations of integrating visualization and computational techniques, along with online dissemination, in this case study from Cache Cave. It evaluates 2-D and 3-D visualizations and computational tools based on their efficiency in recording basketry technology features and documenting the state of preservation of baskets; we also explored their functionality for the integration of diverse records and their ease of use for online dissemination of research outputs.
ADVANCES IN VISUALIZATION AND ONLINE SCHOLARSHIP
Scholars have highlighted both the benefits of sharing information to enhance scholarship and learning and the association of information dissemination with democratization, human rights, equality, and justice (Veletsianos and Kimmons Reference Veletsianos and Kimmons2012). In the field of cultural heritage, major museums and organizations have embraced the open-access movement, as well as European and international initiatives such as Europeana and the ARIADNE portal. The former is a large-scale search engine that provides a single access point for digitized heterogeneous cultural heritage material from various European libraries, archives, museums, and galleries (Petras et al. Reference Petras, Hill, Stiller and Gäde2017). The ARIADNE portal delivers digital services, including a variety of visual media, to the archaeological community (Ponchio et al. Reference Ponchio, Potenziani, Dellepiane, Callieri, Scopigno, Campana, Scopigno, Carpentiero and Cirillo2016). In archaeology, the concept of openness, in the sense of open-source software and open access to data and publications, has initiated discussions around the challenges of availability, interoperability, preservation, and delivery of open archaeological data (Wilson and Edwards Reference Wilson and Edwards2015). Recently, cOAlition S, an international consortium of research funders, launched the Plan S initiative for open-access publishing, which requires that scientific publications that result from research funded by public grants must be published in compliant open-access journals or platforms from 2020 onward (Science Europe 2019).
Additionally, technological developments have enhanced accessibility to artifacts via advanced computational photography tools, which have constantly evolved over the past four decades as computational photography has become a multidisciplinary field of research of particular interest to researchers, artists, photographers, and engineers. Computational photography lies at the intersection of computer vision, image processing, and computer graphics and incorporates sequence of images and a broad variety of techniques (Durand and Szeliski Reference Durand and Szeliski2007; Suo et al. Reference Suo, Ji and Dai2012). In the field of archaeological research, it is useful for extracting features for research purposes (Miles Reference Miles and López-Varela2018).
In the field of 3-D digitization, there have been significant developments in practical, cost-effective, and affordable techniques for reconstruction from 2-D images, such as Reality Capture (Capturing Reality 2017), Agisoft Metashape (Agisoft 2019), and Virtual Structure from Motion (Wu Reference Wu2015). Such 3-D digitization techniques have been used in archaeological recording and documentation, analysis, preservation and broadened access, restoration support, studies, dissemination, and teaching, but they are also valuable for enriching context. At this time, the importance of 3-D recording for documenting, analyzing, and safeguarding cultural heritage is well understood, and a huge range of new possibilities are being explored, as demonstrated by the continuous R&D activities of the field. Reflectance Transformation Imaging (RTI; Malzbender et al. Reference Malzbender, Gelb, Wolters and Pocock2001; Mudge et al. Reference Mudge, Malzbender, Schroer, Lum, Ioannides, Arnold, Niccolucci and Mania2006) and related imaging technologies, such as microphotography and transmitted and multispectral imaging, when applied in a synergistic mode, lead to the development of integrated RTI approaches that have revolutionized the way researchers interact with artifacts. Texture topography and subtle surface variations, accessed via RTI visualizations, enable the interactive and virtual visual analysis of artifacts. The digital surrogates, which are based on transparent scientific methodologies and principles, lead to authentic, reliable representations that can remove physical barriers and are useful for collaborative distributed scholarship (Mudge et al. Reference Mudge, Ashley and Schroer2007), documentation, and virtual visual analysis that would be either impossible, unethical, or too difficult using conventional means.
Emerging technologies relevant to online digital-based scholarship for cultural heritage repositories are the 3D Heritage Online Presenter (3DHOP) and the Web RTI tools developed by ISTI-CNR in Pisa. The webGLRTIMaker tool and WebRTIViewer enable online publication of high-resolution RTI images (http://vcg.isti.cnr.it/rti/webviewer.php). Users can explore digitized artifacts in an interactive relighting mode online (Palma Reference Palma2012). Similarly, 3DHOP is a framework for the creation of advanced Web-based visual presentations of high-resolution 3-D content (Potenziani et al. Reference Potenziani, Callieri, Dellepiane, Corsini, Ponchio and Scopigno2015). In addition, Cultural Heritage-Object (CHER-Ob), the open-source virtual research environment, offers a flexible, expandable integrated platform for collaborative cultural heritage research, which is compatible with commonly used imaging data types (2-D and 3-D images, RTIs, CT) and textual information. Preliminary research has demonstrated the enhanced analysis, evaluation, documentation, sharing, and management of 3-D and 2-D visualizations options enabled by CHER-Ob. Among other advanced research functions, CHER-Ob offers automatic report generation in a Web-based format (Shi et al. Reference Shi, Kotoula, Akoglu, Yang, Rushmeier, Catalano and Luca2016; Wang et al. Reference Wang, Shi, Akoglu, Kotoula, Yang and Rushmeier2018; Yale University Computer Graphics Research Group 2016).
Visualization and Online Publication of Basketry
Although the field of cultural heritage informatics is developing rapidly, as demonstrated by these technological advances, the existing platforms provide only limited information for an in-depth analysis of basketry. Many digital libraries of basketry accompanied by 2-D static images provide useful information for provenance, technology, and decoration, but they cannot visualize the three-dimensionality and detailed features of the baskets. Characteristic examples are the Reanimating Cultural Heritage project (http://sierraleoneheritage.org) and the University of Oregon Museum of Natural and Cultural History (https://natural-history.uoregon.edu), which provide online access to basketry material. In the field of RTI visualization, a few relevant applications are focused on textiles with less complicated geometry than baskets (Eastop Reference Eastop2016; Goldman et al. Reference Goldman, Linn, Shamir and Weinstein-Evron2018). RTI has been used for the study of impressions (Frank Reference Frank2014), following the common practice of analyzing negative impressions in ceramics and other media to recover data about woven artifacts that rarely survive (Adovasio Reference Adovasio2004; Drooker 1992, 2001; Holmes Reference Holmes and Powell1884; Jolie Reference Jolie, Cordero and Hogan2010; King Reference King1978; Petersen Reference Petersen1996; Pitblado et al. Reference Pitblado, Cannon, Bloxham, Janetski, Adovasio, Anderson and Nelson2013; Soffer et al. Reference Soffer, Adovasio and Hyland2000). In addition, the enhanced visualization of incisions via RTI informs the representation of baskets and textiles (Lemke et al. Reference Lemke, Clark Wernecke and Collins2015; Mock Reference Mock2016). In terms of 3-D visualizations, earlier attempts to generate virtual basketry museums populated by 3-D models (Isler et al. Reference Isler, Wilson and Bajcsy2007) did not progress beyond the computational design.
The main problematic aspects of existing platforms are the limited number of digitized baskets available online, the quality of digitization, the unstructured and nonstandardized metadata provided, and the limited access/download and search options. For example, the Europeana digital library features only one 3-D model of a palm basket with lid available in a PDF format from the Cyprus Institute–STARC, which was digitized during the CARARE project (Cyprus Institute 2019).Footnote 1 The Sketchfab cultural heritage content includes more than 500 baskets digitized by museums and 3-D enthusiasts. However, almost all digitized baskets, with a few exceptions from the British Museum (https://sketchfab.com/britishmuseum) and the Santa Cruz Museum of Art and History (https://sketchfab.com/santacruzmah), are only accessible online and are not available for free download, limiting the possibilities for comparative analysis.
Digital technologies—computer visualizations in the form of RTI and 3-D models—and fabrication via 3-D printing have been proposed to achieve the core aims of conservation (Kotoula Reference Kotoula2017). A similar approach is recommended for friable materials, such as impressed shreds, in an attempt to avoid damage or contamination incurred during the physical fabrication of molds from clay, latex, plaster, or similar materials. This approach meets conservation objectives for nondestructive analysis because the available 3-D modeling tools make the creation of such negative molds trivial, and it is easy to perform. Furthermore, this approach eliminates the need to borrow sherds on loan or to transport positive casts in clay. The former can be difficult and heavy to transport, whereas the impressions, depending on the casting medium, may obliterate the positive casts if they are nonhardening. By extension, the digital versions preserve the cast for restudy and easy data sharing.
MATERIALS AND METHODS
Cache Cave
As indicated at the beginning of this article, the site known as Cache Cave (CA-KER-10419) presents a series of challenges in terms of visualizing perishable remains. It is a series of interconnected rock shelters comprised of a mudflow breccia and located on the Wind Wolves Preserve, in south-central California: it is the largest cache site discovered within the traditional territory of the Emigdiano Chumash (Robinson et al. Reference Robinson, Whitby, Wienhold, Jones and Perry2012). Caching was a common if poorly understood native practice across the region, with sites typically defined as small equipment stashes in discrete rock shelters (Bryne et al. Reference Bryne, Gandy, Robinson and Johnson2016; Whitby Reference Whitby2012). Excavations from 2012 to 2018 at Cache Cave revealed a wide range of perishable materials, including cordage, bone, antler, shell, leather, wood, food residues, and baskets (McArthur and Robinson Reference McArthur and Robinson2016; Robinson Reference Robinson2017). Dates so far acquired indicate prehistoric human use of the shelters for more than 2,000 years, including the potential use of the cave in the ethnohistoric period beginning in the AD 1700s. This dating is important because California native basketry is considered among the finest basketry traditions ever developed, with the Chumash and their neighbors famous for the range and sophistication of the objects they made from perishable materials (Dawson and Deetz Reference Dawson, Deetz and Miller1965; Elsasser Reference Elsasser and Heizer1978; Mason Reference Mason1904; Shanks Reference Shanks2010). Thus, Cache Cave offers a unique opportunity to investigate a long-term sequence of Californian perishable technology stretching from prehistory through the ethnohistoric period. For the present study, recently excavated baskets of a variety of shapes and dimensions, either complete or in a fragmentary state, were selected as case studies. Table 1 summarizes the technical characteristics, dimensions, and preservation state of basketry material presented here, along with a brief description in accordance with the technical terminology and standardized analytical procedures commonly used by analysts (Adovasio Reference Adovasio2010; Jolie Reference Jolie, Sutton and Arkush2014). This article also presents visualizations of basketry in situ during the excavation of Cache Cave.
TABLE 1. Technical Characteristics of Basketry Material in This Study.

Data Acquisition and Processing
RTI visualizations were created following the Highlight RTI data capture method, recommended by Cultural Heritage Imaging (2013) and the Historic England guidelines (Duffy et al. Reference Duffy, Bryan, Earl, Beale, Pagi and Kotoula2013), in vertical and horizontal configurations using either one or two targets (reflective spheres) with an average size of approximately 190px. The data acquisition took place at the Wind Wolves Preserve in Bakersfield, California, and at the Santa Barbara Museum of Natural History. The datasets, consisting of an average of 61 raking and oblique light images, were processed with RTI Builder software, using the hemispherical harmonics (HSH) fitting algorithm (Schroer and Bogart Reference Schroer and Bogart2011). RTI is an interactive relighting technique that forms a synthesized image derived from a sequence of raking light images. The user can choose to view the object under examination as if it were lit from different directions, to apply digital imaging filters, and to change the intensity of the lights. These options enable detailed examination of the surface topography, which creates a viewing experience that fills the gap between 2-D digital photographs and 3-D models. During viewing, the user can save 2-D images in the JPEG format (snapshots).
The RTI snapshots included in this study were carefully selected to emphasize characteristics of the basketry material under discussion, such as the degradation phenomena or decorative features. Polynomial texture maps and RTIs provide increased realism and include surface colors, self-shadowing, subsurface scattering, and interreflections, which are not provided by bump and traditional texture mapping. Through RTI, experts and the public can view artifacts in a new way that is different from visual examination or handling. In the case of basketry, RTI potentially accentuates different aspects of construction and weave structure that can contribute toward improved documentation, as it does with other material types. Nevertheless, appropriate testing is necessary because of the limited applications of the technique for basketry material. Table 2 presents the metadata for the RTI visualizations, including the equipment used for data capture. It follows the guidelines of the Archaeology Data Service, in accordance with published RTI data (Riris and Corteletti Reference Riris and Corteletti2015; Smith et al. Reference Smith, Beale, Richards and Scholma-Mason2018).
TABLE 2. Metadata for Digitization of Basketry.
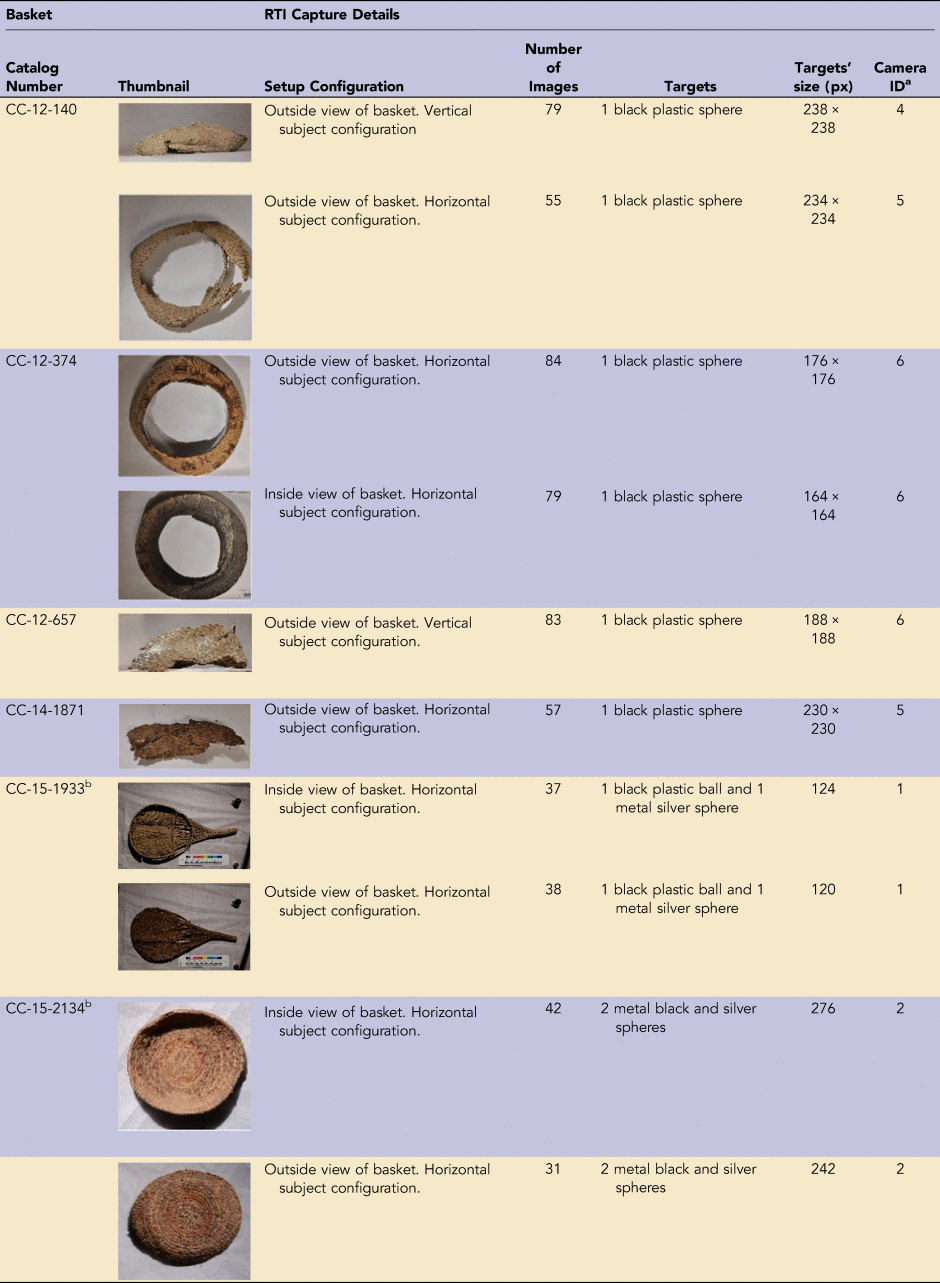
Notes: Indoors data capture; no filter used. Light type: visible light. Light source: flash.
a Camera metadata ID KEY. 1: Camera NIKON D3100, Lens type AF-S DX Micro NIKKOR 40 mm, ISO 100, Aperture f/8, Shutter Speed 1/15 sec, Focal Length 24 mm. 2: Camera NIKON D3100, Lens type AF-S DX Micro NIKKOR 40 mm, ISO 100, Aperture f/8, Shutter Speed 1/15 sec, Focal Length 40 mm. 4: Camera NIKON D90, Lens type AF-S Nikkor 18–55 mm, ISO 200, Aperture f/8, Shutter Speed 1/60 sec, Focal Length 26 mm. 5: Camera NIKON D90, Lens type AF-S Nikkor 18-55 mm, ISO 200, Aperture f/8, Shutter Speed 1/60 sec, Focal Length 25 mm. 6: Camera NIKON D90, Lens type AF-S Nikkor 18–55 mm, ISO 200, Aperture f/8, Shutter Speed 1/60 sec, Focal Length 18 mm.
b 3-D digitized artifact.
As part of this study, two objects that were almost completely preserved—a small basket and a seed beater—were 3-D digitized photogrammetrically with the Agisoft PhotoScanPro (version 1.4.2. build 6205) using datasets of 148 and 238 images, respectively, captured with a NIKON D3100. For the in situ 3-D digitization of Feature 66, 492 images were taken with a Nikon D800 and a Nikon AF-S 17-35mm f/2.8D lens, taped at 17 mm. The camera was set to raw (.nef), ISO of 100, the white balance set to flash, and the lens at f9. Feature 66 was illuminated by four Nikon SB800 speedlights, each capped with a diffuser and synched through a Nikon SU-800 commander unit. Images were processed in Photoshop CC (version 18.0) and exported as JPEGs. The photogrammetry model was constructed in Agisoft PhotoScanPro (Version 1.3.0 build 3075), using the new visibly consistent mesh generation (VCMG) method (Agisoft 2018). Moreover, in situ 3-D digitization of baskets during excavation was completed using Reality Capture software (beta version 1).
Commonly used 3-D packages, such as the MeshLab (Cignoni et al. Reference Cignoni, Callieri, Corsini, Dellepiane, Ganovelli and Ranzuglia2008) and 3-D Studio Max (Autodesk 2019), were used for additional processing of the 3-D models. The 3-D modeling techniques, including slicing and rendering, were primarily used for dissemination, recording, and documentation purposes, as well as to reveal basketry characteristics. Although in material studies the contribution of 3-D modeling is usually associated with the virtual execution of impractical or ethically forbidden actions, this was not the focus of our study. The resulting files were accessed in CHER-Ob, and automated reports were created in HTML format, enhanced with 3DHOP and Web RTI components. Web-based visualizations of complex visual media assets generated during this study are available online for viewing via the ARIADNE visual media automatic service by following the links provided in the figure captions.
We used open-source software to process the data and view the RTI images. MeshLab and CHER-Ob are also open access. 3DS Max, Agisoft PhotoScan, and Reality Capture are commercial software, which might be accessible via subscriptions obtained through educational institutions. Alternatively, 3DS Max costs $190 per month but is free for students. The minimum cost for the current version of AgisoftFootnote 2 is $179. Reality Capture costs $112 for a three-month license. Figure 1 presents a schematic explanation of the methodology employed.
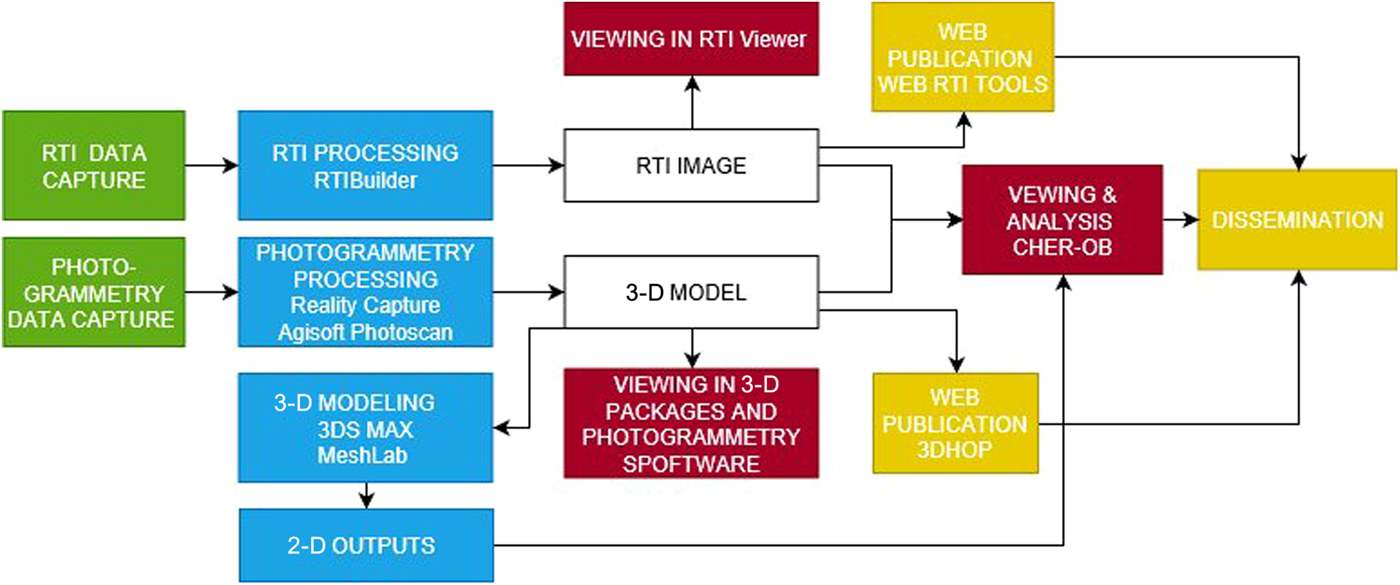
FIGURE 1. Schematic explanation of the methodology employed. Green color indicates data capture phase, followed by blue color for processing required for the generation of RTI files, 3-D models, and 2-D outputs. Red color indicates viewing and analysis, and yellow color shows tools available for dissemination of computer visualizations.
RESULTS AND DISCUSSION
Documentation of the State of Preservation
To determine the effectiveness of our methodology with perishables such as those from Cache Cave, we considered the most common weathering effects in basketry material, such as compression damage, deformations, detached fibers or elements, tears, breakage and loss, protruding fibers, dirt kinks, discoloration, and a disfigured surface (CCI 2010; Mason Reference Mason2018). Our “digital surrogates” in the form of 3-D models seemed to provide the necessary information for recording and documenting the shape and distortions and deformations. We found that an efficient way to document and understand the extent of distortions in basketry was to use 3-D slicing modeling tools. These tools generate sections of 3-D models that can be rendered non-photorealistically and then processed using 2-D imaging software, producing visualizations that resemble archaeological drawings. This type of visualization is very common in other material types such as pottery. For example, the seed beater (CC-15-1933) presents a gradually increasing deformation in the horizontal sections starting from the handle (Figure 2a). Additionally, a deformation is observable in the vertical section. These deformations are probably associated with the forces applied to the seed beater while it was still in use; this provides valuable interpretive information about the biography of the object before its deposition in the cave. The sections in different areas assist not only in recording, documenting, and identifying the disfiguration for interpretation but also can guide reshaping and repairing, if considered necessary for the long-term stability of the basket or for display. In the case of baskets without severe distortions, such as the tray shown in Figure 2b (CC-15-2134), the profile drawing can be used for classification purposes. Moreover, 3-D models can be potentially used for monitoring purposes by comparing the visualizations produced at different times using the user-friendly open-source software CloudCompare (2019) or similar tools.
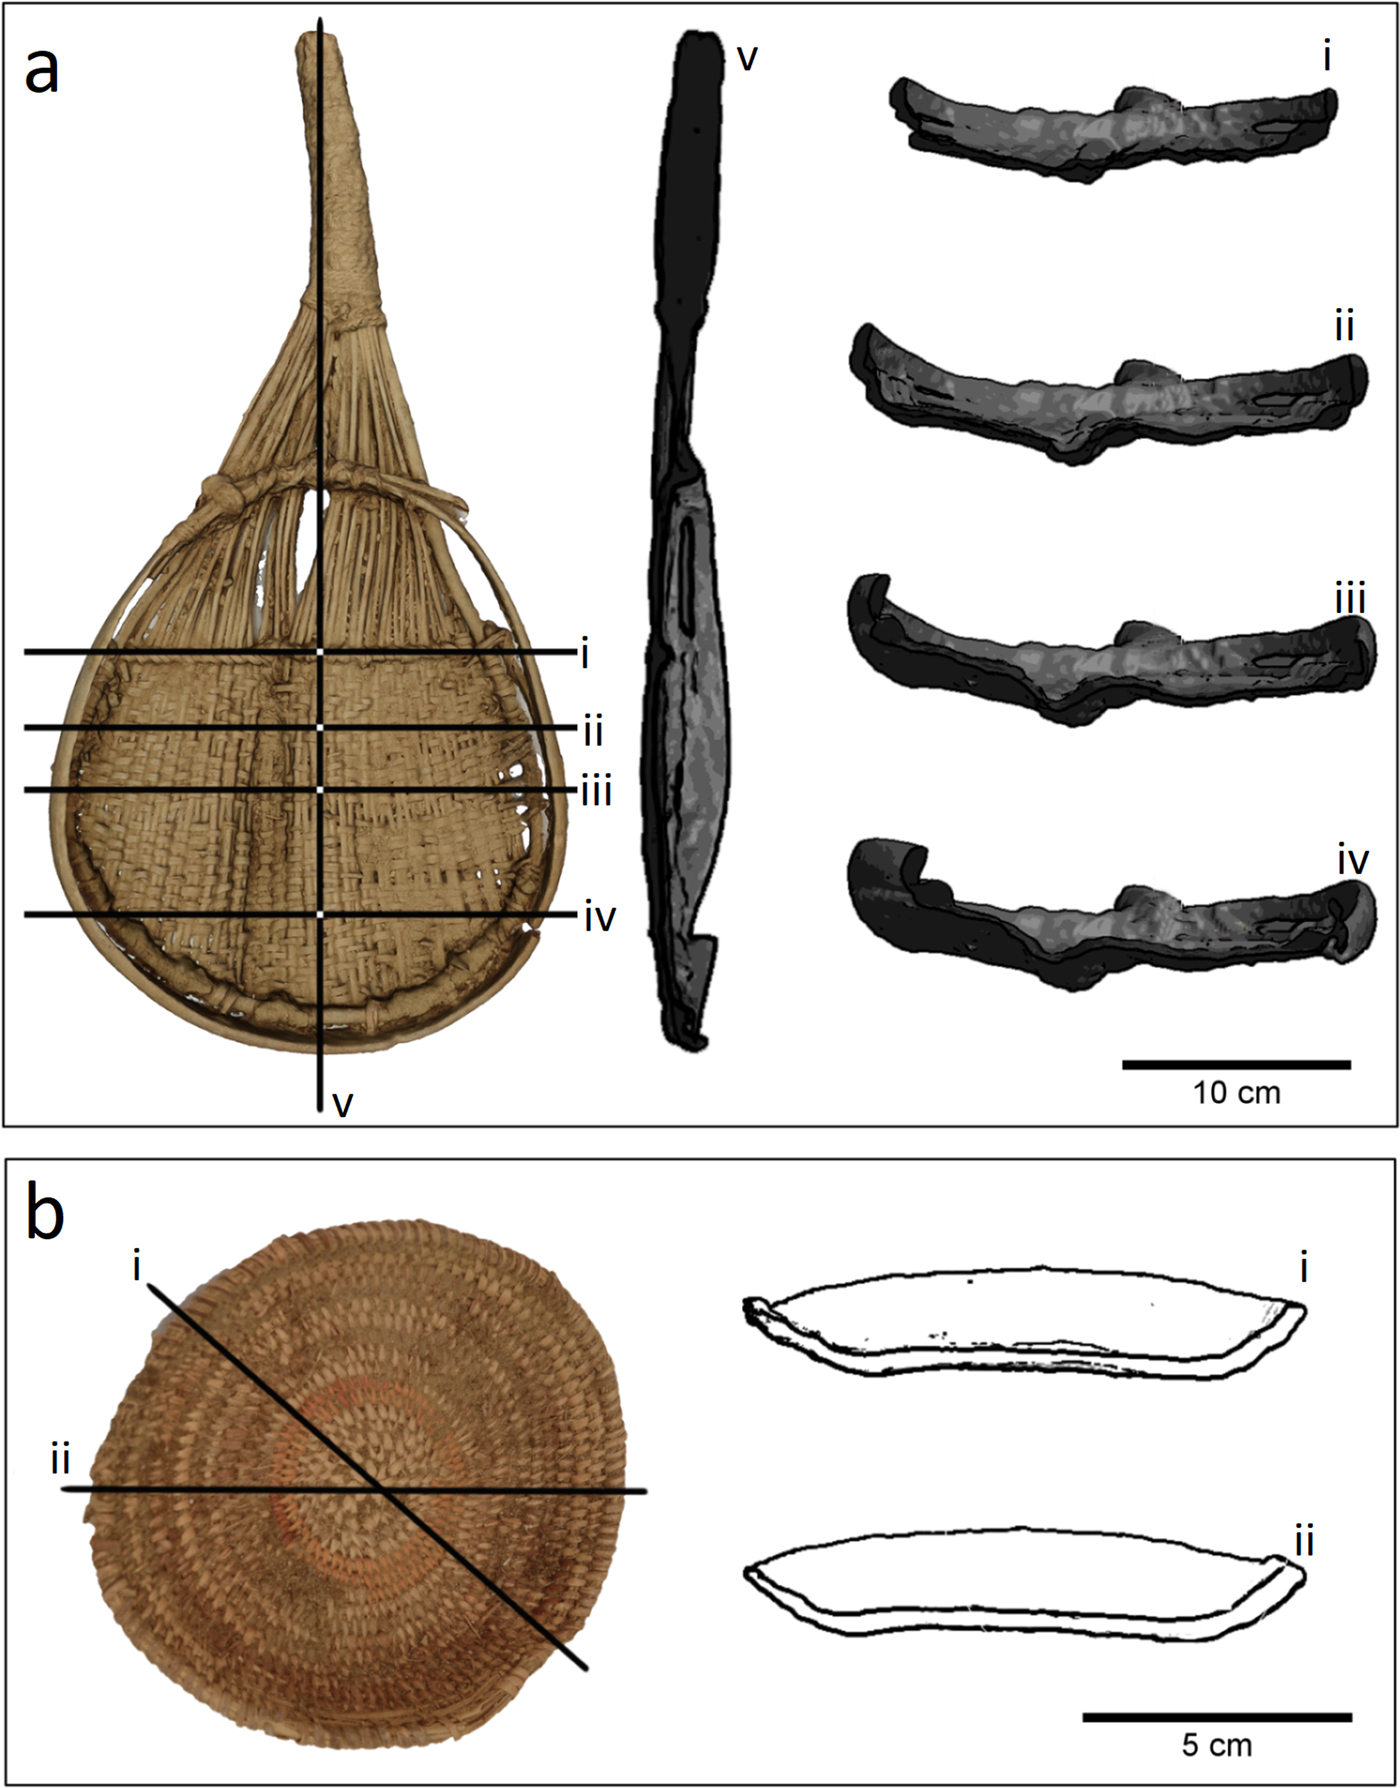
FIGURE 2. Seed beater (CC-15-1933) (a) and tray CC-15-2134 (b), sections generated in 3DS Max. Visualizations available online at https://visual.ariadne-infrastructure.eu/3d/seed_basket, https://visual.ariadne-infrastructure.eu/rti/basket_cc_15_1933, and https://visual.ariadne-infrastructure.eu/rti/basket_cc_15__2134_
Interactive relighting visualizations are also useful tools in recording heavily distorted baskets in a fragmentary state. For example, the normal map of the badly deteriorated CC-14-1871 basket fragment shows the areas of major geometric transformation of the uneven surface as a bright cyan color (Figure 3a–b). In that way, it is possible to understand the complex three-dimensionality of the fragment via a 2-D visualization. Computational photography techniques do not provide more evidence regarding discoloration than do static 2-D images but help distinguish discolored fibers from depositions. The basket CC-12-657 is characterized by large areas of discoloration, which proved to be depositions of white color, as shown in the close-up RTI views (Figure 3c–f). The detached, protruding fibers and the areas of loss, tears, and splits were more discernible in the RTI visualization than in static 2-D images. A characteristic example is the basket CC-12-140, which presents breakage of fibers, splits, and missing parts. The RTI renderings enabled better views of the surface morphology and emphasized the geometric transformation of the surface (Figure 3g–j).
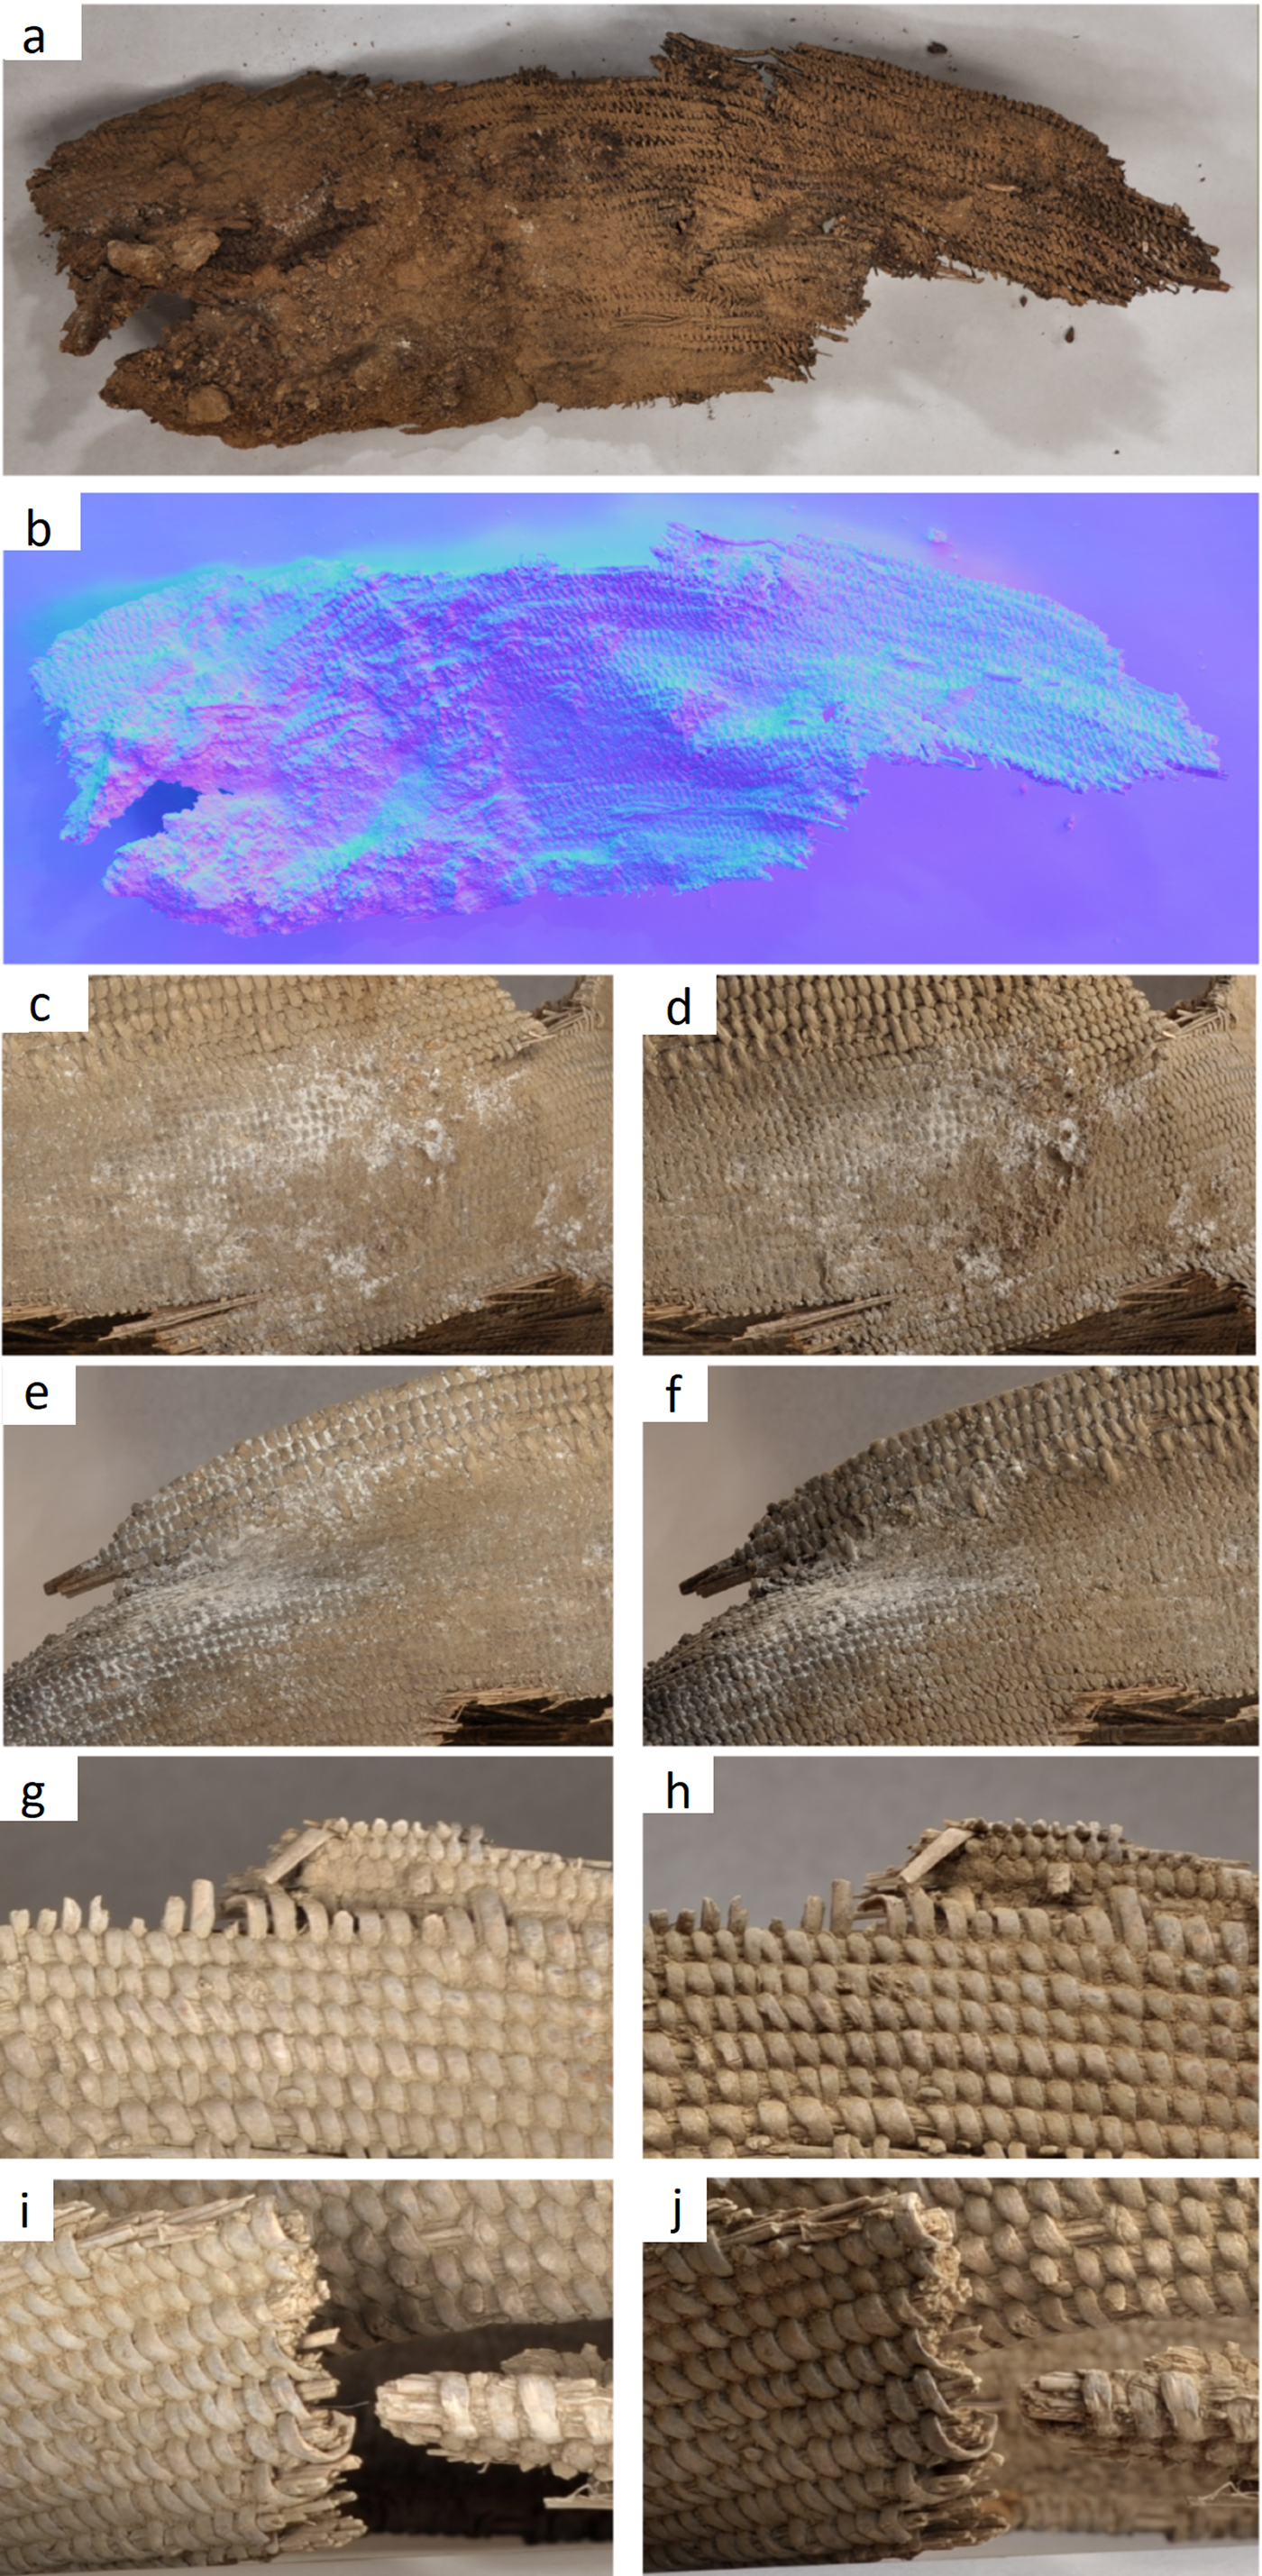
FIGURE 3. Basket CC-14-1871. Comparison of views as if lighted from above (a) and RTI normal map (b). Basket CC-12-657. Comparisons of RTI views as if lighted from above (c,e) and RTI visualizations in default rendering mode (d,f). Basket CC-12-140. Comparison of RTI view as if lighted from above (g,i) and RTI visualizations in default rendering mode (h,j). Visualizations available online at https://visual.ariadne-infrastructure.eu/rti/cc_14_1871, https://visual.ariadne-infrastructure.eu/rti/basket-cc-12-657 and https://visual.ariadne-infrastructure.eu/rti/basket-cc-12-140
RTI is more efficient in recording surface details in the form of tears and depositions than 3-D visualization. Nevertheless, those visualizations provide useful information about the shape of baskets that cannot be seen in 2-D. Additionally, volumetric, dimensional, and morphological analysis via the comparison of measurements and shapes and their variations, which assists in the categorization of basketry, is based on 3-D visualizations. For the analysis of basketry in a poor state of preservation, 3-D digitization is highly recommended because of the possible damage incurred during lifting, transporting, and storing. For example, Craig M. Lee and colleagues have been documenting baskets and other perishable artifacts emerging from melting ice patches in the greater Yellowstone area of Montana and Wyoming (personal communication to E. Jolie 2018; Lee and Puseman Reference Lee and Puseman2017). In situ documentation enables a better understanding of the major alterations taking place during and after excavation and facilitates improved postexcavation analyses of baskets and other perishable artifacts by perishables analysts or conservators in the lab. Indeed, images and models generated by Lee and his collaborators were of value not just for in situ documentation but also for understanding and excavating a 1,400-year-old basket removed from an ice patch en bloc and sent to us on dry ice covered in matrix for study. As shown in Figure 4, a photogrammetric dataset of 46 images was processed in Reality Capture software, creating a 3-D model of part of the Cache Cave during excavation.
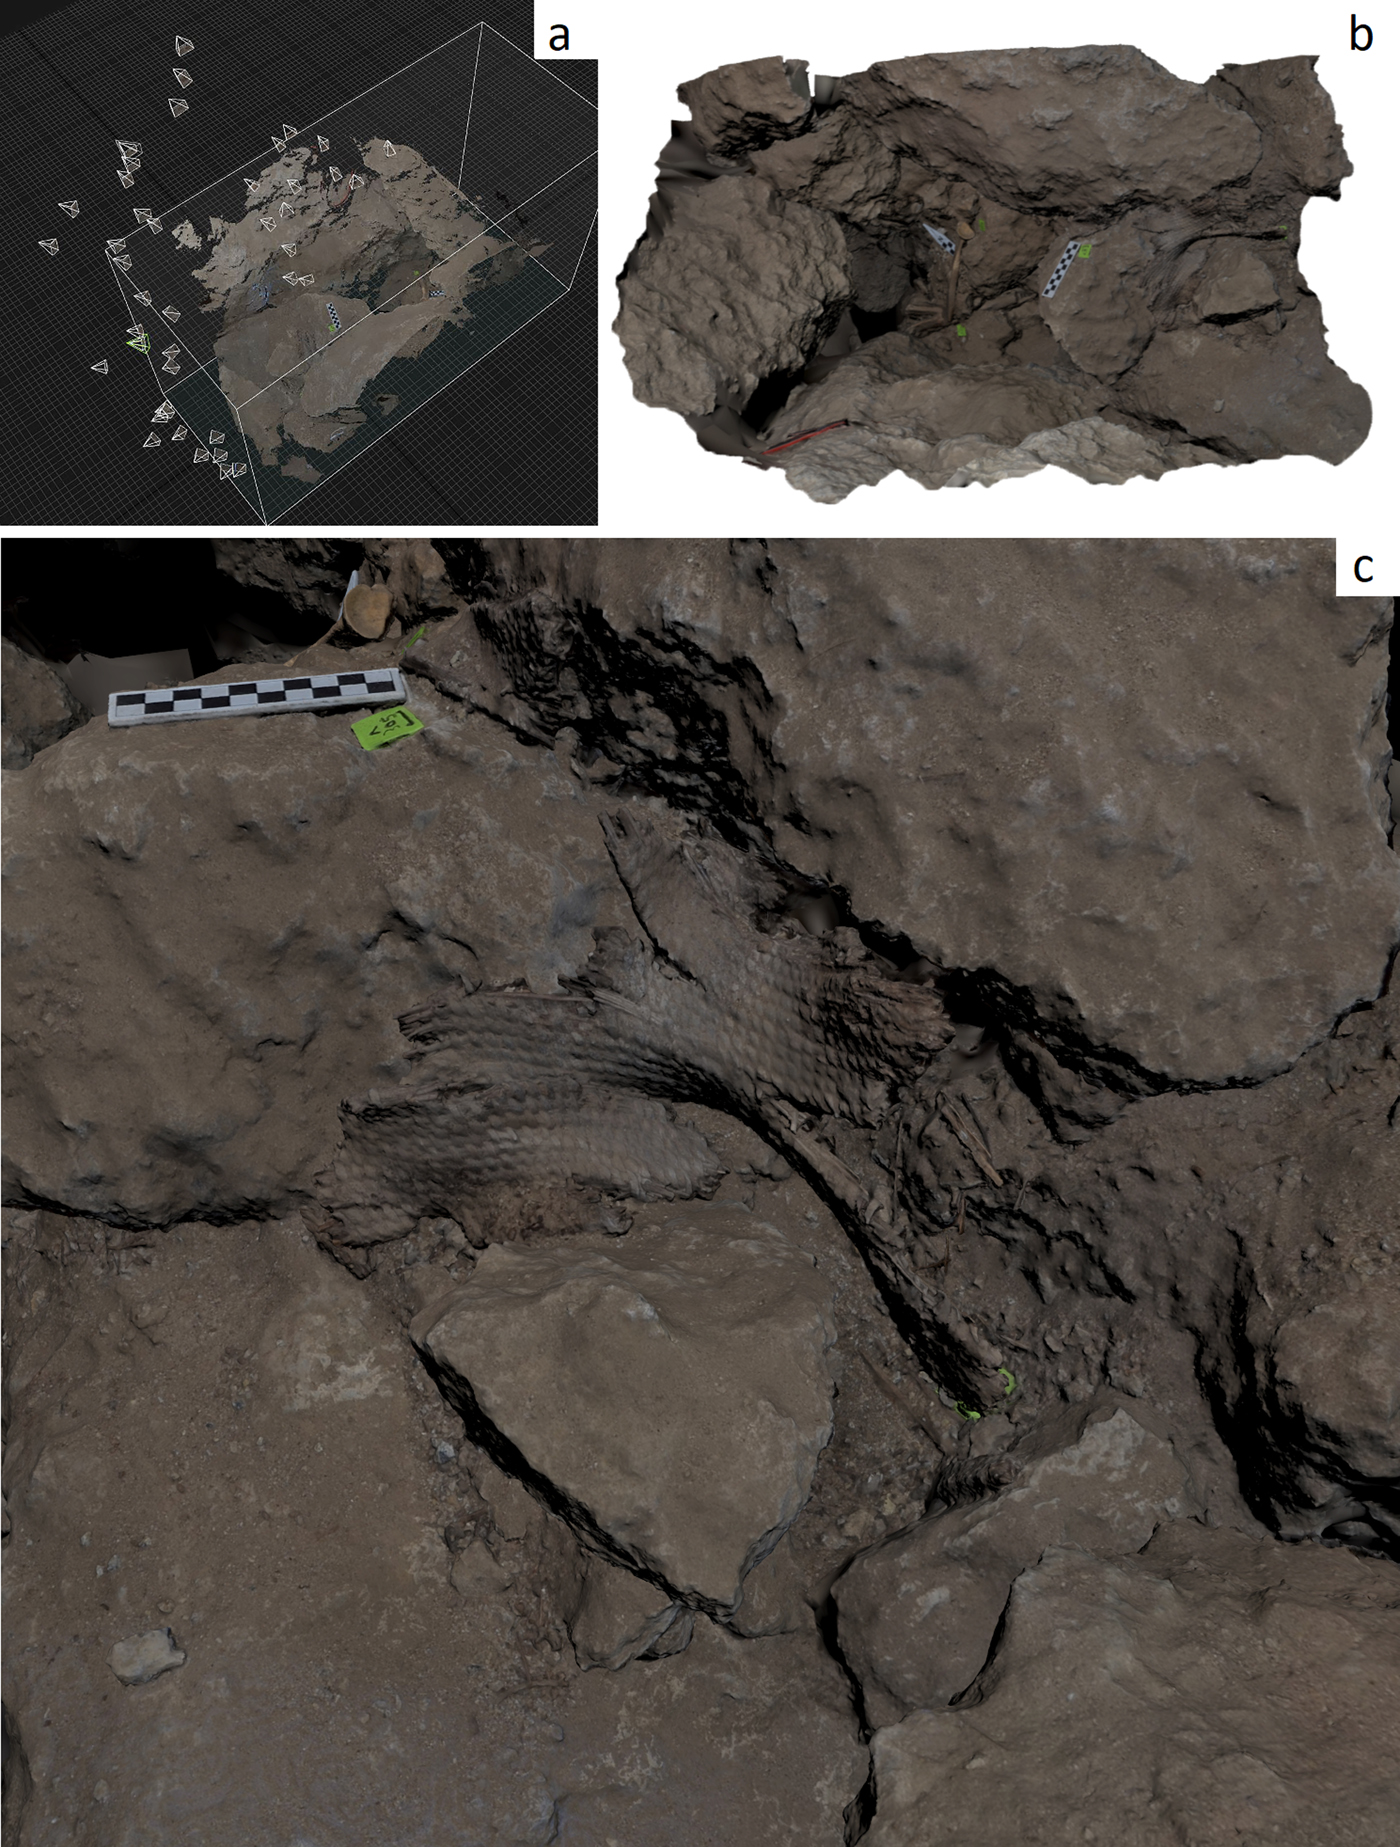
FIGURE 4. Cache Cave during excavation. Screenshot of Reality Capture showing the alignment of cameras (a). Renderings, general view of the reconstructed 3D model (b) and basket fragment detail (c). Visualization available online at https://visual.ariadne-infrastructure.eu/3d/cache
Nevertheless, in situ photogrammetric data acquisition is challenging. For example, Feature 66, located in Cave 3, is a difficult-to-reach area within the Cache Cave system: access required navigating a system of three ladders, scrambling, and limited climbing. Cave 3 can be described as a large void in the midst of tons of collapsed rock, with large boulders hemming in its west and south portions, held in place by the house-sized boulder forming the east wall. Though some rocks were solidly in place, others were precarious and could potentially shift or fall, which meant great caution was needed at all times. Adding to the physical dangers, Cave 3 is located in the dark zone of the Cache Cave system, with functionally no light entering the cave. A small LED lamp (approx. 80 lumens) aided in focusing and moving through the cave to document the finds. Because of the lamp's low output it had no impact on the photograph exposures.
Located at the convergence of a large overhanging boulder and the east cave wall, Feature 66 was spatially confined and offered many challenges in terms of camera placement and lighting. Because of these conditions, all images were taken handheld, which offered mobility in tight quarters. The SB800s were individually mounted on JOBY GorillaPods and were continually moved through the cave as needed, often with one speedlight being handheld just off camera to diminish negative impacts from shadows in each shot. A total of 532 photographs were taken to create a photogrammetric 3-D model of Feature 66 in situ. The output 3-D model, especially in conjunction with standard plan drawings, provides visual evidence of how the large twined fragment was used to cache the other objects. Using a 3-D viewer allows investigation of the feature from every angle. The use of the large twined basket can then be further illustrated by capturing screenshots of various views in 2-D graphic form. For instance, the model shows that an awl is embedded in a fold of the large basket fragment, and the two wooden vessels are nestled into the edge of the same basket (Figure 5). It also shows how the cache is nestled into a rock platform. Creating a viewable 3-D model from so many images has the disadvantage of typically requiring a reduction in the resolution of each, sacrificing fine detail for ease of use. However, even though the 3-D model is created by a large quantity of 2-D photographs, it has advantages over those static views. First, it allows visualization of the topography of the archaeological features, which is not possible in any single 2-D image. Second, it allows motion across and through that topography, enabling a scalable exploration of artifacts, natural features, and relationships. Perhaps most importantly, the model creates fluid space within which any perspective can be adopted, even ones that were not originally captured in any of the 532 photographs.
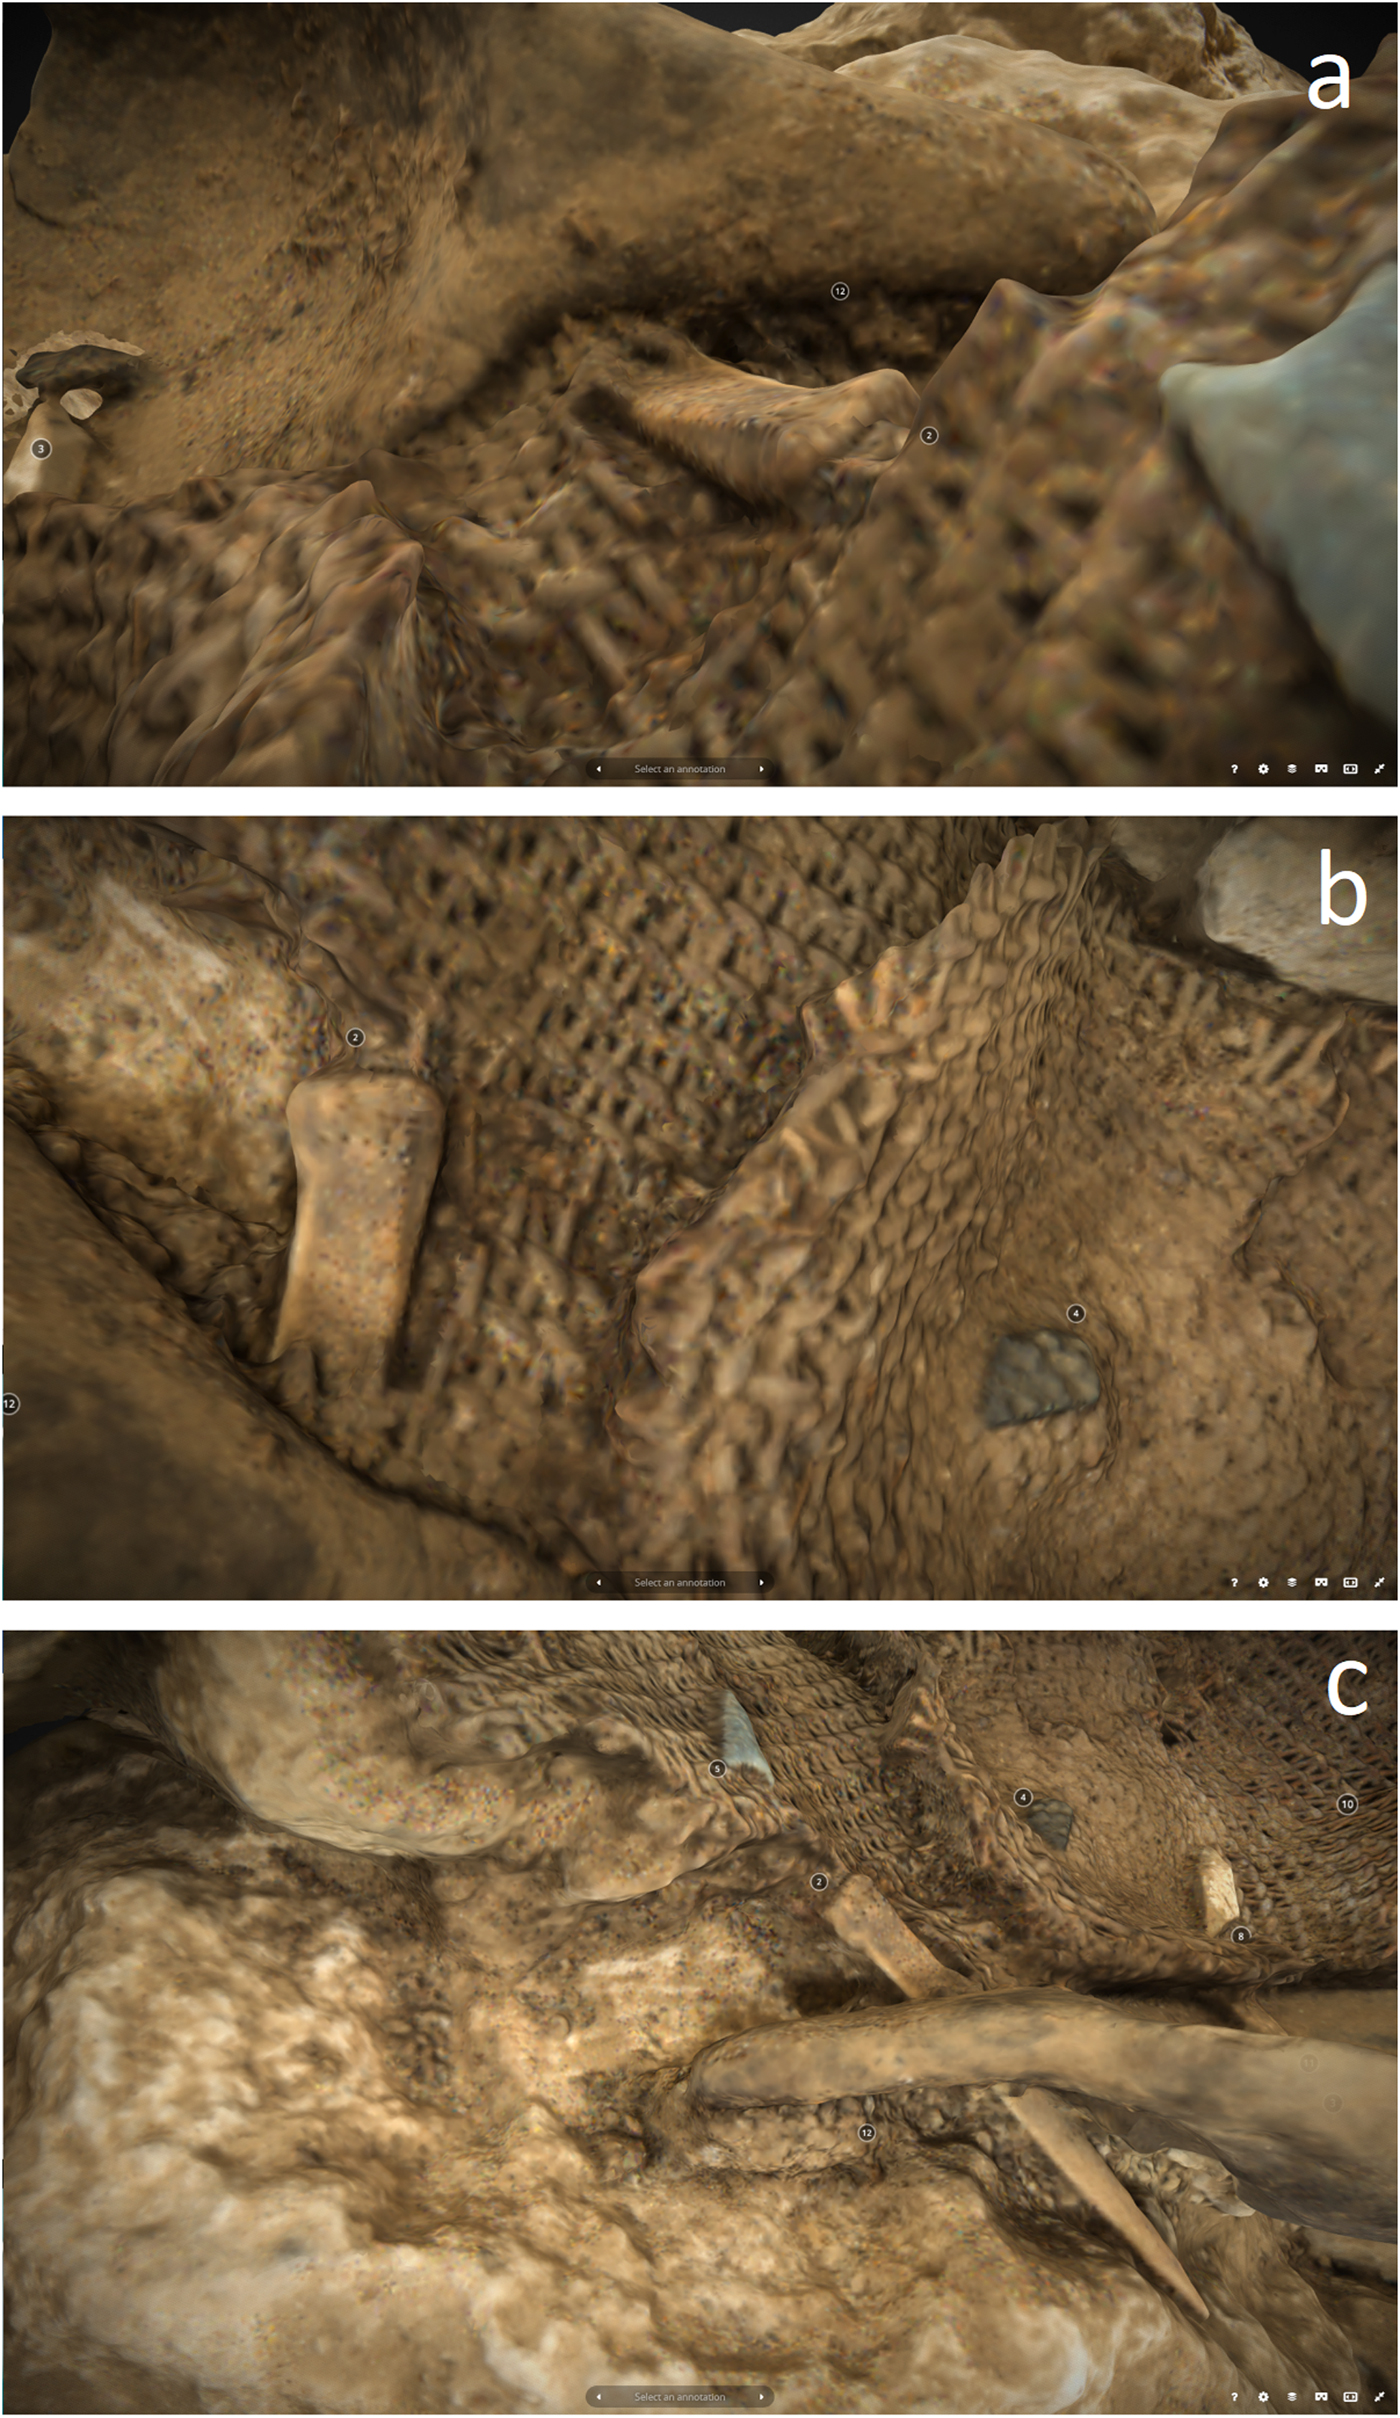
FIGURE 5. Three screenshots of the 3-D photogrammetry model of Feature 66, Cave 3, Cache Cave, focusing on the relative position of the awl. Note how the awl is both above and below the large open-twined basket, illustrating that the awl is wrapped within a fold of the large basket.
Recording Basketry Technology
Large areas covered by a thick layer of depositions render the weaving pattern of the baskets and their decoration completely or partially invisible. Close-up details of basket CC-14-1871 and the seed beater (CC-15-1933) reveal that the RTI renderings were able to visualize the texture of the basket in areas that appear to be covered by depositions in the static 2-D image (Figure 6a–d). Similarly, RTI visualizations of the basket CC-12-374 reveal its decoration, as shown in Figure 6e–h.
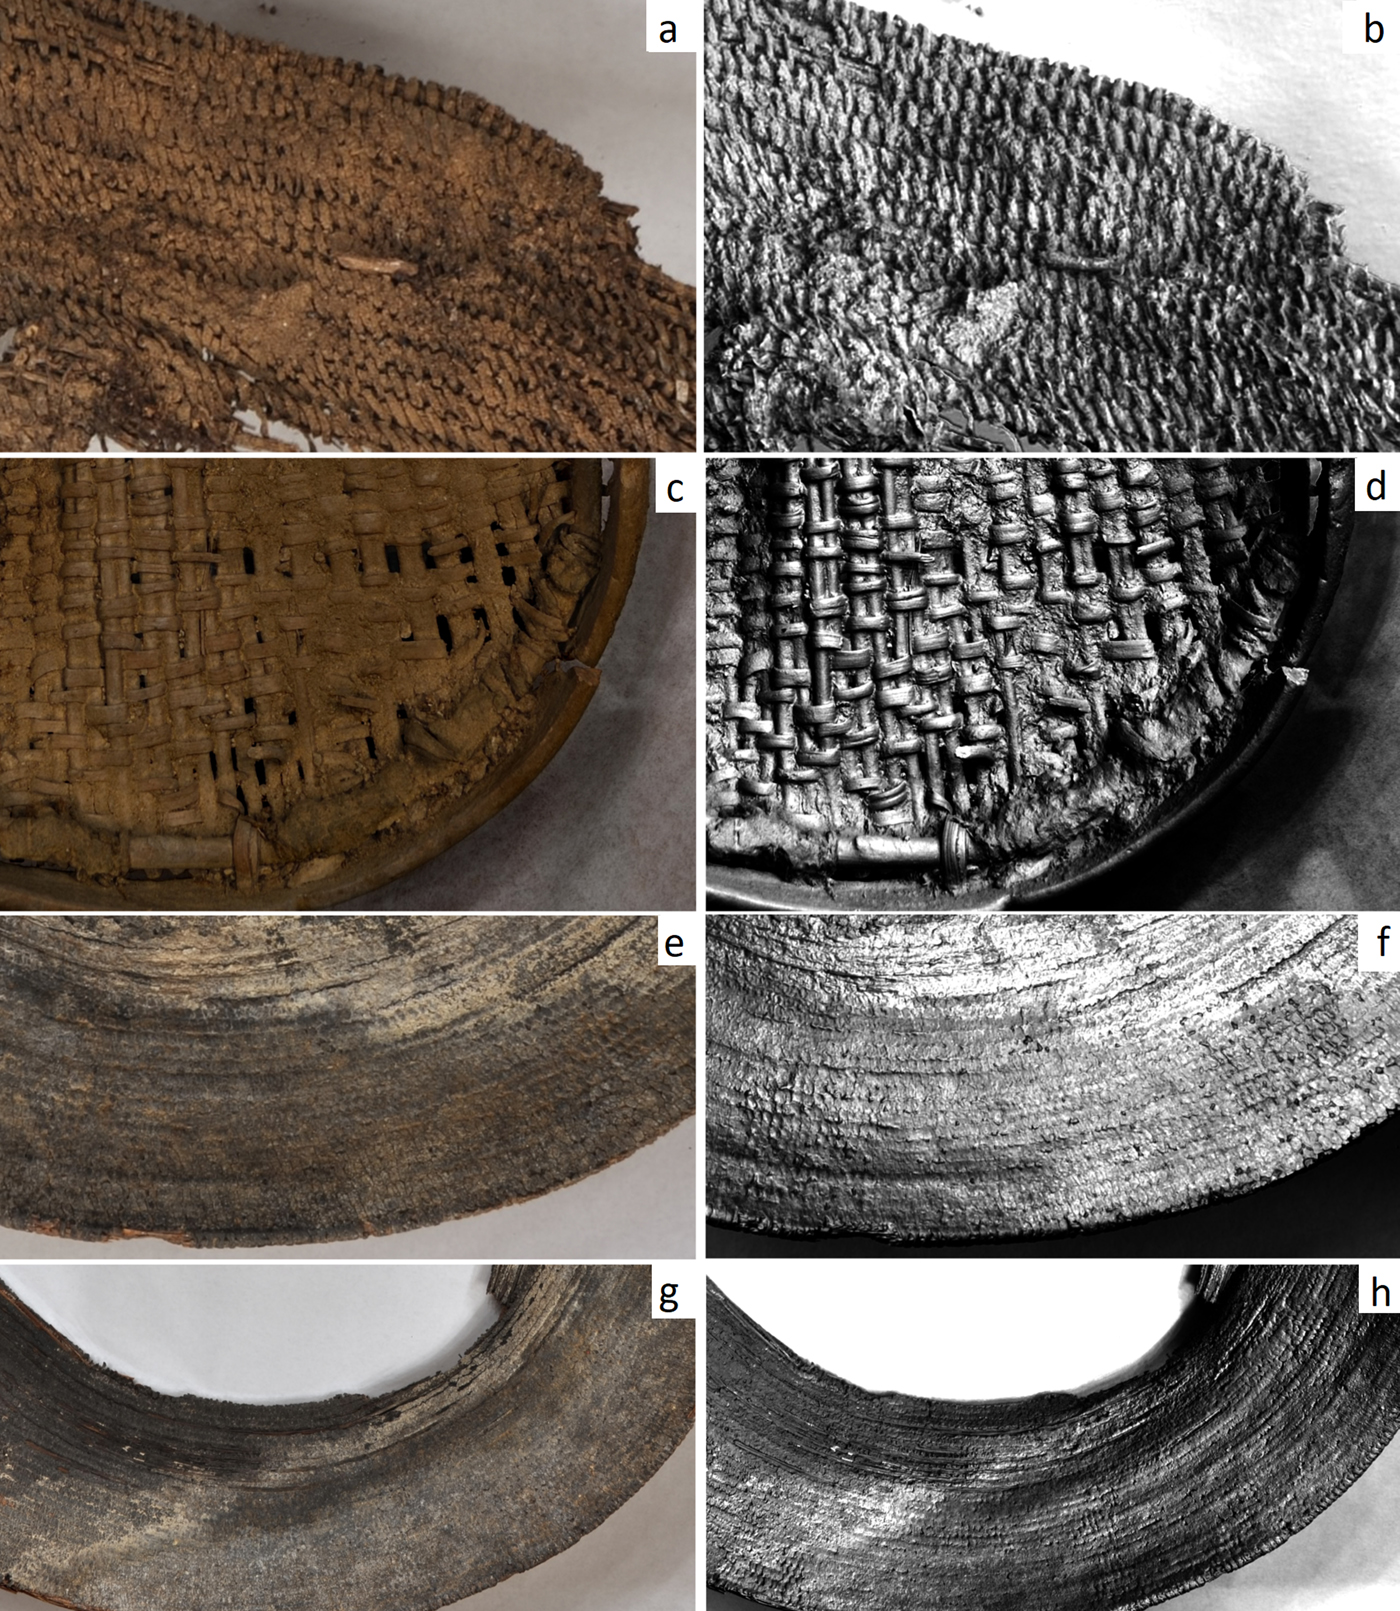
FIGURE 6. Comparison of views as if lighted from above and RTI visualizations in specular enhancement rendering mode. Basket CC-14-1871 (a,b). Seed beater CC-15-1933 (c,d). Basket CC-12-374 (e,f,g,h). Visualization available online at https://visual.ariadne-infrastructure.eu/rti/cc_14_1871, https://visual.ariadne-infrastructure.eu/rti/basket_cc_15_1933 and https://visual.ariadne-infrastructure.eu/rti/basket-cc-12-374-1.
In general, we found that RTI is useful for recording basketry technology features. RTI renderings emphasize the basic structure (side), beginning of strands (base), end of strands (rim), orientation of strands, active and passive elements, and systems involved in the construction of basketry. The top two rows of the left column in Figure 7 show details of the nonwork (convex) surface of the basket CC-15-2134 as if lit from above. On the convex surface, the normal continuous coil that starts with three to four reinforcing stitches over the first couple of coils appears emphasized in the RTI default rendering and normal visualization. The specular enhancement view is less informative for the visualization of the normal continuous coil that starts with three to four reinforcing stitches over the first couple of coils compared to default and normal visualization. The gaps between stitches and the stitches piercing the coil's bundle foundation become more apparent in RTI default, specular enhancement, and normal map views.
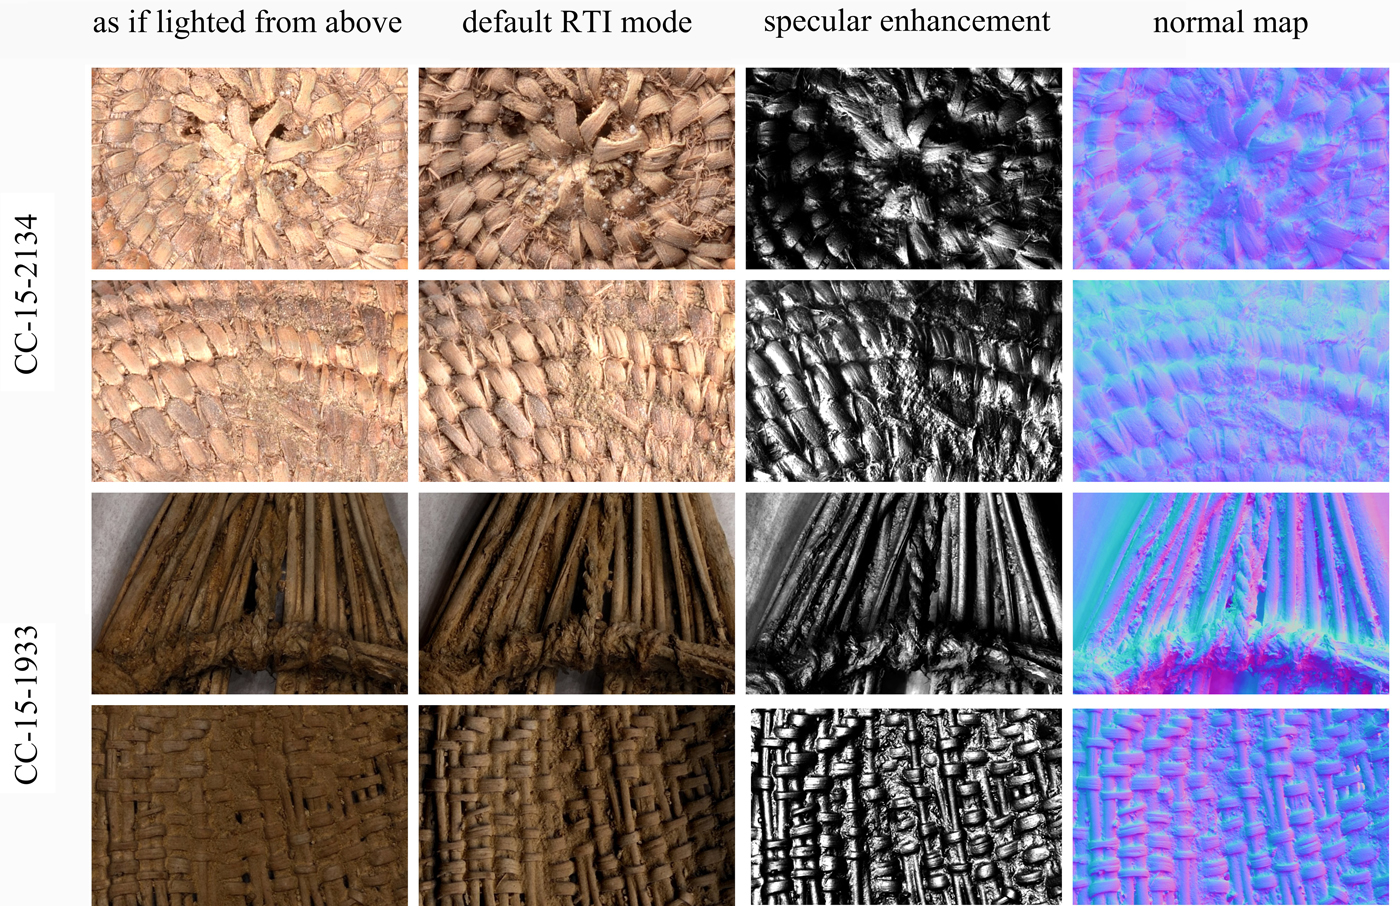
FIGURE 7. RTI details of tray CC-15-2134 and seed beater CC-15-1933, as if lighted from above, default rendering mode, specular enhancement rendering mode and normal maps. Visualization available online at https://visual.ariadne-infrastructure.eu/rti/basket_cc_15__2134_ and https://visual.ariadne-infrastructure.eu/rti/basket_cc_15_1933
For the seed beater (CC-15-1933), the two bottom rows of the left column in Figure 7 show details as if lit from above. The third row from the top presents RTI views of the 1/1 interval of simple plaiting (interlacing), in which peeled-shoot weft strips pass over and under pairs of rigid elements acting as a single warp unit. The specular enhancement mode and the normal map visualizations are enhanced visualizations compared to the static 2-D image as if lit from above. Similarly, the details of the 2-ply, S-spun, final Z-twist cordage that serves to bind the seed beater's rim together while securing it to the handle, which consists of the gathered warp rods wrapped with the same cordage, are more clear in the RTI views than in the static 2-D image as if lit from above.
When we used 3-D models, we found that the efficient identification of different basketry techniques depended on the quality of digitization and the rendering settings. Renderings without texture tend to provide a clearer picture of the technological features. Additionally, by manipulating the direction, contrast, and brightness light settings, the user can gain a more informative view of the structural elements and their manner of engagement. Nevertheless, nontextured renderings lack important information derived from color variation, which is a key parameter for understanding basketry technology: textured renderings are necessary for the examination of color decoration and the differentiation in the color of the weaving elements as derived from different species and processing with different techniques. For example, the color differentiation close to the base of the small basket, probably a decoration feature, is visible in the textured 3-D renderings, which provide a better understanding of its shape and three-dimensionality. A detail from the same area in the RTI mode emphasizes surface texture and retains color information, assisting the analysis of technological and decorative features (Figures 8a–d). As observed in Feature 66, fine details of the basketry were lost in the rendering process, particularly in the case of the larger baskets’ frayed edges. VCMG offered far better fidelity for minute basketry details, layering of basketry, and frayed ends: it even distinguished individual strands, as shown in Figure 8e–f. Regrettably, the texturing of VCMG objects is of poor quality, with uneven surface coloring, blank pixel data, and variegated patterns of distortion throughout the texture.

FIGURE 8. Comparison of (a) colored and textured and (b) raking light renderings of tray CC-15-2134. Comparison of (c) noncolored and (d) raking light renderings of seed beater CC-15-1933. Comparison of (e) standard mesh formation and the (f) experimental visibly consistent mesh generation.
Integration and Online Publication
Our analyses have demonstrated that interactive relighting visualizations succeed in emphasizing surface texture and by extension have proven useful for the documentation and analysis of baskets. 3-D visualizations provide useful information about the shape of the baskets. They assist in condition assessment via virtual visual analysis, limiting the human–object interaction and thereby avoiding unnecessary handling of the baskets. Most importantly, the combined 3-D and interactive relighting digitization approach is particularly useful in cases of complex basket types, such as the seed beater. As stated in the beginning of this article, we also wanted to determine how best to disseminate visualizations of perishables so other researchers could conduct their own virtual analyses.
The only way to compare these visualizations simultaneously in one virtual environment is the CHER-Ob software. Its multilevel annotation functionality assists this process of simultaneous virtual visual analysis. The CHER-Ob screenshot in Figure 9a compares the sides of the seed beater visualized in the RTI format and in the 3-D model. Figure 9b shows an annotated RTI view of a basket, using a combination of color-coded point and surface annotations. After completing the comparative virtual visual analysis, a report in a web-page format (HTML) can be created via the automatic report generation function in CHER-Ob. This web page can be further enriched with advanced computer visualizations transformed using 3DHOP (Figure 9c) and Web RTI tools (Figure 9d).
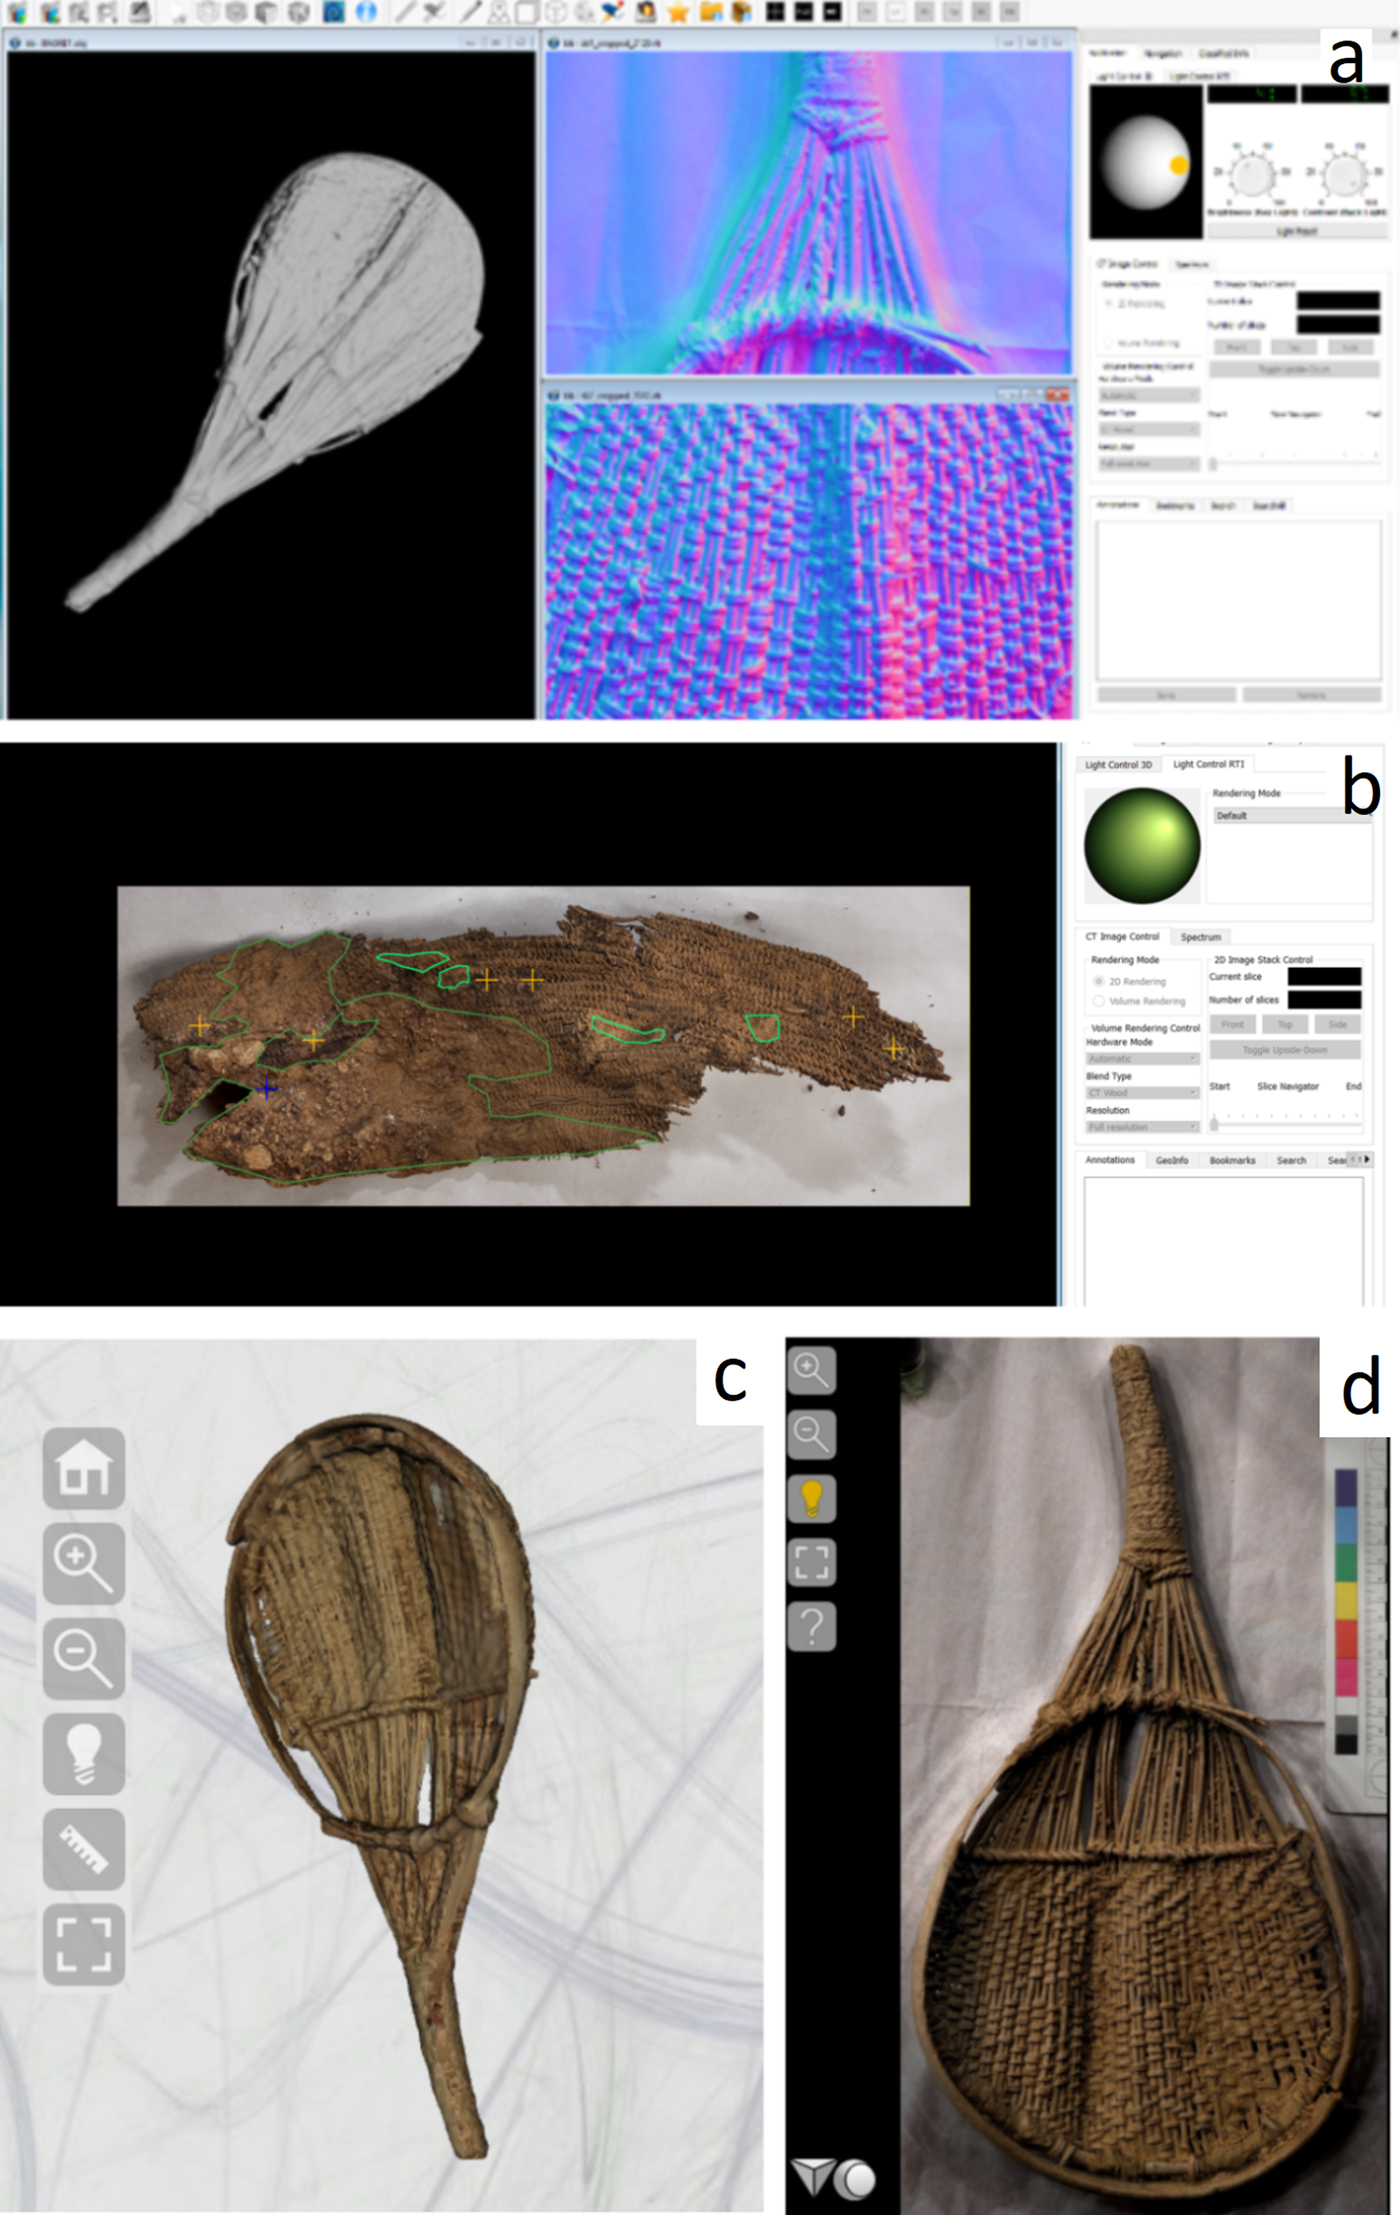
FIGURE 9. (a) CHER-Ob screenshot showing the comparative simultaneous analysis of seed beater (CC-15-1933) visualizations in 2-D and 3-D form. (b) Fully annotated RTI view of a basket: green outline shows depositions from the burial environment; yellow crosses indicate white colored depositions; blue crosses indicate damage. Web publication of seed beater (CC-15-1933): screenshots of (c) 3DHOP and (d) Web RTI.
These visualizations, along with the potential to access them online or within a combined virtual environment, encourage collaborations between scholars. They can facilitate dissemination to a wider audience, beyond the academic community, for outreach and education purposes. Community archaeology projects, such as the Scotland rock art (https://www.rockart.scot/) and the Re-Reading the British Memorial projects (https://www.york.ac.uk/digital-heritage/research/portfolio/rereading/), have used computer visualization tools. Mixed, augmented, and virtual reality are also increasingly being used, providing enhanced accessibility to sites like the Pleito Cave (https://www.youtube.com/watch?v=PJRHUcC0xa8; Cassidy et al. Reference Cassidy, Sim, Robinson and Gandy2018). Furthermore, visualizations assist in public engagement, and their online dissemination can motivate members of the public to become more involved in archaeological projects. For example, through the Unfolding Communities project (http://judaica-unsleben.de/; Kotoula et al. Reference Kotoula, Akoglu, Weiqi, Yang, Simon, Rushmeier, Greenop and Landorf2019), individuals gain insights into the intangible aspects of lost Jewish communities via sharing their family histories. A similar approach can be equally beneficial for the basketry material, involving the descendants of Chumash and remaining basket weavers. For those basket weavers, access to the digitized materials online might be useful for revitalizing weaving traditions and can provide actual support with tangible benefits. Computational photography, 3-D modeling, and online publication might become the vehicle or medium for the development of interactive collaborative relationships between Native American communities, the few remaining weavers, and archaeologists.
CONCLUSION
This study presented RTI and 3-D visualizations of recently excavated baskets from Cache Cave in southern California, as well as integration of data in CHER-Ob and online dissemination using Web RTI and 3DHOP. Results indicate that advanced computer visualizations are particularly useful for recording and documenting the state of preservation, such as deformations, distortions, depositions, discoloration, tears, and splits. Furthermore, 3-D in situ documentation provides valuable evidence for the appearance and characteristics of the basketry material at a point in time before any alteration or damage could occur during excavation, transportation, or storage. Additionally, the RTI and 3-D models provide useful information about the weaving pattern and decoration, enabling enhanced study of the sides, bases, and rims of baskets. The CHER-Ob software proposed for integration is not only the only available tool for simultaneous analysis of diverse data types but also is a powerful annotation tool that has proven useful for virtual visual analysis. The online dissemination tools used were particularly easy to use. Thus, RTI and photogrammetry basketry documentation, as well as further processing using 3-D modeling software and integrated analysis tools and then the transformation to a Web-based format for online dissemination, are useful additions for the study of basketry materials. No longer are we limited by our on-site interpretations of the artifacts in situ—which are temporally limited and inaccessible once the artifacts are removed. Instead, we become capable of continually revisiting our findings and questioning our presumptions based on new data and insights. Furthermore, we can share our findings and our interpretation simultaneously in publication.
Acknowledgments
We thank the Wildlands Conservancy, Dan York, and all the staff at the Wind Wolves Preserve for their permission and support for this work, as well as Sandra Hernandez, Colin Rambo, and the Tejon Indian Tribe. We also appreciate the assistance of John Johnson, Jan Timbrook, and Tacy Kennedy at the Santa Barbara Museum of Natural History. Our gratitude goes to Gloria Howatt-Brown, Josh Pugh, Colin Rosement, Jon Piccioulo, Dan McArthur, Allison Hill, Julie Bernard, Jennifer Perry, and Mathew Baker, as well as all the volunteers, students, and staff on the field project. The Arts and Humanities Research Council (AHRC) funded Unravelling the Gordian Knot: Integrating Advanced Portable Technologies into the Analysis of Rock-Art Superimposition (grant no. AH/M008894/1). Eleni Kotoula would like to thank the University of Lincoln, School of History and Heritage, for the support during the development of this study and Dr. Julieta Flores for the translation of the abstract.
Data Availability Statement
The dataset used in this study is stored in digital format and curated by the University of Central Lancashire in Preston, England. RTI visualizations, 3-D models, and videos are available online from the University of Central Lancashire repository at https://doi.org/10.17030/uclan.data.00000184. The ARIADNE platform used during the development of the study and the visualizations are available at:
• Cache Cave during excavation: https://visual.ariadne-infrastructure.eu/3d/cache
• CC-15-1933: https://visual.ariadne-infrastructure.edu/3d/seed_basket and https://visual.ariadne-infrastructure.eu/rti/basket_cc_15_1933.
• CC-14-1871: https://visual.ariadne-infrastructure.eu/rti/cc_14_1871
• CC-15-2134: https://visual.ariadne-infrastructure.eu/rti/basket_cc_15_2134_
• CC-12-140: https://visual.ariadne-infrastructure.eu/rti/basket-cc-12-140
• CC-12-657: https://visual.ariadne-infrastructure.eu/rti/basket-cc-12-657
• CC-12-374: https://visual.ariadne-infrastructure.eu/rti/basket-cc-12-374-1


 Open access