


Alberta is a Canadian province with diverse topography spanning 640,000 square kilometres and a population of 3,645,000. 1 Population density varies greatly. Two-thirds of the population resides in two major urban centres and the remainder in rural and smaller urban centres. 2 Stroke expertise is concentrated in the two comprehensive stroke centres (CSC) located in Edmonton and Calgary. There are 14 primary stroke centres (PSC) with thrombolysis protocols and telestroke access in placeReference Jeerakathil, Burridge, Thompson, Fang and Hill 3 strategically located throughout the province (Figure 1). In 2011, there were 6951 incident stroke cases 4 and approximately 36,000 stroke survivors in Alberta (Michael D. Hill, unpublished data, 2013).
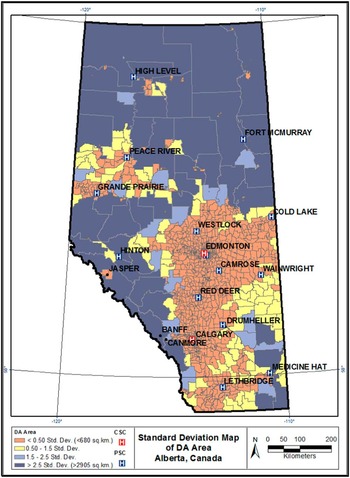
Figure 1 Standard deviation map of dissemination area size (km2).
Major advances have been made to the quality and delivery of specialized stroke care, but regional disparities in stroke incidence and mortality persist.Reference Sarti, Rastenyte, Zygimantas and Tuomilehto 5 , Reference Prabhakaran, Ward and John 6 Documenting existing trends and identifying the reason(s) for these variances is fundamental to the design of rational health care planning, distribution of resources, and program development.Reference Wennberg and Gittelsohn 7 Although regional disparities in stroke exist in Alberta,Reference Jeerakathil, Burridge, Thompson, Fang and Hill 3 an analysis of the spatial distribution of stroke types and mortality has not previously been undertaken, and the extent to which regional differences in risk factors for stroke are associated with any disparities has not been fully considered. How much geographic variation exists, where it exists, what populations are affected, and whether preventable regional disparities have been mitigated with targeted enhancements to stroke services are not known.
The aim of this investigation was to identify statistically significant geographic variances in the occurrence of major stroke types, in-hospital mortality (henceforth known as mortality) and known stroke risk factors using geographic information system (GIS)-based methods and administrative data sets in the province of Alberta.
Methods
Study Design
This study employed a spatial epidemiological approach using population-based administrative data, collected over six years, integrating GIS. GIS has been used increasingly as an evidence-based tool in epidemiological research,Reference Boulos 8 and in stroke research specifically.Reference Pedigo, Aldrich and Odoi 9 , Reference Han, Carrow, Rogerson and Munschauer 10 The study was approved by the Conjoint Health Research Ethics Board at the University of Calgary.
Data
Alberta, like other provinces in Canada, has a provincially administered government funded universal health care insurance system covering approximately 97% of permanent residents. Exceptions include Registered First Nations persons, prison inmates, and members of the military and the Royal Canadian Mounted Police, who have similar coverage federally. 11 All persons diagnosed with stroke who accessed the health care system in Alberta are included in the study database. Alberta inpatient discharge abstract data (Canadian Institute for Health Information [CIHI]-Discharge Abstract Database [DAD]) 12 and ambulatory care data (Ambulatory Care Classification System/National Ambulatory Care Reporting System) 13 that includes emergency department visits for fiscal years 2002-2003 to 2007-2008, inclusive, were linked and all personal identifiers removed. Subjects selected for inclusion had an International Statistical Classification of Diseases and Related Health Problems, 10th revision (ICD-10) 14 diagnosis of I63 (cerebral infarction), H34 (retinal arterial occlusion), I64 (stroke not specified as hemorrhage or infarction), I60 (subarachnoid hemorrhage [SAH]), I61 (intracerebral hemorrhage [ICH]), or G45 (transient ischemic attack [TIA]). I64 was coded with I63 and H34 as ischemic stroke based on the assumption that 87% of strokes are ischemic and 13% are hemorrhagic. 15 Patients younger than age 20-years were excluded from the analysis as mechanisms for stroke in children differ from those in adults. Patients without a health care number and/or valid Alberta postal code were also excluded.
A new stroke event was identified as follows. If multiple visits for the same patient occurred within 48 hours, the most serious event was selected (ICH > SAH > ischemic > TIA), If multiple visits within 48 hours were of the same stroke type, the first event was selected.
Known risk factors included in the analysis had an ICD-10 code of E10 (Insulin Dependent Diabetes Mellitus [DM]), E11-14 (Non-Insulin Dependent DM), I48 (atrial fibrillation), I10-I15 (hypertension), and E780, E781, E784, E785, E788, and E789 (hypercholesterolemia). These risk factors were identified from diagnosis codes reported in CIHI-DAD data (to 25 diagnostic occurrences).
Shapefiles for the spatial analysis including health care facilities, cities, and dissemination area (DA) and Alberta boundaries were obtained from Spatial and Numeric Data Services, University of Calgary. 16
Analysis
Administrative data were linked with Statistics Canada 2006 census population data and age-standardized rates, using 10-year age categories, were calculated using the direct method to preserve consistency for comparisons across geographic areas.Reference Lai, So and Chan 17 , Reference Beyer, Tiwari and Rushton 18 Ten-year age categories were chosen because they capture differences in age distributionReference Buescher 19 and are comparable to other epidemiological studies.Reference Klein and Schoenborn 20 No adjustment was made for sex to avoid spreading the data too thinly and because age generally has a much stronger impact on stroke incidence and mortality.Reference Buescher 19 The date of designation of a health care facility as PSC was not considered in this analysis. STATA/IC 12.1Reference StataCorp 21 software was used for the nonspatial portion of the analysis.
DA was selected as the geographic unit of analysis. DAs are small, relatively stable geographic units with a population of between 400 and 700 persons, 22 designed to be socioeconomically relatively homogeneous. Postal codes were used to identify rural and urban geographic areas. Depending on the definition, Canada’s rural population may vary between 22% and 38% of the total population (23% for postal codes).Reference du Plessis, Beshiri, Bollman and Clemenson 23 Postal codes were converted to latitude and longitude coordinates using the 2006 and 2011 Postal Code Conversion Files, 24 and data were imported into ArcGIS ArcMap 10. 25 Statistics Canada 2006 Census data were suppressed for 15 of 3757 DAs with stroke events because of reserve land, unreliable census data, or small population numbers (<100 persons for six-character postal codes 26 ).
Individual stroke events were aggregated according to DA. Annualized mean age-standardized stroke and mortality rates were calculated for each DA and used for the cluster analysis. DAs with suppressed data were assigned a rate of “0” for the cluster analysis if no strokes were reported during the six-year time span.
Data were projected in NAD83, 10-degree Transverse Mercator. 27 Two widely used spatial statistical methods, the Getis-Ord Gi* statistic in ArcGIS 28 and Spatial Scan statistic in SaTScanReference Kulldorff 29 were employed to identify “hot spots” and “cold spots” of stroke occurrence and mortality. High variances in rates can occur when using geographic units with small at-risk populations. For this reason, raw age-standardized rates using the direct method were smoothed using the spatial empirical Bayes smoothing technique (second-order queen weights) in GeoDaReference Anselin, Syabri and Kho 30 for the Getis-Ord Gi* analysis. Age-standardized rates using the indirect method were used for the Spatial Scan statistical analysis. Statistical significance for hot spots was set as DAs with a Gi* Z-score of >1.96, and Spatial Scan statistic relative risk (RR) >1.0 and p<0.05. Statistical significance for cold spots was defined as DAs with a Gi* Z-score <−1.96, and a Spatial Scan statistic RR<1.0 and p<0.05. A total of 999 Monte Carlo simulations were used to obtain p values for the Spatial Scan statistic. Proportions of stroke events with known risk factors for stroke were calculated for each DA and comparisons were made (1) within and external to the cluster boundary and (3) between hot and cold clusters.
Getis-Ord Gi* statistic. Distance band was selected as the method for conceptualization of spatial relationships because of the large variation in DA area. 31 A spatial weights matrix file was created using (1) a fixed distance band calculation, based on DAs with an area <2.58 SD (Figure 1), which reflected maximum spatial autocorrelation, 32 and (2) a minimum number of eight neighbours to ensure a reliable Z-score. 33
Spatial Scan statistic. A purely spatial, discrete Poisson model was used for this analysis. Clusters of high or low rates were scanned for simultaneously using a circular scanning window set to a maximum size of 40% based on the population of the largest DAReference Walsh and DeChello 34 and a size considered sufficiently large to ensure that potential small and large clusters could be included.Reference Kulldorff 29
Results
Ischemic stroke and TIA accounted for 86.8% of all strokes. Stroke types were evenly divided amongst men and women except for SAH, which occurred more often in women (62%). SAH also occurred at a younger age (56.7 years vs ischemic [73.2 years] and ICH [70.7 years]).
From 2002 to 2007, ICH rates decreased from 9.2% to 6.9% and SAH rates increased from 4.3% to 5.5% (Table 1). Over this time span, the proportion of the study population (by DA) with reported non–insulin-dependent DM, hypertension, and hypercholesterolemia increased. There was a trend to increased use of emergency medical services for transport, and a greater proportion of patients were transported to either a PSC or CSC by 2007. Mortality decreased from 13.4% in 2002 to 12.5% in 2007.
Table 1 Study population characteristics

* Postal code definition.
† Comprehensive stroke centre: computed tomography scan, tissue plasminogen activator, stroke team, neurosurgical/neuro-interventional expertise, acute stroke unit.
‡ Primary stroke centre: computed tomography scan, tissue plasminogen activator, stroke expertise onsite or available by telehealth, acute stroke care provision.
Median DA study population size was 410 persons (interquartile range 345, 525). Of 5357 DAs in Alberta, 3757 DAs reported ≥1 stroke event. A near-equal proportion of urban and rural DAs had rates of zero for ischemic stroke (~11%), ICH (~71%), SAH (~75%), and mortality (~57%). TIA was reported more frequently in rural DAs as having a rate of zero (48% vs 31%).
Statistically significant spatial clusters of stroke types and mortality are presented in Figure 2. Spatial mean centre, the point constructed from the average x and y coordinates for DA centroids 35 of the Gi* and Spatial Scan statistic “most-likely” clusters are plotted. Characteristics of confirmed clusters using the two methods are summarized in Table 2.
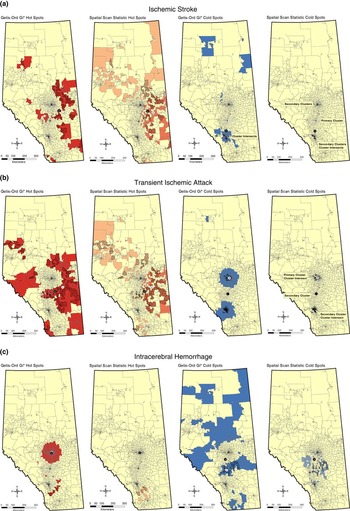
Figure 2 (Continued).

Figure 2 Hot and cold clusters of major stroke types and in-hospital mortality identified using Getis-Ord Gi* and Spatial Scan statistics.
Table 2 Dissemination area characteristics of Getis-Ord GiFootnote * and spatial scan statistic cluster intersects
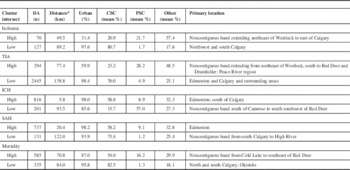
* Spatial mean distance: Euclidean or straight-line distance between Gi* and spatial scan most-likely cluster spatial mean centres.
A noncontiguous hot spot of ischemic stroke was located diagonally across the centre of the province in rural DAs northeast of Westlock extending southward to the east of Calgary (Figure 2A). TIA hot spots exhibited a similar spatial pattern (Figure 2B). Contrary to what would be expected from epidemiological data, ischemic stroke and TIA hot spots had DAs with lower proportions of all reported risk factors excluding insulin-dependent DM as compared with DAs external to cluster boundaries (Table 3). DAs within ischemic stroke and TIA cold spots had the highest levels of reported risk factors (Table 3).
ICH and SAH hot spots were identified in the northernmost of the two major urban centres (Figure 2C, D). DAs within the ICH and SAH hot spots had higher proportions of strokes with all reported risk factors excluding insulin-dependent DM as compared with DAs outside cluster boundaries (Table 3). ICH and SAH were the two stroke types with higher proportions of reported hypertension within hot spot boundaries.
A noncontiguous mortality hot spot was identified in east central Alberta in a similar geographic distribution to the hot spot for ischemic stroke (Figure 2E). DAs within the mortality hot spot had lower proportions of reported non–insulin-dependent DM and hypertension compared with DAs external to the cluster boundary. DAs within the mortality cold spot had higher proportions of atrial fibrillation, hypertension, and hypercholesterolemia compared with DAs external to the cluster boundary (Table 3). Within the mortality hot spot, CSC was less frequently the transport destination and non-stroke centre was more frequently the transport destination (eTable 1, eTable 2).
A cluster analysis of risk factors identified hot spots in the two large urban centres with CSCs (Calgary: RR 2.59, p<0.001; Edmonton: RR 2.43, p<0.001) and one of the urban primary stroke centress (Medicine Hat: p<0.05) (Figure 3). There was an inverse relationship between risk factor hot spots and hot spots for ischemic stroke, TIA, and mortality (Figure 3, Table 3).

Figure 3 A cluster analysis of DA proportions of stroke events with one or more reported risk factors.
Table 3 High and low stroke and in-hospital mortality cluster intersects and Dissemination Area proportion of stroke events with risk factor(s).
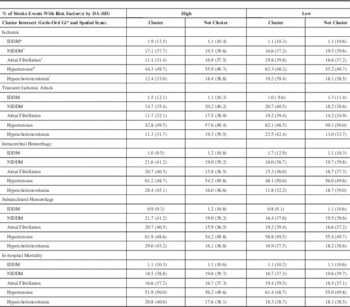
* IDDM - ICD-10 Code E10.
† NIDDM – ICD-10 Codes E11-E14.
‡ Atrial Fibrillation – ICD-10 Code I48.
§ Hypertension – ICD-10 Codes I10-I15.
ǁ Hypercholesterolemia – ICD-10 Codes E780, E781, E784, E785, E788, E789.
Discussion
Significant hot and cold spots of stroke types and mortality were identified (Figure 2). There was overlap of clusters across statistical methods and, in relation to the geographical expanse of the province, spatial mean centres of hot spots calculated for each statistic were not far apart in distance (Table 2).
Ischemic Stroke and TIA
DAs within ischemic stroke and TIA hot spots had lower proportions of all reported risk factors excluding insulin-dependent DM compared with DAs outside of the hot spot and DAs within cold spots (Table 3). This is contrary to the established link between stroke risk factors and stroke occurrence.Reference Lackland, Roccella and Deutsch 36 The most likely explanation is a lower incidence of recognition and reporting of stroke risk factors in these clusters with high rates of ischemic stroke and TIA. Furthermore, the high rates of reported stroke risk factors in cold spots for ischemic stroke and TIA suggests a strong and potentially causal link between recognition and reporting of stroke risk factors and occurrence of ischemic stroke and TIA. These findings serve to emphasize the importance of primary prevention. Clusters with lower proportions of reported risk factors may be indicative of populations with decreased access to primary care and/or that are less amenable to seeking and receiving preventive care. Forty percent of TIAs have magnetic resonance imaging evidence of infarction,Reference Kidwell, Alger and Di Salle 37 and differences in access to magnetic resonance imaging and extent of investigation as well as urban–rural differences in the coding accuracy of TIA versus ischemic strokeReference Kokotailo and Hill 38 may partially explain the urban bias for TIA cold spots located in Edmonton and Calgary (Figure 2B).
ICH and SAH
ICH and SAH were the two major stroke types in which clusters of high rates had higher reported risk factors. ICH and SAH hot spots had DA populations with higher proportions of all reported risk factors excluding IDDM compared with DAs outside of cluster boundaries (Table 3). Underdiagnosis or subtherapeutic treatment of hypertension in this region may be important factors in addition to risk factors unaccounted for in the analysis. Data relating to incidence of smoking, a major risk factor for SAH, were not available.
Mortality
DAs within the mortality hot spot had lower proportions of reported non–insulin-dependent DM, atrial fibrillation, and hypertension and higher proportions of hypercholesterolemia (Table 3). There was a higher occurrence of ischemic stroke, ICH, and SAH within the Spatial Scan “most-likely” high clusters (eTable 1). This finding raises questions regarding access to and efficacy of primary and secondary prevention programs and in-hospital stroke care in this region. Transport destination may have contributed to this finding as mortality hot spots had lower proportions of events transported to a CSC and a higher proportion of events transported to a nondesignated stroke centre (eTable 2). Time from symptom onset to recanalization 39 - Reference Mazighi, Serfaty and Labreuche 41 and specialized stroke care 42 are crucial factors in morbidity and mortality after stroke. Prolonged transport times, suboptimal transport destination,Reference Prabhakaran, Ward and John 6 , Reference Schwamm, Pancioli and Acker 43 quality of care issues (i.e. percentage receiving tissue plasminogen activator), or other unmeasured differences in stroke systems of care could account for mortality hot spots. Stroke severity, an important risk factor for mortality after stroke, could not be assessed because of a lack of clinical data.
Risk Factors
Hot spots of risk factors were identified and located in Calgary, Edmonton, and Medicine Hat (Figure 3). These cities have well-established stroke prevention programs in place. This supports findings stemming from the cluster analyses of stroke types and mortality suggesting that identification and reporting of risk factors is positively associated with significantly lower ischemic stroke and TIA occurrence and mortality. Spatial patterns may be related to differing risk distributions, regional differences in the coding of risk factors, or the type and quality of care that is associated with having a reported risk factor. Risk factors appeared to be less important in the spatial distribution of ICH and SAH.
This study highlights the power of using GIS to understand statistically significant regional variability in stroke occurrence, risk factors, and outcomes. These types of analyses can be particularly useful in identifying gaps in service, in planning and evaluation of health systems and health care delivery, and in (re)allocation of resources.Reference Wennberg and Gittelsohn 7 Strengths of this research study include that spatial analyses were performed by stroke type and that clusters were confirmed using two statistical methods. A broad regional analysis was conducted, but the geographic unit of analysis was sufficiently small to permit a more refined delineation of cluster boundaries and a later, more detailed examination of explanatory variables including local population characteristics and geography using linked census data and shape files. A polygon analysis removed spatial autocorrelation of events because of underlying population density. The small numbers problem resulted in greater variation of rates in DAs with smaller populations, but this was mitigated by a spatial smoothing technique and, in areas of overlap, by the use of the Spatial Scan statistic. Findings were validated in that ischemic stroke and TIA had similar geographical distributions and that risk factor hot spots were located in regions with well-established stroke prevention programs and acute care service provision in place.
Potential limitations of this study include those associated with the use of administrative data: (1) lack of clinical detail, (2) regional differences with ICD-10 coding of stroke type, (3) regional differences in reporting of risk factors, 44 (4) inaccurate documentation of postal codes, and (5) errors associated with the collection of Statistics Canada census data including under- or overcoverage of specific populations. 45 Although the consistency for diagnosis typing for the most responsible diagnosis in CIHI-DAD data is high, the consistency for diagnosis typing of pre- and post-admit comorbidities is lower. 45 In Alberta, coding of atrial fibrillation, DM, and hypertension was found to have a higher degree of accuracy compared to coding of hyperlipidemia.Reference Kokotailo and Hill 38 An important potential limitation is that the postal code documented on the clinical health record may not accurately represent location of residence, location of stroke, or risk exposure. Residential mobility was not taken into account. Limitations associated with the spatial data analysis include: (1) position error, (2) DAs limited capacity to reveal what is happening in rural areas, (3) the modifiable areal unit problem (rate changes with change in geographic units), (4) the small numbers problem (greater variability in rate estimates), and (5) ecological and atomistic fallacy. It remains a useful but high-level tool for evaluation of disease incidence and outcomes.
Summary
Using whole population administrative data for a large geographic region of Canada integrated with GIS, this study identified significant regional variations in ischemic stroke, TIA, ICH, SAH and in-hospital mortality. Risk factor hot spots were identified in regions with significantly low ischemic, TIA, and in-hospital mortality rates. ICH and SAH did not have this same inverse association. Further studies using logistic and spatial regression techniques investigating associations between stroke and mortality hot spots that incorporate novel sociodemographic, environmental, and geographic (e.g. proximity to specialized care) predictors will inform public health policy with respect to the targeting of risk reduction strategies; enhancements to the provision of preventive stroke care, pre- and in-hospital (hyper)acute stroke care, and the future location of stroke centres.
Acknowledgements and Funding
We gratefully acknowledge support by Peter Peller, Head, Spatial Data and Numeric Services, University of Calgary and Vicki Stagg, Statistical Programmer, University of Calgary. This study was partly funded by the Heart & Stroke Foundation and the Hotchkiss Brain Institute.
Disclosures
SvR, TWJW, and MDH have nothing to disclose. SA is an employee at the University of Calgary.
Statement of Authorship
SvR wrote the primary manuscript, designed the study, obtained data, and conducted the analysis. TWJW, SA, and MDH provided help with elements of the study and provided critical revisions to the final manuscript.
Supplementary Material
To view supplementary material for this article, please visit http://dx.doi.org/10.1017/cjn.2015.241


