


Nutrition labelling is increasingly considered an important component of comprehensive strategies to tackle unhealthy diets and associated non-communicable diseases (NCD)( 1 ). Globally, NCD are the leading cause of death, killing more people each year than all other causes combined( 2 ). In South Africa (SA), according to the WHO, the probability of dying between the ages of 30 and 70 years from the four main NCD is 27 %( 3 ) and on the increase( 4 ). The prevalence of NCD risk factors such as overweight and obesity is unacceptably high, with 68 % of women and 31 % of men being overweight or obese, while 46 % of women and 44 % of men are hypertensive( 5 ).
In response to these increasing NCD rates, the South African Government implemented the Strategic Plan for the Prevention and Control of Non-Communicable Diseases 2013–2017( 6 ). To support this national strategy, new interim labelling regulations were published in 2010, coming into effect in 2012( 7 ). In 2014, amendments to this legislation were published for comments. The new legislation, which has not come into effect to date, includes regulations on various nutrition and health claims based on nutrient profiling( 8 ).
Nutrient profiling is the ‘science of classifying or ranking foods according to their nutritional composition for reasons related to preventing disease and promoting health’( Reference Rayner, Scarborough and Stockley 9 ). It has various applications, including testing of nutrient and/or health claims as well as product health-endorsement logos (HEL) or symbols as part of front-of-pack labelling( 10 ). In SA, the use of a slightly modified version of the Australian and New Zealand (Food Standards Australia New Zealand’s) nutrient profiling model (based on the UK Ofcom model) has been recommended as a screening or first test to determine the eligibility of food items to carry a nutrient and/or health claim( Reference Wicks 11 ).
In response to the publication of the new proposed labelling regulations and research showing that consumers prefer simple, less complex nutrition information on food labels( Reference Campos, Doxey and Hammond 12 ), an opportunity arose for developing a front-of-pack label using a single HEL. This single HEL could be used on food products to indicate healthy choices based on the South African nutrient profile model.
Although there is currently little evidence documented on the actual development process of HEL suitable for and acceptable to the consumer, from the available literature it is clear that the process should be systematic, transparent and involve all relevant role players, including leaders from academia, public health professionals, government, industry and consumers( Reference Lupton, Balentine and Black 13 , Reference Vyth, Steenhuis and Mallant 14 ). The Choices Programme from the Netherlands is an example of a scheme that uses HEL implemented in 2006( 15 ).
To determine the need for the development of such a logo, research was conducted with consumers from Cape Town, SA, as phase one of the present multiphase, mixed-methods study. Research conducted in SA in recent years has shown that many consumers do not read the nutrition information on food labels( Reference Jacobs, de Beer and Larney 16 , Reference Bosman, van der Merwe and Ellis 17 ). In phase one of the present study, 64 % of consumers who participated in the interviewer-administered electronic survey on food and nutrition labelling indicated that they sometimes, seldom or never read the nutrition information on food labels. Consumers indicated that they struggle to interpret the nutrition information table and 67 % indicated that they would prefer a label with less complex terminology. Six out of ten consumers said that they would prefer a single HEL to be used on all food products, as some indicated that they struggle to interpret the various approved HEL currently used on food labels in SA, suggesting that a single HEL could be a more effective approach( Reference Koen, Wentzel-Viljoen and Nel 18 ).
The objectives of the research were to explore what type of HEL are preferred and why; to make recommendations to an independent logo design company for the design of HEL for products that are healthier choices based on the South African nutrient profile model; to use experts to identify the most suitable logos; and to pilot field-test these logos to determine their acceptability and comprehension. In addition, the field-tested HEL were to be recommended to the Department of Health (Directorates: Nutrition, NCDs, Health Promotion and Food Control) to consider for implementation after further testing in the different provinces of SA.
Materials and methods
The present study was conducted within a multistage mixed-methods framework using an exploratory sequential approach. Data were collected in three phases, using quantitative and qualitative research methods. During phase one, quantitative data were collected by means of an interviewer-administered electronic survey to determine the use of HEL and to assess the need for a single HEL to be used in SA. In phase two, qualitative data were collected using focus group discussions (FGD) to further explore the need for a single HEL and to determine consumer preferences in terms of logo design and comprehension. In phase three, HEL were developed, followed by an evaluation of the logos by a group of experts. The lowest-scoring logos were eliminated during two rounds of scoring, using a modified Delphi technique. The remaining, highest-scoring HEL were then evaluated during FGD with consumers. Figure 1 provides a flowchart illustrating the research process. For the purposes of the present paper, data from phases two and three are reported. Written informed consent was obtained from all consumers who participated in the study.
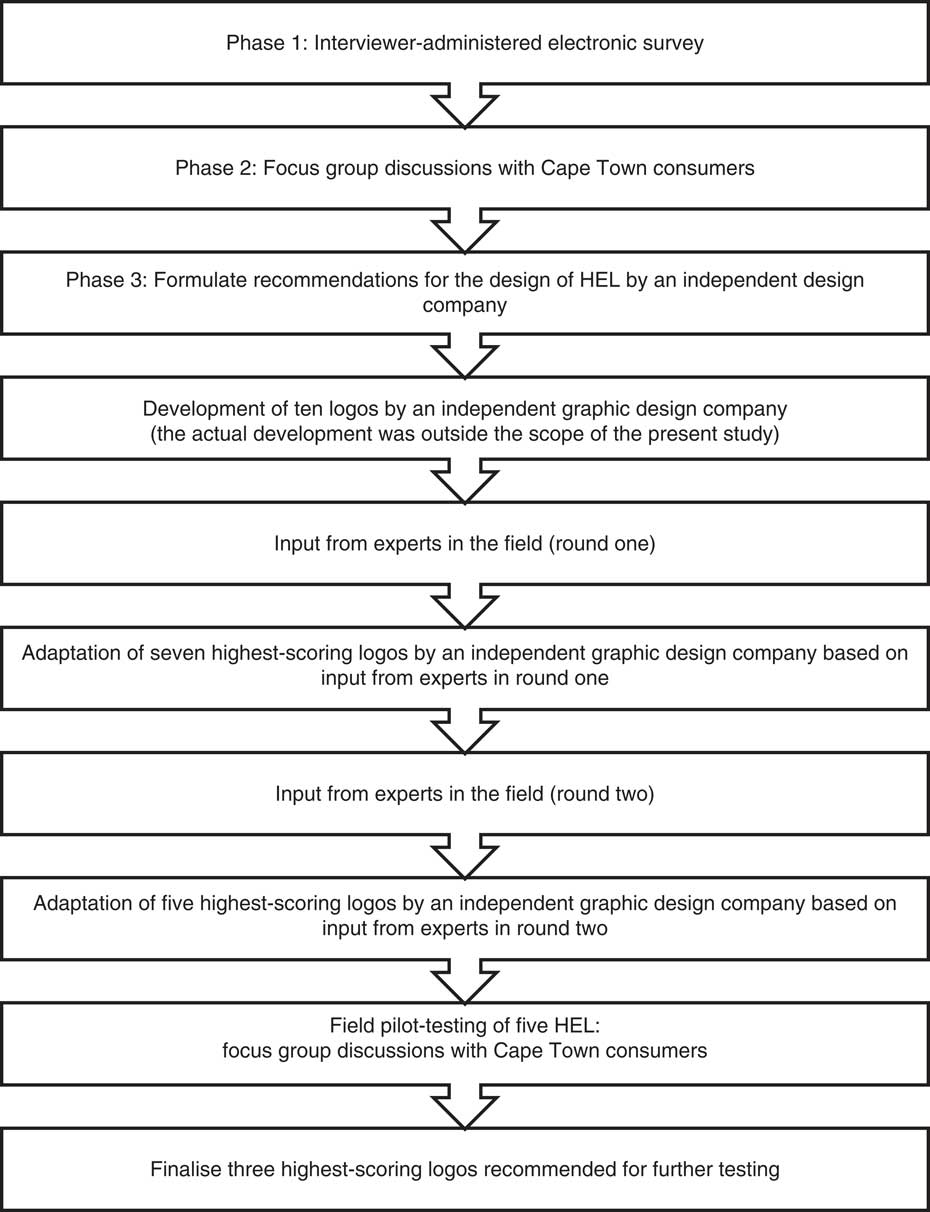
Fig. 1 Research process for the development and pilot testing of health-endorsement logos (HEL)
Sample selection: interviewer-administered survey (phase one) and focus group discussions (phases two and three)
Study participants for phases one to three consisted of literate (completed grade 7), adult consumers (≥18 years) who were their households’ primary food purchasers (doing >50 % of the food shopping for the household) and did their grocery shopping at selected grocery stores in Cape Town, Western Cape, SA. Only the primary food purchaser was included to ensure that all participants, on a regular basis, came into contact with food labels and made decisions on what food items to buy for the household. Only literate consumers were included as the City of Cape Town has one of the highest literacy rates in SA, with approximately 90·1 % of adults (aged ≥20 years) having completed primary school( 19 ). The literacy rate is 10 % higher than that of SA (79·2 % for adults aged ≥20 years) according to the 2011 census( 20 ). Additionally, consumers were required to read label information on an actual food label in phase one.
Sample selection: experts (phase three)
The group of experts consisted of experts in the field of nutrition, food science and food labelling from both the private and public sector in SA (including academia, government and industry) who agreed to participate in the study and who were willing to sign a confidentiality agreement.
Methods of data collection
During phase one, conducted during February and March 2016, 960 participants were recruited to participate in an interviewer-administered survey from sixteen grocery stores (from the four main food retailers in SA which include Shoprite/Checkers. Pick ‘n Pay, Woolworths Food and Spar) located within four of the eight health districts of Cape Town, SA. These four health districts were selected for data collection using purposive sampling. Districts with a better distribution between the three main ethnic groups (compared with other districts where some ethnic groups are poorly represented) were selected for the study, namely Eastern, Northern, Southern and Western. The three main ethnic groups (black African, mixed race and white) constitute 96·7 % of the total population in the city( 21 ). One store per retailer per health district was randomly selected. Data were collected at each grocery store over the course of six days including one weekend day. Consumers who met the inclusion criteria were approached to take part in the research study as they exited the grocery store on the day of data collection. The survey, taking approximately 20 min to complete, was conducted by five trained interviewers in a quiet area outside the store (detailed information on the sampling of the grocery stores and participants for phase one is given elsewhere)( Reference Koen, Wentzel-Viljoen and Nel 18 ).
Participants who participated in the interviewer-administered electronic survey during phase one were approached for participation in FGD during phase two conducted during May and June 2016. Participants were selected by means of purposive sampling according to their education level, language preference, the health district where they were recruited from in phase one, and whether they read the nutrition information provided on food labels. FGD were conducted in either Afrikaans or English. The option to conduct the FGD in isiXhosa was available; however, all participants indicated English or Afrikaans as their language of preference. This may be due to the inclusion criteria of the phase-one survey, which only included participants who could read and understand English. The FGD were conducted by two standardised and trained facilitators, one of whom was the first author (N.K.), and a trained focus-group observer who made notes regarding participant interaction and non-verbal cues. Both facilitators and the focus-group observer were female, registered dietitians, proficient in both English and Afrikaans, and trained in qualitative research methods (detailed information on the sampling of participants and method of data collection for phase two is described elsewhere; N Koen, E Wentzel-Viljoen and R Blaauw, unpublished results).
To provide guidance and make recommendations for the design of new HEL, participants were asked during the FGD to comment on the overall design, use of colours, symbols, wording, and their understanding of existing international and South African HEL. The focus-group recordings were transcribed and content analysis was performed using deductive reasoning processes. A summary of the findings was provided to an independent graphic design company, consisting of a team of nine graphic designers, situated in the Western Cape, SA, who then designed ten HEL after a meeting with the researcher where the background to the study was provided.
To evaluate the design of the logos and to eliminate five of the HEL, twenty-three experts were identified and contacted to participate in two rounds of scoring and evaluating the logos in September 2016. A modified Delphi technique was employed for this purpose, as it is a flexible approach( Reference Hasson, Keeney and McKenna 22 ) that brings together and synthesises the knowledge of a group of geographically scattered participants( Reference Adler and Ziglio 23 ). Nineteen experts agreed to take part. Four declined, owing to other commitments. After signing the confidentiality agreement, the experts were provided with the protocol synopsis for background information and information on the process to be followed during the rounds of scoring. They were also informed that all communication would be conducted via email. During all communication, the experts were blind copied (bcc’d) to ensure anonymity of the experts.
In round one, the ten logo designs were sent to the experts to score and make recommendations to improve the design. The experts were also provided with the same summary (feedback from phase-two FGD) compiled for the graphic design company. Experts were asked to complete a scoring sheet with space for comments on the design of each logo. After round one, the three lowest-scoring HEL were eliminated and the comments summarised for the graphic design company to improve the design of the remaining seven logos.
In round two, the remaining seven logos, with improved designs, were once again sent to the experts to score and make recommendations to further improve the design. The experts were provided with the summary of feedback and scores from round one. Experts were asked to complete a similar scoring sheet as used in round one with space for comments on the design of each logo.
After completing the second round of scoring and commenting, experts were thanked for their participation. The two-lowest scoring HEL were eliminated and the comments summarised for the graphic design company to improve the design of the five remaining logos.
For the pilot testing of HEL in phase three, participants who participated in the interviewer-administered survey during phase one and/or the FGD during phase two were approached for participation in FGD in October 2016. Participants were selected by means of purposive sampling according to their education level, the health district that they were recruited from in phase one and their language preference. FGD were arranged with fifteen participants to allow for participants cancelling at the last minute.
FGD were conducted in Afrikaans or English by a focus-group facilitator (N.K.) and a focus-group observer (the same focus-group observer used in phase two), who made notes regarding participant interaction and non-verbal cues. All FGD were conducted at public libraries located in each of the four health districts where the original survey was conducted. The library chosen for each of the FGD was private, comfortable, safe, free from disturbances and conveniently located for the participants. Refreshments were served upon arrival of participants. Prior to starting the group discussion, the facilitator opened the discussion by welcoming the group and giving participants the opportunity to introduce themselves. The facilitator provided an overview of the topic, outlining the ground rules for the discussion (also in terms of confidentiality) and explaining the role of the observer and the recorder. Written, informed consent was obtained from all participants as well as consent to record the discussion. A copy of the consent form was given to each participant.
Participants completed a short one-page demographic questionnaire and then the discussion commenced. No language barriers were experienced during any of the FGD.
The facilitator used a discussion guide that was developed based on the research objectives of the study. The discussion guide consisted of two themes: ranking of HEL and a discussion of each of the five logos. First, participants were requested to rank the logos (5=‘like the best’ to 1=‘like the least’) according to their personal preference, using a scoring sheet. Logos could not receive the same ranking, thereby forcing participants to rank the five logos according to their preference. This was done individually, and participants were requested not to talk during this exercise. After completing the ranking of the logos, the discussion of each logo commenced. Box 1 provides a summary of the questions posed with respect to each logo.
Box 1 Questions posed during focus group discussions with respect to each logo
∙ Please give your general impression of the logo? ∙ Do you like the design of the logo? Why do you like/dislike the design? ∙ How do you feel about the colours and fonts that were used? ∙ In general, is the logo attractive to you? Please explain. ∙ Is the picture/symbol used in the logo acceptable? Please elaborate. ∙ If you were to look at the logo for the first time on a product, what would you understand about this specific logo?
Participants were compensated with a food voucher for their time and travel expenses. All FGD lasted between 45 and 60 min.
All personal identifiers were removed from the audio recordings before the transcription of the discussions and participant details were kept separate from the audio recordings at all times. The audio recordings of the FGD were transcribed verbatim by an independent company specialising in transcription services. After the FGD were transcribed, the researcher (N.K.) performed quality control on the data to ensure that information was captured accurately. The transcriptions were then entered into a text-analysing computer program (Atlas.ti version 7). The researcher went through the transcripts systematically while applying a process of open coding to the text. The researcher made notes of the main themes that could be established around the key concepts explored in the FGD. The analysis can therefore be described as deductive (pre-prepared structure).
Data from the short demographic survey and the scoring of the HEL were captured using Microsoft® Excel 2013 and summary statistics were used to describe the variables.
Results and discussion
Background information of participants
Table 1 provides a summary of the demographic information of participants who participated in the FGD in phases two and three. Most participants who took part in phases two (79·2 %) and three (88·9 %) were female and had a total household monthly income of less than R6400 (53·7 % in phase two and 77·8 % in phase three). More than half (56·7 % in phase two and 58·3 % in phase three) were of mixed race and the majority (76·1 % in phase two and 91·7 % in phase three) were either Afrikaans- or English-speaking. The demographic profile of participants was not representative of the City of Cape Town. Taking into consideration the exploratory, qualitative nature of phases two and three, generalisation of findings would be inappropriate.
Table 1 Demographic profile of focus group participants from phases two and three: adult consumers (≥18 years), Cape Town, South Africa, May–June 2016 (phase two) and October 2016 (phase three)
Findings from phase-two focus group discussions
Findings from the nine FGD conducted in phase two are discussed according to different themes. The first theme relates to participants’ perceptions towards the use of a single HEL to be used for healthy food choices based on the South African nutrient profile model. The second theme relates to the expectations and preferences of participants regarding the design of a HEL, including the use of colour, symbols, wording, comprehension and overall design.
Theme 1: Exploring the perceptions of participants regarding the use of a single health-endorsement logo
Participants were positive about the use of a single HEL on food labels in SA, while many said that they would prefer only one logo to be used. When asked why they would prefer a single logo, participant responses varied. Some indicated that it would simplify the label and reduce the amount of information on the front of the package as the information provided can be overwhelming. Many felt that it would make the label less confusing:
‘There are too many different logos and symbols on the packaging – I don’t even know where to look.’
This is justified, as there are currently a substantial number of HEL approved by the Director-General of the Department of Health, SA, that may be used on food labels. Some South African food labels contain up to five logos or symbols on one food label. This was an issue for many participants, as they felt that they did not always understand the meaning of all the logos. It was also clear that some logos were completely misunderstood, for example the Cancer Association of South Africa (CANSA) logo:
‘I don’t buy products with the CANSA logo because I don’t have cancer.’
Participants said that they struggled to understand the nutrition information on food labels, especially the information provided in the nutrition information table. Reading and interpreting this information can also be time consuming. Participants felt that the presence of a single HEL would make selecting a healthy product easier:
‘I don’t understand all the numbers and detail at the back, so I just ignore it. But if there was a logo on the front that told me something is healthy … and I know I can trust it, then I would buy it. It is important for me that I buy healthy food for my family, but I really struggle with all the [nutrition] information.’
These findings are similar to those of several other studies that have reported food labels using graphics and symbols to convey the health properties of a product to be more effective than the traditional nutrition information table( Reference Lewis and Yetley 24 , Reference Marino and Mahan 25 ). Well-recognised HEL( Reference Feunekes, Gortemaker and Willems 26 ) and traffic light symbols have been found to be particularly effective( Reference Kelly, Hughes and Chapman 27 ).
Participants expressed the need for more consumer education in the form of media campaigns, as well as education in schools, to create more awareness for HEL and to communicate the meaning of such logos. This will assist them in recognising the logo and understanding its intent. Research has shown that the success of a labelling scheme that uses HEL is dependent on media campaigns to communicate the meaning of the logo to the public and through communication campaigns implemented during the first year the logo is introduced( Reference Vyth, Steenhuis and Mallant 14 ).
There were a few participants who had some concerns about the use of a single HEL on all food products. Participants who knew and trusted existing HEL, such as the Heart and Stroke Foundation South Africa and the Glycaemic Index Foundation South Africa logos, were worried that these logos would be removed from food products and that they would have to ‘get to know a new logo all over again’. A few participants were also concerned about the specific criteria that would be used to determine whether a product would qualify to carry such a logo, ‘who would be responsible to police’ this process and whether these food products would be more expensive if they carried the logo. This emphasises once again the need for continuous consumer education if such a logo were implemented, to address consumer fears and concerns and to ensure consumer understanding of the meaning of the logo.
Theme 2: Participants’ expectations of and preferences for the design of health-endorsement logos
During the discussions, participants were given examples of existing national and international HEL, to elicit a discussion on their preferences and expectations in terms of overall design, the use of colours and symbols, specific wording, and their general understanding of these logos.
In terms of overall design, it was clear from the discussions that participants would prefer a simple, easy-to-understand logo. The logo should attract their attention and should be easy to identify on a ‘busy’ food label. A study conducted by Becker et al. found that front-of-pack labels are particularly effective when using colours and designs that draw attention, and that this occurred even when consumers did not have a nutritional goal, thus reaching a larger segment of consumers( Reference Becker, Bello and Sundar 28 ).
The majority of participants indicated that the logo should include wording related to health such as ‘healthy choice’, ‘healthier choice’, ‘better choice’ or ‘best choice’, in English, although the symbol or picture on the logo should also relate to health, nutrition or a healthy lifestyle. A few individuals did indicate that they would prefer the logo in more than one of the official South African languages, although they did agree that this would be difficult since SA has eleven official languages. The size of the font should be large enough to read easily, while the font itself should be ‘simple’ or ‘plain’. This is in line with previous research conducted in SA and internationally where the size of the font used on food labels has been reported as a barrier to reading nutrition information, with consumers preferring larger, more legible fonts( Reference Campos, Doxey and Hammond 12 , Reference Jacobs, de Beer and Larney 16 , Reference Koen, Wentzel-Viljoen and Nel 18 ).
Participants preferred bold colours such as green, orange, red and blue, while dull and neon colours were disliked by many as they were seen as ‘artificial’.
Results from phase three: scoring, improving and elimination of health-endorsement logos
Based on the feedback received during the FGD in phase two, a comprehensive summary was compiled for the independent graphic design company for the design of ten HEL. These designs are shown in Fig. 2.
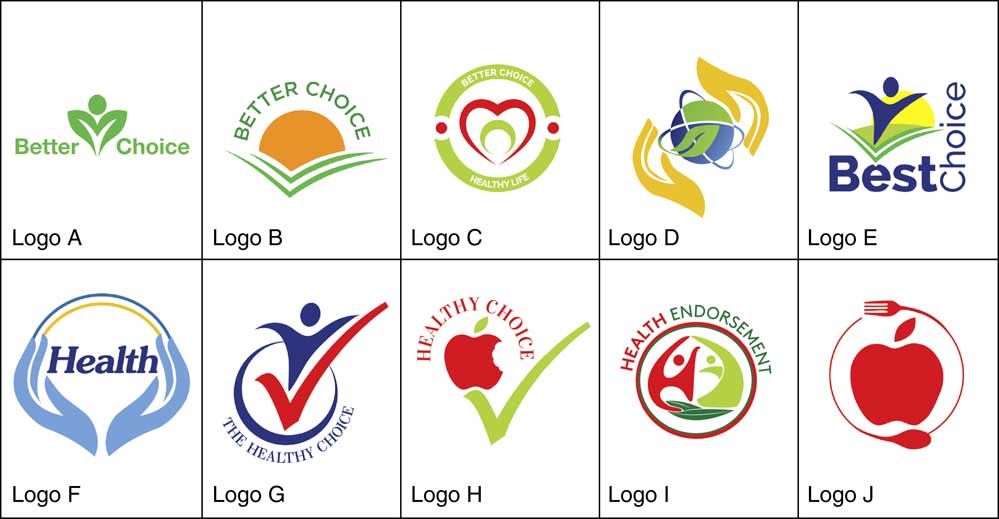
Fig. 2 (colour online) Health-endorsement logo designs based on feedback from the phase-two focus group discussions
These designs were given to the nineteen experts to score based on the following criteria (weighted according to importance as determined by the researchers): overall design (30 %), consumer understanding (30 %), use of colours (20 %) and use of symbols/wording (20 %). Overall design and consumer understanding were considered the most important aspects of a HEL as it was considered crucial that consumers should understand the message the logo intends to convey, without any prior exposure to the logo.
The scores for the ten HEL are shown in Fig. 3. The scores were determined by calculating the mean score for each criterion (overall design; consumer understanding; use of colour; use of symbols/wording) and then calculating the total score, where each criterion contributed a specific weight to the final score. During round one of scoring, the three-lowest scoring logo designs (logos D, I and J) were eliminated, based on the calculated total scores.
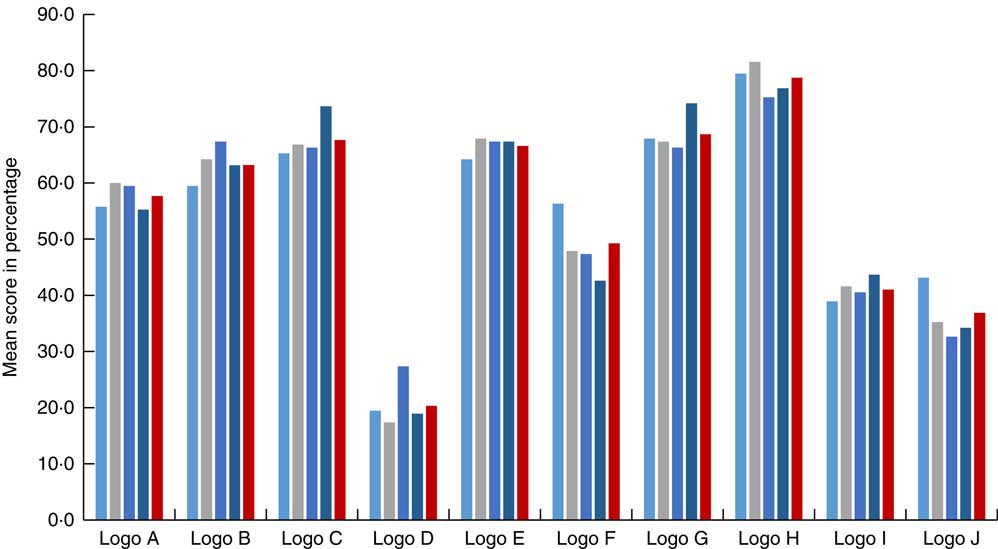
Fig. 3 (colour online) Round-one scoring of health-endorsement logos by the group of experts according to predefined criteria (![]() , overall design;
, overall design; ![]() , consumer understanding;
, consumer understanding; ![]() , use of colour;
, use of colour; ![]() , use of symbols/wording;
, use of symbols/wording; ![]() , total score)
, total score)
Experts were also given the opportunity to comment on the overall design, consumer understanding, use of colours, use of symbols and/or wording of each logo. From these comments, a comprehensive summary was compiled for the graphic design company to improve the designs of the seven remaining logos. All comments were included in the summary, although if several comments were made that eluded to the same suggestion, it was only stated once. Comments were not included if it contradicted the current labelling legislation. The improved/adapted designs are shown in Fig. 4.
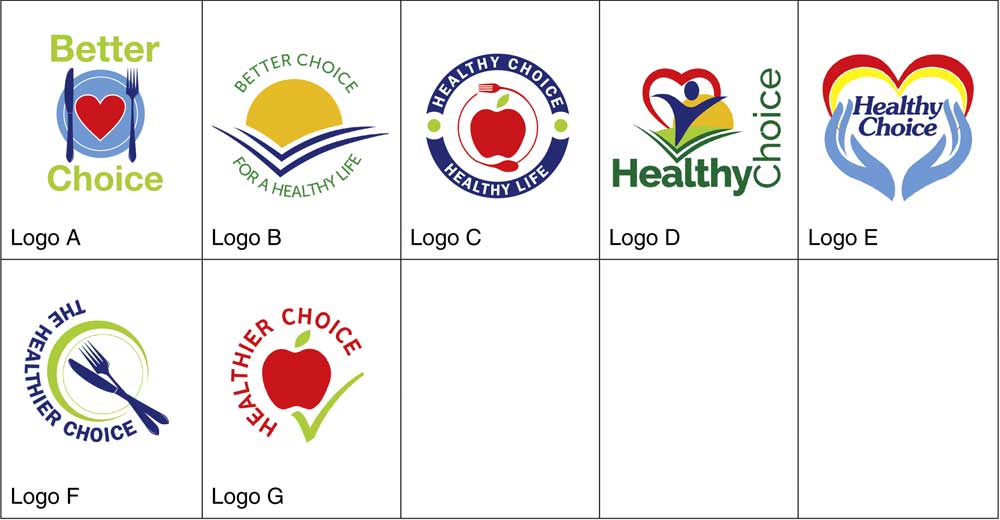
Fig. 4 (colour online) Health-endorsement logos re-designed based on expert panel feedback provided in round one
During round two of scoring, logos were scored according to the same criteria as in round one and once again weighted according to importance. The scores for the seven HEL are shown in Fig. 5. During this round, a further two logo designs were eliminated (logos B and E) based on the calculated total scores. Experts were then given a final opportunity to comment on the overall design, consumer understanding, use of colours and symbols, and/or wording of each of the remaining five logos.
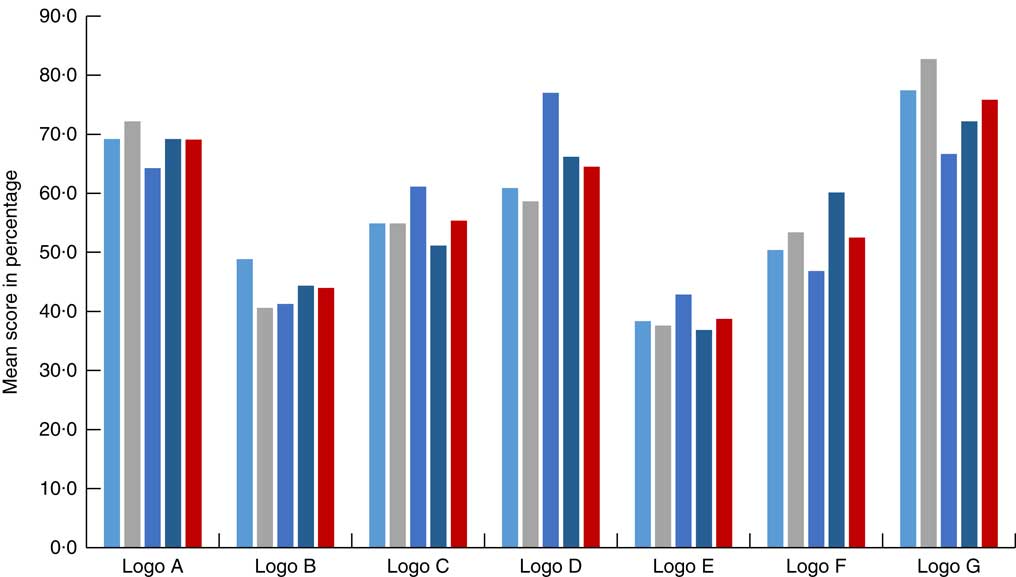
Fig. 5 (colour online) Round-two scoring of health-endorsement logos by the group of experts according to predefined criteria (![]() , overall design;
, overall design; ![]() , consumer understanding;
, consumer understanding; ![]() , use of colour;
, use of colour; ![]() , use of symbols/wording;
, use of symbols/wording; ![]() , total score)
, total score)
From these comments, a comprehensive summary was compiled for the graphic design company to improve the designs of the five remaining logos to be pilot tested in FGD with consumers. The improved/adapted designs are shown in Fig. 6.
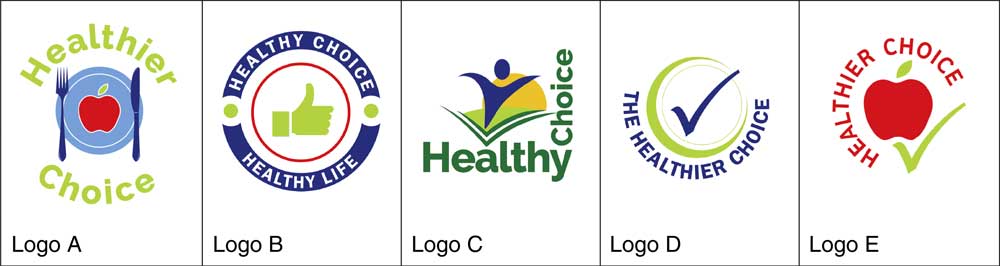
Fig. 6 (colour online) Health-endorsement logos re-designed based on expert panel feedback provided in round two
Results from phase three: pilot testing of health-endorsement logos
Participants were asked to rank the five HEL according to their preference. The overall rankings for each of the five HEL are shown in Fig. 7. The three logos that received the highest overall ranking were logos A (3·28/5), C (3·39/5) and E (3·08/5). A statistically significant difference was found between logos C and D (P=0·03).
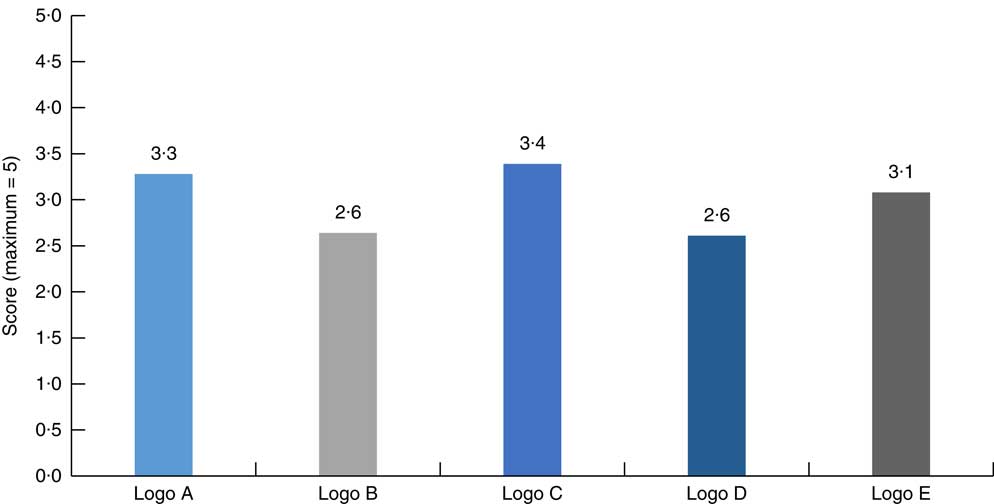
Fig. 7 (colour online) Overall ranking of health-endorsement logos by thirty-six adult consumers (≥18 years), Cape Town, South Africa, October 2016
From the four FGD conducted in phase three, it was clear that participants (n 36) preferred the designs of logos B and D the least. The main reason was that there was no clear link with health, food and nutrition, while many said that the logos were ‘boring’ and the colours ‘dull’ and ‘too medical’.
Participants were positive about the design of logo C, indicating that the logo is easy to understand and that there is a clear link with health and food. Comments were made that the logo has a ‘positive’ and ‘happy’ feel. Participants said the colours used in this logo reminded them of nature and health, while the font was legible.
The designs of logos A and E received mixed reactions. Some participants liked the designs, indicating that an apple is a good symbol of health – some participants specifically mentioned the well-known saying of ‘an apple a day keeps the doctor away’. Many, however, found the use of a specific food (apple) in the logos confusing: ‘a logo containing an apple on a box of lasagne, for example, would be very confusing … someone might think that the lasagne literally contains apple’.
In terms of consumer understanding of these logos, almost all participants agreed that the logo should contain the wording ‘Healthy Choice’ and not ‘Healthier Choice’ and that the picture or symbol used in the logo should have a clear link with health, food or nutrition. By including both these elements, consumers felt that the meaning of the logo would be clear, even without prior exposure to the logo.
With respect to the various colours used in the logos, participants were of the opinion that different greens, yellows, oranges and browns work well on food products, as these colours symbolise health and food. Although many consumers liked the red in the logos, some indicated that too much red could indicate danger and thus imply foods to avoid. Many felt that bright and light blues were not appropriate to use on food labels as they were associated with medicine and cleaning agents: ‘Logo B reminds me of something I can find on a bottle of Domestos’ (a household cleaning range); ‘If it’s blue, I think of cleaning’. These findings, apart from the colours green and blue, are to a certain extent similar to those from research conducted by Wąsowicz et al. on the meaning of colours in nutrition labelling in the context of expert and consumer criteria of evaluating food product healthfulness. They found that consumers associate yellow, blue, certain shades of green and red with health, while purple, pink and other shades of green suggested an artificial and unhealthful product( Reference Wąsowicz, Styśko-Kunkowska and Grunert 29 ).
When discussing the different fonts used on the various logos, participants said that they prefer clear, easy-to-read fonts in capital letters. The font should be big enough to read from a distance and more ‘spaced out’ (e.g. the font used in logo E was preferred to the font used in logo D).
Based on the scores and the discussions, logos B and D were eliminated, while logos A, C and E are recommended for further testing. Although logos A and E received scores above 60 %, it is recommended that these designs should be re-evaluated and possibly adjusted, as consumers had conflicting comments and suggestions on these designs, and that both the original and adjusted designs be used in further testing.
Conclusion
The current study aimed to develop a set of HEL for food products that are healthy choices based on the South African nutrient profile model and to pilot test these logos with consumers.
Findings from the survey conducted in phase one and the FGD in phase two suggest that the participants were positive about a single HEL to be used on food products in SA. Participants felt that it would simplify the nutrition information provided on food labels and would make the food labels less confusing.
The participants preferred simple, clear HEL with a direct link to health and/or nutrition. Bright, bold colours, a clear and easy-to-read message (containing the words ‘healthy choice’ in English), and a logo that would attract attention on a ‘busy’ food label were all mentioned as important characteristics of the design of a HEL.
After the design and re-design of several HEL based on the feedback of participants and a group of experts, three designs were found acceptable to the participants from Cape Town during FGD, with one design particularly favoured. The final three logos were recommended to the Department of Health SA, to consider for implementation after further testing.
Due to the nature of the study design and the small sample size, findings cannot be generalised to the larger Western Cape consumer population and are representative only of the participants included in the present study. Additionally, the nine provinces in SA differ significantly with respect to population size and ethnic groups, literacy levels, language and access to housing, electricity and sewerage. Therefore, it is imperative to test these logos for acceptability and understanding in the different provinces of the country and to include especially illiterate consumers and those living in rural areas.
With adequate and ongoing consumer education and support from various South African role players, an acceptable single HEL could assist in the promotion of health and in addressing the high incidence of NCD in SA.
Acknowledgements
Acknowledgements: The researchers would like to acknowledge the two research assistants who assisted in data collection and Dr Liz van Aswegen for language editing of the article. Financial support: This work was supported by the Stellenbosch University (SU) HOPE project; Early Research Career Development Funding, Stellenbosch University; and the Harry Crossley Foundation, Stellenbosch University. No funding source had any involvement in the study design; in the collection, analysis and interpretation of data; in the writing of the report; or in the decision to submit the article for publication. Conflict of interest: The authors confirm that there are no known conflicts of interest associated with this publication and there has been no significant financial support for this work that could have influenced its outcome. Authorship: The principal researcher, N.K., developed the idea and the protocol for this research study, planned the research, undertook data collection (with the assistance of trained research assistants), captured the data for analyses, analysed the data with the assistance of a statistician, interpreted the data and drafted the article. Fellow researchers, R.B. and E.W.V., provided input at all stages and revised the protocol and article. Ethics of human subject participation: This study was conducted according to the guidelines laid down in the Declaration of Helsinki and all procedures involving human subjects were approved by the Health Research Ethics Committee of Stellenbosch University, Cape Town, SA (S15/08/164). Written informed consent was obtained from all subjects.


