


Consumption of sugar-sweetened beverages (SSB) has been associated with an increased risk of cardiometabolic conditions such as type 2 diabetes and CHD( Reference Malik, Popkin and Bray 1 , Reference Xi, Huang and Reilly 2 ). However, few studies have examined associations between intake of SSB and intermediate biomarkers of cardiometabolic risk( Reference de Koning, Malik and Kellogg 3 ). There are several pathways in the pathogenesis of cardiometabolic diseases through which SSB may influence risk. For example, hepatic function, lipid metabolism, inflammation and glucose metabolism have all been linked to cardiometabolic risk( Reference Wiernsperger 4 , Reference Onat and Hergenc 5 ).
Artificially sweetened beverages (ASB), such as diet soda, and fruit juice have been suggested as alternatives to SSB, as ASB provides limited or no energy content and juice contains vitamins and some other nutrients. However, previous studies have found mixed results regarding associations between these beverages and cardiometabolic risk( Reference Bazzano, Li and Joshipura 6 – Reference Ghanim, Mohanty and Pathak 10 ). Some prospective cohort studies have linked both intakes of ASB and fruit juice to cardiometabolic dysfunction, such as weight gain, the metabolic syndrome and type 2 diabetes( Reference Bazzano, Li and Joshipura 6 – Reference Nettleton, Lutsey and Wang 8 ), whereas other studies have argued that such relationships are due to reverse causality and residual confounding( Reference de Koning, Malik and Rimm 9 ) or have found null associations( Reference Ghanim, Mohanty and Pathak 10 ). These inconsistent findings suggest that further research exploring associations between cardiometabolic health and ASB and fruit juice is needed.
In the present study, we aimed to investigate the associations between habitual intake of SSB and biomarkers of hepatic function, lipid metabolism, inflammation and glucose metabolism in a large cohort of US women using repeated measurements of SSB intake including separate data on types of SSB. We also examined associations between habitual intakes of ASB and fruit juice and cardiometabolic biomarkers.
Methods
Study population
The Nurses’ Health Study is a prospective cohort study of 121 700 female registered nurses aged 30–55 years at baseline in 1976. Mailed questionnaires were administered biennially to collect data on medical, dietary and lifestyle factors, with a follow-up rate exceeding 90 % for each 2-year cycle. Blood samples were collected from 32 826 participants between 1989 and 1990 (biospecimen collection cycle 1) and 18 717 participants between 2000 and 2001 (biospecimen collection cycle 2). As previously reported, participants who provided a blood specimen were generally similar to those who did not in terms of diet and lifestyle( Reference Hunter, Hankinson and Hough 11 ). For the present study, we included participants who provided a blood sample and were previously selected as controls for nested case–control analyses of type 2 diabetes, CHD, stroke, colon cancer, colon polyps, pancreatic cancer and breast cancer. Participants with self-reported prevalent diabetes or CVD at blood draw were excluded. After exclusions, a total of 8492 individuals (6961 from cycle 1 and 1531 from cycle 2) with valid beverage intake data were included in the present analysis (online Supplementary Fig. S1). As different combinations of biomarkers were measured by sub-studies, the sample size for each biomarker varied: fetuin-A (n 1428), alanine transaminase (ALT, n 1319), γ-glutamyl transferase (GGT, n 1317), TAG (n 3363), HDL-cholesterol (n 3071), LDL-cholesterol (n 1715), total cholesterol (n 4083), total cholesterol:HDL-cholesterol ratio (n 2881), C-reactive protein (CRP, n 5939), intracellular adhesion molecule 1 (ICAM-1, n 2290), vascular cell adhesion protein 1 (n 1205), adiponectin (n 6059), insulin (n 2746), HbA1c (n 4390). The study protocol was approved by the Institutional Review Board of the Brigham and Women’s Hospital and the Human Subjects Committee Review Board of the Harvard T.H. Chan School of Public Health.
Dietary assessment
Dietary intake was measured using validated FFQ administered every 4 years as described in detail previously( Reference Willett, Sampson and Stampfer 12 ). For the present study, we used the last two FFQ before blood collection (1986 and 1990 for cycle 1 and 1994 and 1998 for cycle 2). Participants were asked to report how often, on average they consumed a standard portion of foods and beverages (one standard glass, can, or bottle), using nine possible responses ranging from ‘never or less than once per month’ to ‘6 or more times per day’. We aggregated the responses into five categories: never or almost never, less than once per week, once to twice per week, three to six times per week and one or more times per day. We summed the intake of caffeinated and non-caffeinated colas (e.g. Coke, Pepsi and other colas with sugar), non-cola carbonated beverages with sugar (e.g. 7-Up) and non-carbonated sweetened beverages (e.g. Hawaiian Punch, lemonade and other non-carbonated fruit drinks) as total SSB. Other beverages that may contain sugar such as sweetened milks and coffee with cream and sugar were not included. ASB consisted of all types of low-energy or artificially sweetened carbonated beverages, such as diet colas and other diet carbonated beverages. Fruit juice included apple juice or cider, orange juice, grapefruit juice and other fruit juices. A validation study of the FFQ used in 1980 indicated that correlation coefficients between the FFQ and diet records were 0·84 for colas, 0·36 for non-cola carbonated beverages, 0·56 for non-carbonated sweetened beverages and 0·84 for fruit juice( Reference Salvini, Hunter and Sampson 13 ) Total energy intake was calculated by multiplying the frequency of consumption by the energy content of each food item and then adding the contribution from all food items. We used US Department of Agriculture data supplemented with the manufacturers’ data to calculate nutrient values( 14 ). The Alternative Healthy Eating Index (AHEI) was calculated by assigning a maximum of ten points to the following categories: high intakes of fruits, vegetables, whole grains, nuts, legumes and vegetable proteins, long-chain n-3 PUFA (n-3 PUFA), PUFA excluding long-chain n-3 PUFA, as well as low intakes of: SSB and fruit juice, red and processed meats, trans-fat and Na. AHEI scores range from 0 (non-adherence) to 110 (perfect adherence)( Reference Chiuve, Fung and Rimm 15 ). We excluded SSB and fruit juice for AHEI calculation in the present study to avoid collinearity.
Biochemical analysis
Blood sample collections for our study population were described in detail previously( Reference Chan, Ogino and Giovannucci 16 ). In brief, a phlebotomy kit and instructions were sent to participants willing to provide blood specimens in 1989–1990 and in 2000–2001. Samples were returned by overnight courier with an ice pack and processed immediately upon arrival. Whole blood samples were separated into plasma, buffy coat and erythrocytes and stored in the vapour phase of liquid N2 freezers at −150°C until analysis. Quality control samples were routinely frozen with study samples to monitor potential changes due to long-term storage and to assess assay stability. All biomarkers were measured in the Clinical Chemistry Laboratory at the Children’s Hospital in Boston or in the laboratory of Dr Christos Mantzoros at Beth Israel Deaconess Hospital in Boston using standard methods and assays( Reference Ley, Sun and Jimenez 17 , Reference Nimptsch, Brand-Miller and Franz 18 ). Biomarker measurements had CV of <15 %. We chose the selected biomarkers as our outcome measures because they have all been shown to be associated with cardiometabolic risk in previous studies( Reference Sun, Cornelis and Manson 19 – Reference Selvin, Steffes and Zhu 27 ). For example, Sun et al. linked plasma fetuin-A levels to higher risk of developing type 2 diabetes in the cohort we used( Reference Sun, Cornelis and Manson 19 ); Ridker et al. demonstrated that LDL-cholesterol, total cholesterol:HDL-cholesterol ratio and CRP were strong predictors of future cardiovascular events( Reference Ridker, Rifai and Cook 24 ).
Covariates
In biennial follow-up questionnaires, we updated information on medical, dietary and lifestyle factors, including age, body weight, smoking status, physical activity, medication use and history of chronic diseases. Information on dietary factors was obtained from the last two FFQ before blood collection for each cycle (1986 and 1990 for cycle 1 and 1994 and 1998 for cycle 2). For non-dietary covariates in this analysis, we used questionnaires administered closest in time to blood draw (1990 for cycle 1 and 2000 for cycle 2). BMI (kg/m2) was calculated using height measured in 1976 and weight measured closest to blood draw (1990 for cycle 1 and 2000 for cycle 2). Physical activity was calculated by multiplying the hours spent on various forms of exercise per week and the metabolic equivalent (MET) score of each specific activity and then summing up the MET-hours for all activities to obtain a value of total weekly MET-hours.
Statistical analysis
Distributions of continuous biomarkers were assessed for normality, and were natural log transformed if skewed. To better reflect habitual beverage intake, we calculated the cumulative average of intakes from the last two FFQ before blood collection for each cohort (1986 and 1990 for cycle 1 and 1994 and 1998 for cycle 2). Descriptive statistics for continuous variables were summarised as means and standard deviations and categorical variables were summarised as proportions according to SSB intake categories.
We used generalised linear models to evaluate the associations between SSB intake and biomarker concentrations. All biomarkers were recalibrated using Rosner et al.’s method( Reference Rosner, Cook and Portman 28 ), in order to account for variation in sample handing and laboratory drift between biospecimen collection cycles and among batches. We constructed two multivariable models. Model 1 was adjusted for age at blood draw, fasting status (fast for ≥8/<8 h), and time of blood draw (blood collection cycle 1/2). Model 2 was additionally adjusted for medical, dietary, and lifestyle variables including smoking status (current/former/never), alcohol intake (continuous), physical activity (tertiles: <5·6, 5·6–17·2 or ≥17·3 h of MET/week), total energy intake (tertile), AHEI score excluding SSB intake (tertiles)( Reference Chiuve, Fung and Rimm 15 ), postmenopausal hormone use (yes/no) and BMI (continuous),which are factors associated with cardiometabolic risk suggested by previous studies( Reference Leiter, Fitchett and Gilbert 29 ). We further adjusted for history of hypertension (yes/no) and history of hypercholesterolaemia (yes/no), which may be potential mediators of the association between SSB intake and cardiometabolic biomarkers. Since BMI and total energy intake may be potential mediators, we also examined associations after removing these variables from the multivariate models. To account for missing data, for variables with missing rates <5 %, we assigned corresponding medians to the missing values of continuous covariates, and assigned corresponding reference groups to the missing data of categorical covariates; for variables with missing rates >5 % (total energy intake only), we handled missing values with multiple imputation. Least-squares means of biomarkers were estimated in frequency categories of SSB intake, and linear trends were evaluated by modelling the medians of intake categories as continuous variables. For better illustration, we additionally calculated the relative concentrations of biomarkers (or relative ratio for total cholesterol:HDL-cholesterol ratio) with 95 % CI by dividing the least-squares mean concentrations of biomarkers among subjects with the greatest SSB consumption (i.e. once per day or more) by the corresponding concentrations of biomarkers among those with the lowest intake level (i.e. never or almost never)( Reference Tabung, Smith-Warner and Chavarro 30 , Reference Yu, Malik and Keum 31 ). Potential interactions were tested by adding an interaction term for SSB intake (continuous) with age at blood draw (<50/≥50 years), BMI (<25/25–29·9/≥30 kg/m2), AHEI score excluding SSB intake (below/above median) or smoking status (current/former/never). We also evaluated the associations between ASB and fruit juice intakes and biomarker concentrations using the same methods.
We conducted sensitivity analysis by stratifying the association between SSB and biomarkers by blood collection cycle. The overall analysis was merged after confirmation of similar associations in both cycles. We stratified the main analysis by type of SSB (colas, non-cola carbonated beverages and fruit drinks and punch) as their difference in components (e.g. sugar profiles and additives) may result in differences in cardiometabolic risk( Reference Ventura, Davis and Goran 32 , Reference Vlassara, Cai and Crandall 33 ). For example, cola drinks containing caramel colouring may contain advanced glycation end products that have been linked to cardiometabolic risk( Reference Uribarri, Stirban and Sander 34 ). We also replaced the AHEI score in our multivariate model by intakes of major food groups (red and processed meat, whole grains, fruit, vegetables and coffee in tertiles). For all statistical analyses, two-sided P<0·05 was considered to be statistically significant. All data analyses were performed using SAS software, version 9.3 for UNIX (SAS 170 Institute).
Results
The age-adjusted characteristics of study participants according to their frequency of SSB intake are shown in Table 1. Participants who had a higher intake of SSB had a higher prevalence of hypercholesterolaemia, were more likely to be current smokers, consume less alcohol, and had a higher intake of total energy, and lower diet quality assessed by the AHEI score. The age-adjusted characteristics of study participants according to their frequency of ASB and SSB intake are shown in the online Supplementary Tables S1 and S2.
Table 1 Age-adjusted characteristics according to frequency of sugar-sweetened beverage (SSB) intake among participants free of diabetes and CVD in the Nurses’ Health Study at baseline (one serving=one glass, bottle or can) (n 8492) (Mean values and standard deviations; medians and interquartile ranges (IQR))
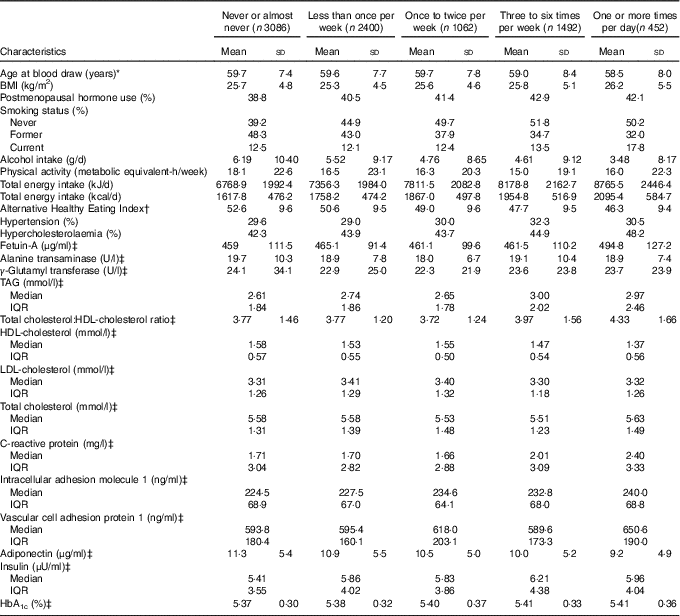
* Baseline defined as the time of blood draw (1990 or 2000).
† SSB intake was excluded in the calculation.
‡ Not age-adjusted.
Associations between sugar-sweetened beverage intake and cardiometabolic biomarkers
Least-squares mean concentrations of biomarkers by frequency of SSB intake are shown in Table 2. More frequent SSB intake was significantly associated with higher concentrations of fetuin-A, TAG, CRP, ICAM-1 and insulin, a higher total cholesterol:HDL-cholesterol ratio and lower concentrations of HDL-cholesterol and adiponectin in both models 1 and 2. Relative concentrations (or relative ratio) with 95 % CI comparing subjects with SSB intake of once per day or more v. never or almost never were: fetuin-A, 1·08 (95 % CI 1·02, 1·14), P trend=0·04; TAG, 1·11 (95 % CI 1·03, 1·19), P trend=0·0003; total cholesterol:HDL-cholesterol ratio, 1·09 (95 % CI 1·02, 1·16), P trend=0·002; HDL-cholesterol, 0·94 (95 % CI 0·89, 0·98), P trend=0·003; CRP, 1·27 (95 % CI 1·13, 1·42), P trend=0·0002; ICAM-1, 1·05 (95 % CI 1·00, 1·10), P trend=0·04; adiponectin, 0·87 (95 % CI 0·81, 0·93), P trend≤0·0001; insulin, 1·11 (95 % CI 0·99, 1·24), P trend=0·009 (Fig. 1 and Table 2). These associations were similar after further adjustment for history of hypertension and history of hypercholesterolaemia (data not shown). Associations were also similar after removing BMI and total energy intake from the multivariate models (not shown). TAG, total cholesterol:HDL-cholesterol ratio, HDL-cholesterol, CRP and adiponectin remained significant after strict Bonferroni correction for multiple comparisons (P<0·004). We observed significant interactions between SSB intake and BMI on GGT concentration (P interaction0·05) and between SSB intake and BMI (P interaction=0·003) as well as age (P interaction=0·01) on LDL-cholesterol concentration. The associations between SSB intake and GGT concentration and between SSB intake and LDL-cholesterol concentration were weaker among overweight and obese subjects, and the association between SSB intake and LDL-cholesterol concentration was also weaker among those aged ≥50 years. In sensitivity analysis, the associations between SSB intake and biomarkers did not differ by blood collection cycle (online Supplementary Tables S3 and S4). Among the three types of SSBs, we observed the strongest associations between cola intake and cardiometabolic biomarkers. More frequent cola intake was significantly associated with higher concentrations of fetuin-A (P trend=0·03), TAG (P trend=0·04) and CRP (P trend=0·002), higher total cholesterol:HDL-cholesterol ratio (P trend=0·01) and lower concentrations of HDL-cholesterol (P trend=0·002) and adiponectin (P trend<0·0001), whereas fruit drink and punch intake was positively associated with TAG (P trend=0·03), CRP (P trend=0·004) and insulin (P trend=0·04) and inversely associated with adiponectin (P trend=0·003) (online Supplementary Tables S5–S7). We observed similar results when adjusting for intakes of major food groups instead of the AHEI score (online Supplementary Table S8).
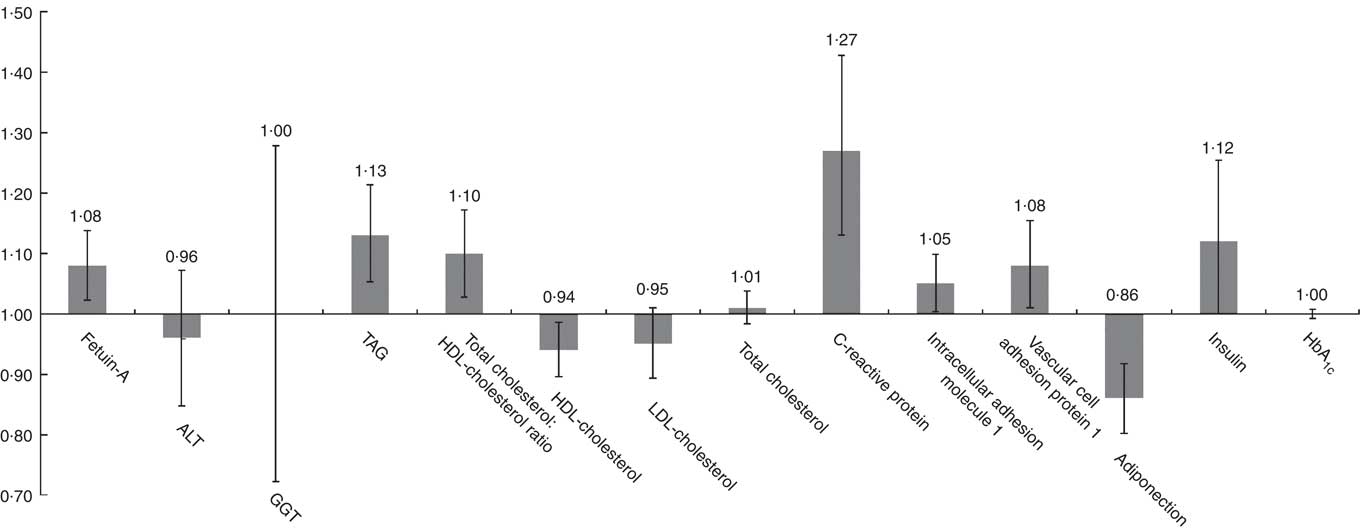
Fig. 1 Relative concentrations (or relative ratio) with 95 % CI of biomarkers according to sugar-sweetened beverage (SSB) intake. ALT, alanine transaminase; GGT, γ-glutamyl transferase. Relative concentrations (or relative ratio) with 95 % CI of biomarkers predicted in highest SSB intake category (once per day or more) to the lowest category as reference (never or almost never). Models were adjusted for age at blood draw, fasting status (yes/no) and time of blood draw (blood collection cycle 1/2), smoking status (current/former/never), alcohol intake (continuous), physical activity (tertile), total energy intake (tertile), Alternate Healthy Eating Index score excluding sugar-sweetened beverages (tertile), postmenopausal hormone use (yes/no) and BMI (continuous).
Table 2 Concentrations of biomarkers by frequency of sugar-sweetened beverage (SSB) intake among participants free of diabetes and CVD in the Nurses’ Health Study (n 8492)Footnote * (Least-squares means and 95 % confidence intervals)
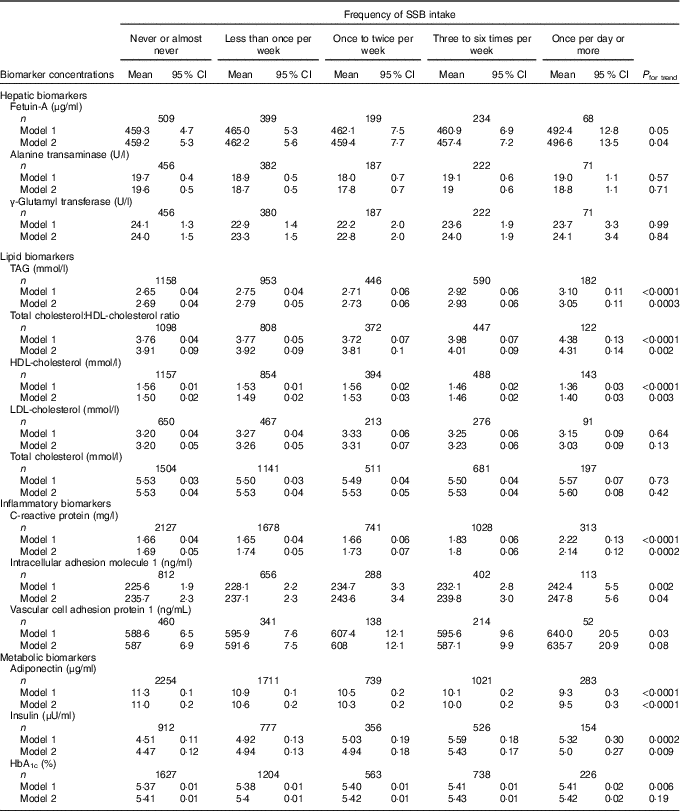
* Biomarker sample sizes vary: fetuin-A (n 1409), alanine transaminase (n 1318), γ-glutamyl transferase (n 1316), TAG (n 3329), total cholesterol:HDL-cholesterol ratio (n 2847), HDL-cholesterol (n 3036), LDL-cholesterol (n 1697), total cholesterol (n 4034), C-reactive protein (n 5887), intracellular adhesion molecule 1 (n 2271), vascular cell adhesion protein 1 (n 1205), adiponectin (n 6008), insulin (n 2725), HbA1c (n 4358). Values were determined using general linear models. Model 1 was adjusted for age at blood draw, fasting status (yes/no) and time of blood draw (blood collection cycle 1/2). Model 2 was adjusted for the variables in model 1 plus smoking status (current/former/never), alcohol intake (continuous), physical activity (tertile), total energy intake (tertile), Alternate Healthy Eating Index score excluding SSB (tertile), postmenopausal hormone use (yes/no) and BMI (continuous).
Associations between artificially sweetened beverages and fruit juice intake and cardiometabolic biomarkers
Least-squares mean concentrations of biomarkers by frequency of ASB and fruit juice intake are shown in Tables 3 and 4, respectively. More frequent ASB intake was marginally associated with a higher concentration of CRP (P trend=0·048) and adiponectin (P trend=0·008). More frequent fruit juice intake was associated with higher concentrations of TAG (P trend≤0·0001) and HbA1c (P trend=0·03) and a lower concentration of adiponectin (P trend=0·0009).
Table 3 Concentrations of biomarkers by frequency of artificially sweetened beverage (ASB) intake among participants free of diabetes and CVD in the Nurses’ Health Study (n 8492)Footnote * (Least-squares means and 95 % confidence intervals)
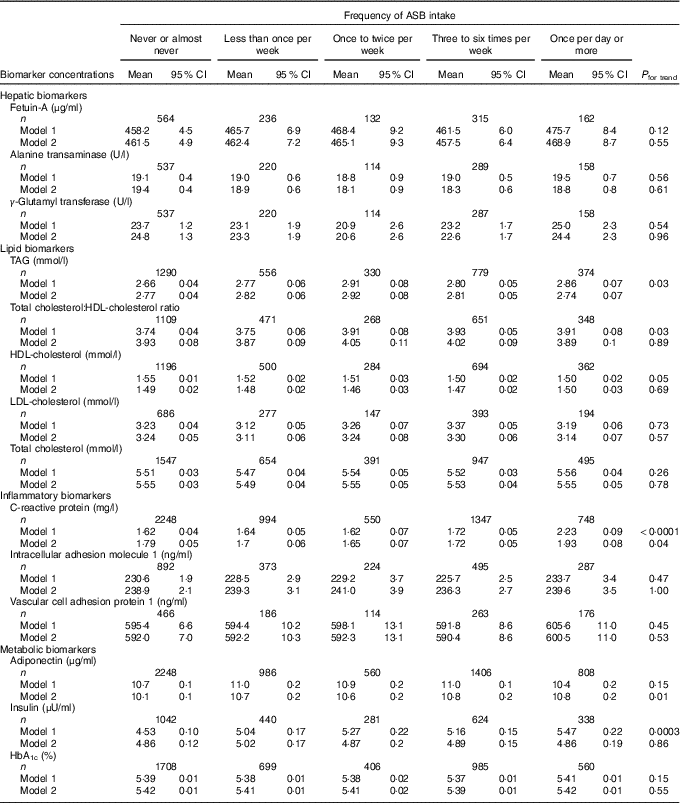
* Biomarker sample sizes vary: fetuin-A (n 1409), alanine transaminase (n 1318), γ-glutamyl transferase (n 1316), TAG (n 3329), total cholesterol:HDL-cholesterol ratio (n 2847), HDL-cholesterol (n 3036), LDL-cholesterol (n 1697), total cholesterol (n 4034), C-reactive protein (n 5887), intracellular adhesion molecule 1 (n 2271), vascular cell adhesion protein 1 (n 1205), adiponectin (n 6008), insulin (n 2725), HbA1c (n 4358). Values were determined using general linear models. Model 1 was adjusted for age at blood draw, fasting status (yes/no) and time of blood draw (blood collection cycle 1/2). Model 2 was adjusted for the variables in model 1 plus smoking status (current/former/never), alcohol intake (continuous), physical activity (tertile), total energy intake (tertile), Alternate Healthy Eating Index score excluding sugar-sweetened beverages (tertile), postmenopausal hormone use (yes/no) and BMI (continuous).
Table 4 Concentrations of biomarkers by frequency of fruit juice intake among participants free of diabetes and CVD in the Nurses’ Health Study (n 8492)Footnote * (Least-squares means and 95 % confidence intervals)
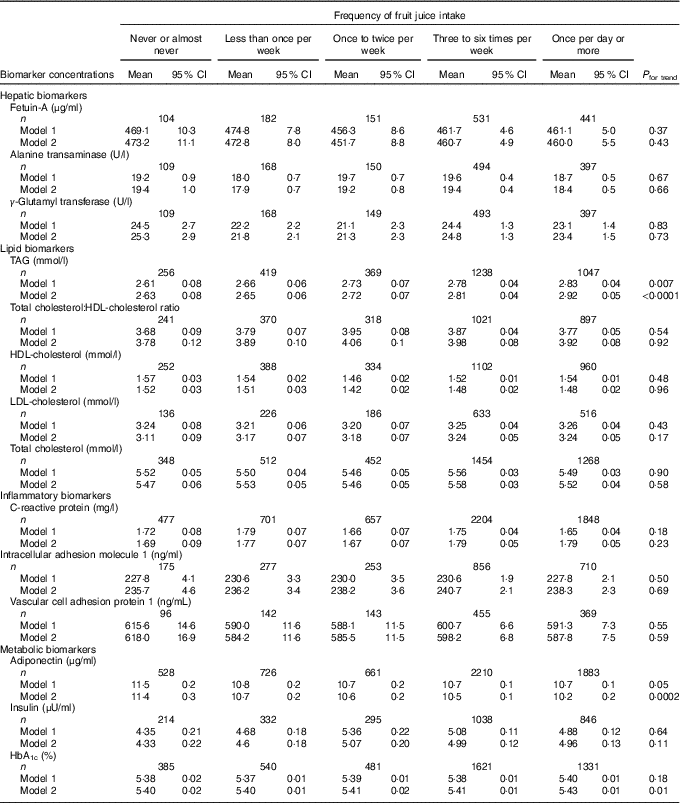
* Biomarker sample sizes vary: fetuin-A (n 1409), alanine transaminase (n 1318), γ-glutamyl transferase (n 1316), TAG (n 3329), total cholesterol:HDL-cholesterol ratio (n 2847), HDL-cholesterol (n 3036), LDL-cholesterol (n 1697), total cholesterol (n 4034), C-reactive protein (n 5887), intracellular adhesion molecule 1 (n 2271), vascular cell adhesion protein 1 (n 1205), adiponectin (n 6008), insulin (n 2725), HbA1c (n 4358). Values were determined using general linear models. Model 1 was adjusted for age at blood draw, fasting status (yes/no), and time of blood draw (blood collection cycle 1/2). Model 2 was adjusted for the variables in model 1 plus smoking status (current/former/never), alcohol intake (continuous), physical activity (tertile), total energy intake (tertile), Alternate Healthy Eating Index score excluding sugar-sweetened beverages (tertile), postmenopausal hormone use (yes/no) and BMI (continuous).
Discussion
In this large cohort of US women, habitual intake of SSB was associated with adverse levels of multiple cardiometabolic biomarkers, including fetuin-A, TAG, total cholesterol:HDL-cholesterol ratio, HDL-cholesterol, CRP, ICAM-1, insulin and adiponectin, after adjusting for dietary, and lifestyle variables. Associations between intakes of ASB and fruit juice with cardiometabolic biomarkers were less consistent, with adverse associations observed for CRP with ASB and for TAG, adiponectin and HbA1c with juice. Although it is well accepted that intake of SSB is associated with clinical outcomes such as type 2 diabetes and CHD( Reference Malik and Hu 35 ), the biological mechanisms underlying these associations have not been completely elucidated. Our study adds to the literature of how SSB contributes to the development of clinical outcomes. Juice and ASB, which may be consumed in place of SSB have also been linked to cardiometabolic diseases in some studies( Reference Malik and Hu 35 ). However, these findings have been controversial particularly for ASB, which are non-energetic and often considered a better choice over SSB for health. By exploring associations with biomarkers our study helps clarify the relationships between ASB and juice with cardiometabolic health to better guide beverage recommendations.
Our results are consistent with previous observational studies that have linked SSB intake to increased inflammation and adverse alterations in lipids and glucose metabolism( Reference Malik and Hu 35 , Reference Malik, Popkin and Bray 36 ). In a cross-sectional analysis of the Health Professionals Follow-up Study, SSB intake was associated with increased TAG, CRP, IL-6 and TNF receptors 1 and 2 and decreased HDL-cholesterol, lipoprotein (a), and leptin (P<0·02)( Reference de Koning, Malik and Kellogg 3 ). Findings from trials generally support those from observational studies. In several studies, rapid increases in blood glucose and insulin have been observed following intake of SSB( Reference Janssens, Shapira and Debeuf 37 , Reference Raben, Møller and Flint 38 ) and a number of investigators have reported adverse effects of SSB on various cardiometabolic markers( Reference Maersk, Belza and Stodkilde-Jorgensen 39 – Reference Raben, Vasilaras and Moller 43 ). For example, Maersk et al. reported significantly higher changes in TAG and total cholesterol levels among participants randomized to the regular cola group compared with those randomized to isoenergetic semi-skimmed milk, artificially sweetened cola, or water( Reference Maersk, Belza and Stodkilde-Jorgensen 39 ). In contrast, some studies have not shown adverse effects of SSB on cardiometabolic biomarkers( Reference Livesey and Taylor 44 , Reference David Wang, Sievenpiper and de Souza 45 ), however these were primarily based on postprandial effects of fructose.
Intake of SSB may influence the risk of cardiometabolic diseases though hepatic function, lipid metabolism, inflammation, and glucose metabolism based on constituent sugars. SSB are composed of energy-containing sweeteners such as sucrose (50 % glucose, 50 % fructose), high-fructose maize syrup (HFCS; 45 % glucose and 55 % fructose or 58 % glucose and 42 % fructose), or fruit juice concentrates( Reference Malik, Pan and Willett 46 ). All of these sugars contain fructose, which is primarily metabolised in the liver where it undergoes lipogenesis and glycogen synthesis. Therefore, SSB intake may impair liver function, as one of the possible mechanisms through which it impacts cardiometabolic health. We observed a positive association between SSB intake and plasma concentrations of fetuin-A, a protein produced by the liver that has been positively associated with diabetes( Reference Sun, Cornelis and Manson 19 ). However, we did not observe associations between SSB intake and concentrations of ALT and GGT, two widely used markers of liver damage and non-alcoholic fatty liver disease (NAFLD). In a previous study in this cohort we found that the association between fetuin-A and diabetes was independent of liver enzyme levels, suggesting that fetuin-A and NAFLD may increase diabetes risk through different mechanisms( Reference Sun, Cornelis and Manson 19 ). As previously described, fructose is preferentially metabolised in the liver and can lead to increased hepatic de novo lipogenesis, which can promote the development of an adverse lipid profile, an established predictor of cardiometabolic conditions( Reference Wilson and Meigs 22 ). Our study found that SSB intake was associated with increased TAG and total cholesterol:HDL-cholesterol ratio as well as a decreased HDL-cholesterol.
Intake of SSB also provides a large quantity of rapidly absorbable carbohydrates to the body, which can induce rapid increases in blood glucose and insulin concentrations. This, coupled with the large volumes consumed, can contribute to a high dietary glycaemic load (GL). High GL diets have been shown to have adverse effects on glucose metabolism and increase inflammation( Reference O’Riordain, Ross and Fearon 47 , Reference Liu, Manson and Buring 48 ), a key process in the development of atherosclerosis( Reference Danesh, Wheeler and Hirschfield 49 ) and diabetes( Reference Baumann and Gauldie 50 ). We observed that more frequent SSB intake was associated with higher insulin and lower concentrations of adiponectin and inflammatory biomarkers.
Data from the National Health and Nutrition Examination Survey (2011–2014) show that approximately one-half of US adults consumed at least one SSB on a given day( Reference Rosinger, Herrick and Gahche 51 ), which is much higher than that of our study population in 1990 or 2000. During the past decades, the major sweeteners added to SSB, HCFS and sucrose, have remained unchanged since the late 1960’s( Reference Malik and Hu 35 ). With higher consumption, we would expect a stronger association between SSB consumption and cardiometabolic markers at this time in the general US population. However, whether sucrose (50 % glucose, 50 % fructose) v. HFCS (45 % glucose, 55 % fructose) is used is unlikely to have a differential impact on cardiometabolic risk because the two sugars contain similar amounts of glucose and fructose; the constituent sugars implicated in the biological mechanisms linking SSB with cardiometabolic risk. In addition, evidence from trials has shown that intake of sucrose, the predominant sweetener in Europe, or HFCS, the primary sweetener used in the USA, resulted in similar effects on measures of glycaemia, lipid metabolism, and inflammation. Therefore, we do not expect much heterogeneity in the results between sucrose and HFCS sweetened beverages( Reference Raatz, Johnson and Picklo 52 ).
ASB and fruit juice have been suggested as alternatives to SSB, and our results indicate that, compared with SSB intake, ASB and fruit juice intakes were less consistently associated with cardiometabolic biomarkers. Unlike SSB, ASB contains non-energetic sweeteners that provide few to no energy content. We found that intake of ASB was associated with higher concentrations of CRP and adiponectin. However, the association between ASB intake and CRP concentration was marginally significant, and whether the association between ASB intake and adiponectin is a true biological association or due to residual confounding, reverse causation, or chance is unclear. Fruit juice contains some vitamins, nutrients and other bioactive molecules such as polyphenols, and some juices contain small amounts of fibre, which may explain why we observed fewer associations between juice intake and cardiometabolic markers compared with SSB despite both beverages containing similar amounts of sugar that are either naturally derived in juice or added in SSB. We observed that a more frequent intake of fruit juice was positively associated with TAG and HbA1c and inversely associated with adiponectin. However, given that there is conflicting evidence regarding associations between intake of ASB and juice on cardiometabolic health( Reference Bazzano, Li and Joshipura 6 – Reference Ghanim, Mohanty and Pathak 10 ) and that the long-term health consequences of consuming artificial sweeteners is unclear, further research on both of these beverages is warranted.
Strengths of the present study include the large sample size, detailed information on potential confounders, and use of cumulative averages of beverage intake, which can reduce within person variability. Some limitations are worth noting. Our study was conducted among predominantly white health professionals, which increases internal validity, but lacks generalisability. Another limitation is the cross-sectional design of our analysis. Although we adjusted for many potential confounders, we cannot exclude the possibility of residual confounding and reverse causation. Measurement errors associated with the use of FFQs and a single measure of cardiometabolic biomarkers may have attenuated the results. In addition, we only had data on frequency of beverage consumption rather than actual intake to assess exposure.
In conclusion, we found that intake of SSB was associated with adverse levels of multiple cardiometabolic biomarkers. These data support an overall harmful role of SSB intake on cardiometabolic health and suggest hepatic function, lipid metabolism, inflammation and glucose metabolism as potential pathways. Associations between ASB and fruit juice with cardiometabolic markers were less consistent, and further research exploring their impact on cardiometabolic health is warranted.
Acknowledgements
The authors would like to thank the participants and staff of the Nurses’ Health Study for their valuable contributions as well as the following state cancer registries for their help: AL, AZ, AR, CA, CO, CT, DE, FL, GA, ID, IL, IN, IA, KY, LA, ME, MD, MA, MI, NE, NH, NJ, NY, NC, ND, OH, OK, OR, PA, RI, SC, TN, TX, VA, WA, WY.
This study was supported by the grants UM1 CA186107, UM1 CA176726, R01 CA49449 and R01 CA67262 from the National Institutes of Health. National Institutes of Health had no role in the design, analysis or writing of this article.
The authors’ responsibilities were as follows – Z. Y.: conducted the analysis, interpreted the data and wrote the manuscript; S. H. L., Q. S., F. B. H. and V. S. M.: interpreted the data and edited the manuscript; V. S. M.: critically reviewed the manuscript for important intellectual content; and Z. Y. and V. S. M.: had primary responsibility for final content.
The authors declare that there are no conflicts of interest.
Supplementary material
For supplementary material/s referred to in this article, please visit https://doi.org/10.1017/S0007114517003841


