


Excessive body weight (BW) is a global public health issue. According to the WHO’s investigation in 2015, worldwide obesity has more than doubled since 1980( 1 ). Excess adiposity is associated with chronic diseases through various metabolic pathways and their complications such as elevated blood pressure, elevated plasma glucose and dyslipidaemia( Reference Hubert, Feinleib and McNamara 2 – Reference Møller, Mellemgaard and Lindvig 4 ). Traditional weight loss diets are usually low in fat to decrease overall daily energy intake and because of the favourable effects on blood lipids( Reference Sackner-Bernstein, Kanter and Kaul 5 ). This traditional dogma is now contentious with several studies comparing low-fat with high-fat diet showing variable results on BW and cardiometabolic indicators in people with overweight or obesity( Reference Samaha, Lqnal and Seshadri 6 – Reference Schwingshack and Hoffmann 9 ). Notably two systematic reviews and meta-analyses( Reference Mansoor, Vinknes and Veierød 8 , Reference Schwingshack and Hoffmann 9 ) have reported common findings that high-fat diets v. low-fat diets result in higher fasting plasma total cholesterol (TC) and LDL-cholesterol, but lower fasting plasma TAG and higher HDL-cholesterol. The effects on BW are less clear with one meta-analysis reporting that overall there is no difference when comparing low-fat v. high-fat diets, however when these diets were combined with energy restriction the difference was greater with the high-fat intervention( Reference Schwingshack and Hoffmann 9 ). Whereas in a more recent meta-analysis there was a greater change in BW after high-fat diets compared with low-fat diets( Reference Mansoor, Vinknes and Veierød 8 ). As there appears to be elevated LDL-cholesterol with consumption of high-fat diets, caution has ensued in recommending this dietary pattern in combination with overall energy restriction for facilitating weight loss.
Dietary fat may confer different effects on blood lipids in people with overweight or obesity depending on whether there is underlying metabolic disease or not. Excess adiposity is not always concomitant with metabolic complications or CVD. These people have been described as ‘metabolically healthy obese’ (MHO)( Reference Herrmann, Reuter and Schutz 10 – Reference Sims 12 ). MHO individuals are characterised by reduced cardiometabolic risk (relative to weight-matched individuals with metabolic disturbances), as reflected by preserved insulin sensitivity, a reduced inflammatory status and a normal circulating lipid profile( Reference Primeau, Coderre and Karelis 13 ). Importantly, recent studies estimate that the prevalence of this phenotype may be as high as 30 % of the obese population( Reference Pataky, Bobbioni-Harsch and Golay 14 , Reference Velho, Paccaud and Waeber 15 ). If excess adiposity is sustained a metabolically unhealthy phenotype may develop( Reference Fangjian and Garvey 16 ). This is an important sub-clinical population to study to assist with development of strategies which aim to prevent the onset of metabolic complications. A growing number of studies show that in addition to lifestyle and dietary differences, there are also differences in the expression of genes linked to CVD progression in this sub-clinical population, compared with those who have excess adiposity in combination with metabolic disturbances( Reference Das, Ma and Sharma 17 – Reference Schroder, Ramos and Baena-Dıez 20 ). With the increased number of randomised controlled trials (RCT) that have compared a low-fat diet with a high-fat diet in metabolically healthy people with overweight or obesity, a systematic review and meta-analysis to summarise the impact of these diets on cardiometabolic risk factors is now warranted. This is important for developing best-practice dietary guidelines, particularly for MHO populations.
Methods
Literature search
All of the processes of article searching were conducted by two investigators independently. Literature search was limited to RCT without any restriction on language or calendar date. The databases MEDLINE, EMBASE and the Cochrane Trial Register were searched through to October 2016. The structured search strategies used the following format of terms: (low fat diet OR low fat diets OR reduced fat) AND (obese OR obesity OR overweight OR weight loss). This combination of search terms were selected to ensure that all relevant studies were identified through and screened for eligibility. The reference lists of retrieved articles were also checked for additional publications. This systematic review was conducted in adherence to the standards of the Preferred Reporting Items for Systematic Review and Meta-Analysis statement( Reference Higgins and Green 21 ).
Eligibility criteria
Studies were reviewed by title and abstract first and then the full-text for the final eligibility of a study. Only studies that met all of the following criterions were included: (i) RCT; (ii) the BMI of the participants ≥25 kg/m2; (iii) the intervention should be a low-fat diet (<30 % of total energy consumption) compared with a high-fat diet (≥30 % of total energy consumption); (iv) participants are metabolically healthy according to Wildman et al.( Reference Wildman, Muntner and Reynolds 22 ): where less than two of the following criterions should be found: blood pressure≥130/85 mmHg; TAG≥1·7 mmol/l; HDL-cholesterol for men <1·03 mmol/l, for women <1·30 mmol/l; glucose≥5·6 mmol/l; homoeostasis model assessment-insulin resistance>4·27 (i.e. 90th percentile); high-sensitivity C-reactive protein (Hs-CRP)>7·89 mg/dl (i.e. 90th percentile); (v) having at least one of the outcomes (BW, systolic blood pressure (SBP), diastolic blood pressure (DBP), LDL-cholesterol, HDL-cholesterol, TC, TAG, insulin, glucose, leptin, total adiponectin and Hs-CRP) for assessment and report of post intervention mean or mean of two time point values with standard deviation (or basic data to calculate these parameters).
Studies were excluded if the high-fat diet accounted for only 30 % of the total energy or if any of the participants were using drugs that could influence the result of interest (lipid modification drugs, hormone drugs, slimming drugs, etc.). Diets that replaced fat with artificial fat were excluded. If there were studies published as updates, only the study that had the most outcomes of interest was included.
Data extraction
For all included studies, the following data were extracted: the first author’s name, date of publication, country where participants reside, follow-up period, study design, drop-out rate, total number of participants, female percentage and post intervention mean values or differences in mean of two time point values with corresponding standard deviation. In case of more than one low-fat group or high-fat group within a single study design, data were combined according to the methods recommended by the Cochrane collaboration( Reference Moher, Liberati and Tetzlaff 23 ). If standard deviation was not provided, it was calculated from standard error of mean or 95 % CI. Extracted data were turned to unified units. For TC, LDL-cholesterol and HDL-cholesterol, 1 mmol/l was converted to 38·61 mg/dl; for TAG, 1 mmol/l was converted to 88·50 mg/dl; for plasma glucose, 1 mmol/l was converted to 18 mg/dl.
Quality assessment and risk of bias
Methodology quality of the included studies were assessed by both the JADAD score and risk of bias assessment. Two investigators conducted the assessment independently. The modified JADAD score (seven-point) was used according to randomisation (randomisation=1 point, random number generated by computer or similar methods=an additional 1 point) , concealment of allocation (random number table or similar methods=1 point, the allocation scheme is controlled by centre or pharmacy, or using of opaque envelopes or other methods that be secret to clinicians and subjects of the allocation methods=an additional 1 point), double-blinding (double-blind=1 point, use of a placebo=additional 1 point), withdrawals and dropouts (numbers and reasons for drop-out are stated=1 point). Final scores of 0–3 points were considered to be of low quality and 4–7 points as high quality( Reference Møller, Mellemgaard and Lindvig 4 , Reference Jadad, Andre Moore and Carroll 24 ).
Risk of bias of the included studies were assessed using the Cochrane Collaboration’s risk of bias tool following six domains: (i) selection bias (random sequence generation allocation concealment); (ii) performance bias (blinding of participants and personnel); (iii) detection bias (blinding of outcome assessment); (iv) attrition bias (incomplete outcome date); (v) reporting bias (selective reporting); (vi) other bias( Reference Higgins, Altman and Gotzsche 25 ). Data were analysed using Review Manager 5.3 software to give an overview of the risk of bias within the included studies against theses six domains.
Statistical analysis
Meta-analysis was performed for all outcomes to determine the pooled effect of the intervention. A random-effects model described by DerSimonian & Laird( Reference DerSimonian and Laird 26 ) was used to estimate weighted mean differences (WMD) with 95 % CI. Heterogeneity of the trial results were tested by Q test and I 2 parameter. I 2≤25 % was considered to be low heterogeneity, 25 %<I 2≤50 % moderate heterogeneity, whereas I 2≥75 % was considered to be high heterogeneity( Reference Higgins 27 ). In order to find out the source of heterogeneity, subgroup analysis was carried out for outcomes that had a moderate or high heterogeneity focused on the following covariates : the percentage of female (>80 or≤80 %); fat percentage of high-fat diet (≥45 or <45 %); carbohydrate percentage of low-fat diet (>55 or≤55 %); duration (<3, 3–6 or >6 months); energy restriction (both restricted or low fat only or high fat only or no); high-fat diet type (low-carbohydrate diet or other high-fat diet types); drop-out rate (>20 or≤20 %); Continent (North America, Europe or others); the JADAD score (≥4 or <4). Univariate meta-regression was also conducted where there were more than 10 studies including the dependent variables of interest. Most of the cut points of subgroups were chosen by median. Sensitivity analysis was applied to assess whether one single study influenced the results excessively. Begg’s test and Egger’s test were performed and the symmetry of the funnel plots assessed to examine potential publication bias. All of the analyses were conducted using Stata/SE 12.0 (add publisher/manufacture details). Two-sided P<0·05 was considered to be statistically significant.
Results
Literature search
A total of 4877 articles were retrieved: 989 from Medline, 2324 from Embase and 1564 from the Cochrane trial register. Following first and second pass screening, twenty studies were eligible for inclusion, resulting in 2106 participants for the meta-analysis( Reference Juanola-Falgarona, Salas-Salvadó and Ibarrola-Jurado 28 – Reference Meckling, Sullivan and Saari 47 ). Details for the screening steps and reasons for exclusion are shown in Fig. 1.
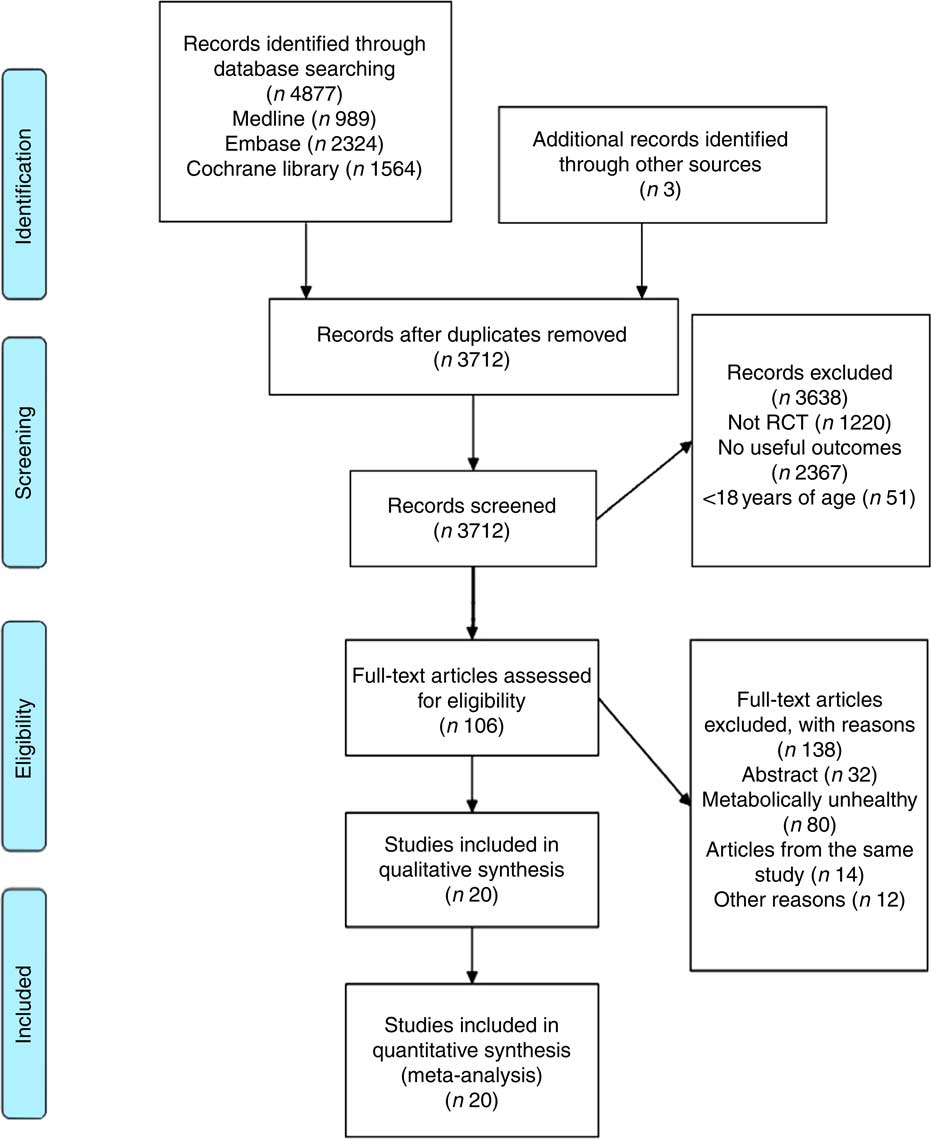
Fig. 1 Flow chart for article selection process. RCT, randomised controlled trial.
Characteristics of studies included
Included studies were published between 1993 and 2014 and intervention duration ranged from 6 weeks to 2 years. Most of the trials were conducted in USA (n 12). All participants were adults aged≥18 years old and BMI≥25 kg/m2. Five of the studies were conducted exclusively on women. The proportion of energy from fat in low-fat diet ranged from 12 to 30 %, whereas carbohydrate ranged from 52 to 65 %. There were twelve trials with restricted energy intake in both diets. The number of included studies reporting on outcomes of interest were as follows: BW (n 14), SBP and DBP (n 10), plasma LDL-cholesterol (n 18), HDL-cholesterol (n 18), TC (n 16), TAG (n 19), plasma insulin (n 14), plasma glucose (n 14), leptin (n 5), adiponectin (n 3) and Hs-CRP (n 7) respectively. Nine of the included studies scored≥4 of the JADAD score, no study scored less than 2 points (Table 1). No obviously high risk of bias was found (Fig. 2).
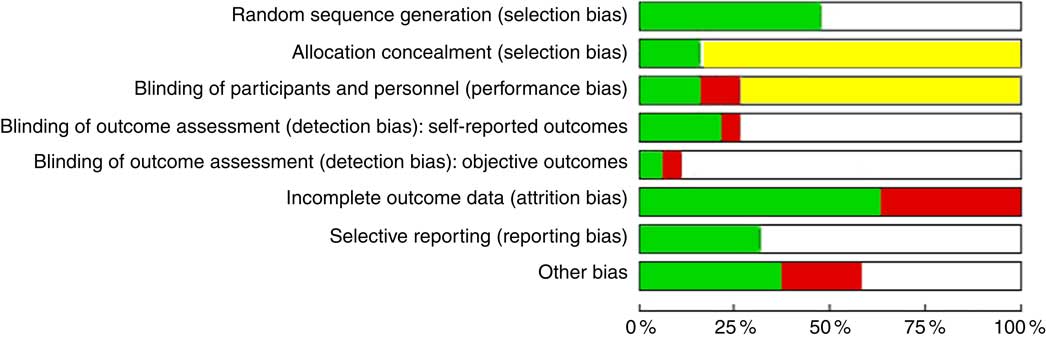
Fig. 2 Summary of risk of bias within the included studies across the six domains: selection bias; performance bias; detection bias; attrition bias; reporting bias; and other bias(
Reference Wildman, Muntner and Reynolds
22
). The proportion of included studies with each judgement:![]() , low risk of bias;
, low risk of bias;![]() , unclear risk of bias;
, unclear risk of bias;![]() , high risk of bias.
, high risk of bias.
Table 1 Characteristics of randomised controlled trials included (Percentages and numbers)

* Total number of participants without drop-out.
† JADAD score was graded by modified JADAD score method.
‡ Atkins low-carbohydrate diet, a maximum intake of 20 g carbohydrate/d at the first 2 weeks and then subjects were permitted to increase their intake of carbohydrate to 40–60 g/d only if self-testing of urinary ketones continued to indicate ketosis.
§ Danish diet, usual diet of the Danes.
The effects of low-fat diet compared with high-fat diet on cardiometabolic indicators
A more pronounced reduction of TC and LDL-cholesterol was found after following a low-fat diet compared with high-fat diets: WMD −7·05 mg/dl (−0·18 mmol/l; 95 % CI 11·30, −2·80; P=0·001) and −4·41 mg/dl (−0·11 mmol/l; 95 % CI −7·81, −1·00; P=0·011), respectively. Conversely, HDL-cholesterol was lower and TAG higher after the low-fat diet compared with high-fat diets: WMD were −2·57 mg/dl (−0·07 mmol/l; 95 % CI 3·85, −1·28; P<0·001) and 11·68 mg/dl (0·13 mmol/l; 95 % CI 5·90, 17·45; P<0·001), respectively. Low-fat diet was also associated with higher DBP compared with high-fat diets, the WMD was 2·18 mm Hg (95 % CI 0·74, 3·62; P=0·003). There appeared to be no significant difference between low-fat and high-fat diets on: BW (P=0·548), SBP (P=0·114), plasma glucose (P=0·347), plasma insulin (P=0·106), leptin (P=0·679), Hs-CRP (P=0·623) or adiponectin (P=0·100) (Table 2) (Fig. 3).
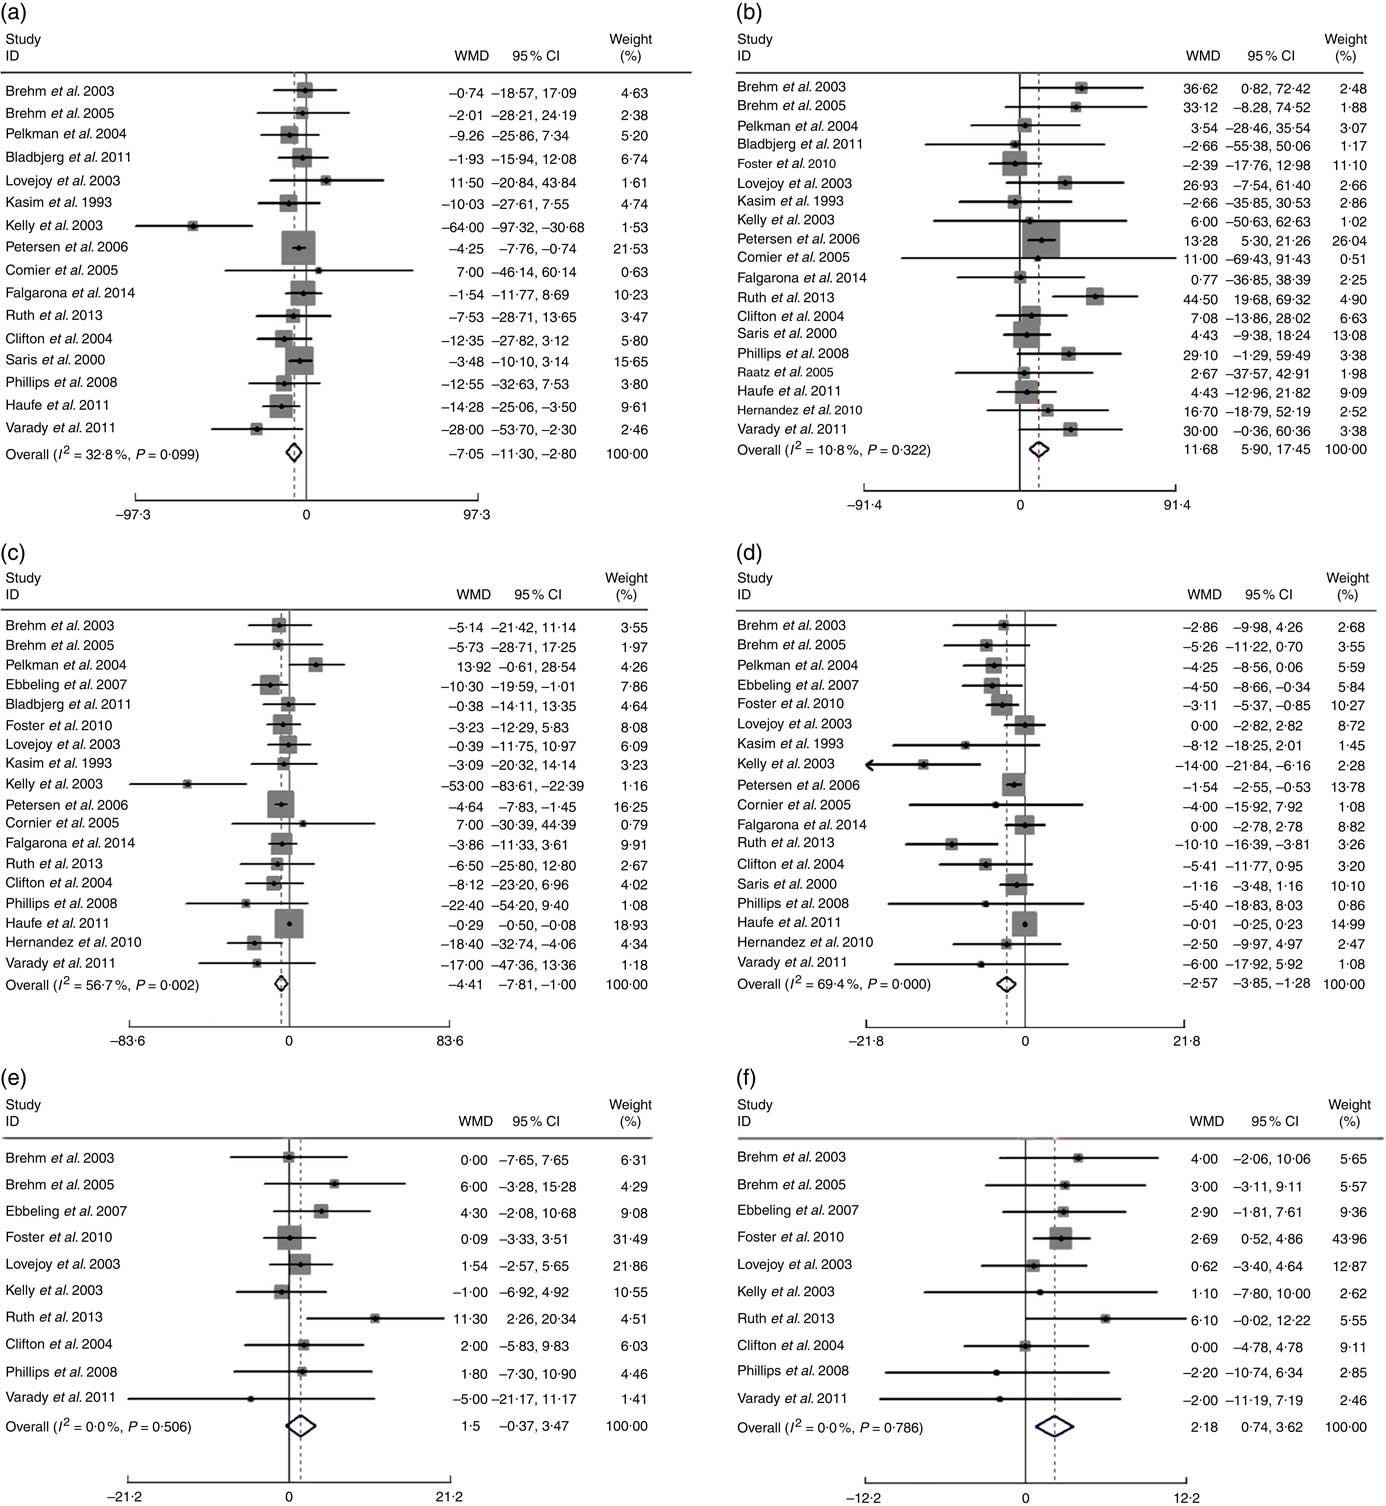
Fig. 3 Effects of low-fat diets compared on high-fat diets on: (a) total cholesterol (TC), (b) TAG (mg/dl), (c) LDL-cholesterol, (d) HDL-cholesterol (mg/dl), (e) systolic blood pressure (SBP) and (f) diastolic blood pressure (DBP) (mmHg). The pooled weighted mean differences (WMD) and 95 % CI are shown in the forest plot. WMD was determined with a random-effects model. For TC, TAG, LDL-cholesterol, SBP, DBP, WMD>0 means favours low-fat diet, for HDL-cholesterol, WMD>0 means favours high-fat diet. Weights are from random-effects analysis.
Table 2 Pooled estimates for the effects of low- v. high-fat diet on cardiometabolic indicatorsFootnote * (Effect size (ES) of weighted mean difference and 95 % confidence intervals)
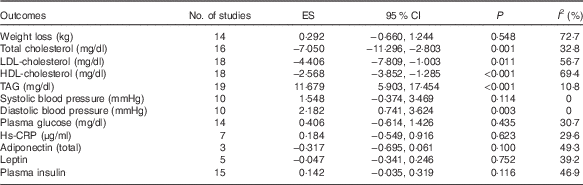
* ES>0 means low-fat diet increased the indicator when compared with high-fat diets; ES <0 means low-fat diet decreased the indicator when compared with high-fat diets; ES=0 means low-fat diet makes no difference to the indicator when compared with high-fat diets. P value is P for ES.
Subgroup and meta-regression analysis
Low heterogeneity between studies was detected for TAG (I 2=10·8 %), SBP (I 2=0 %) and DBP (I 2=0 %). Moderate heterogeneity were found in TC (I 2=32·8 %), plasma insulin (I 2=42·9 %), plasma glucose (I 2=25·8 %), leptin (I 2=25·1 %), Hs-CRP (I 2=29·6 %) and adiponectin (I 2=49·3 %). High heterogeneity were found in LDL-cholesterol (I 2=56·7 %), HDL-cholesterol (I 2=69·4 %) and BW (I 2=72·7 %).
For the studies that measured TC, TAG, HDL-cholesterol, LDL-cholesterol, subgroup analyses found that the following factors confounded the effects of low-fat diet compared with high-fat diet: drop-out rate>20 % and the JADAD score <4, P values of these four indicators remained significant only when drop-out rate <20 % and the JADAD score>4. The proportion of dietary fat on the high-fat diet was also a source of heterogeneity and for studies where dietary fat≥45 %, there was a greater change for the size effects of TAG (WMD: 35·26 mg/dl; 95 % CI 20·15, 50·36; P<0·001) and BW (WMD: 3·98 kg; 95 % CI 2·25, 5·72; P<0·001) on the low-fat diet compared with high-fat diet. Compared with high-fat diet, the reduction of LDL-cholesterol was more marked when carbohydrate percentage≤55 % in low-fat diet (WMD: −6·87 mg/dl; 95 % CI −11·20, −2·54; P=0·002). When female percentage≤80 %, fasting plasma glucose was greater after low-fat diet compared with high-fat diet (P=0·002). However, most of the heterogeneity were only partly explained by subgroups (Tables 3 and 4).
Table 3 Subgroup and meta-regression analysis of body weight (BW), plasma insulin and plasma glucose concentrations (Pooled effects and 95 % confidence intervals)
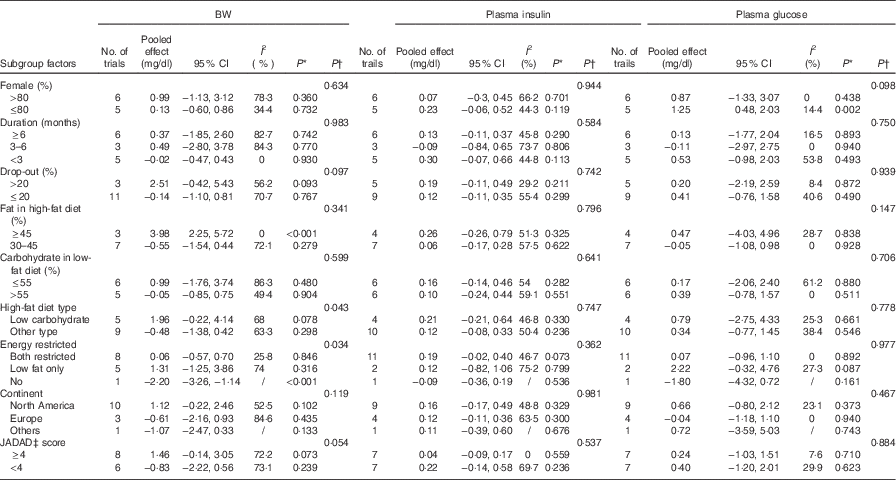
WMD, weighted mean differences.
* P for effect size; it was calculated with a random effect model with weighted mean difference.
† P for univariate meta-regression analysis. WMD was used as the dependent variables and the se (WMD) as variable name.
‡ JADAD score were graded by modified JADAD score method.
Table 4 Subgroup and meta-regression analysis of total cholesterol (TC), TAG, LDL-cholesterol and HDL-cholesterol plasma concentrations (Pooled effects and 95 % confidence intervals)
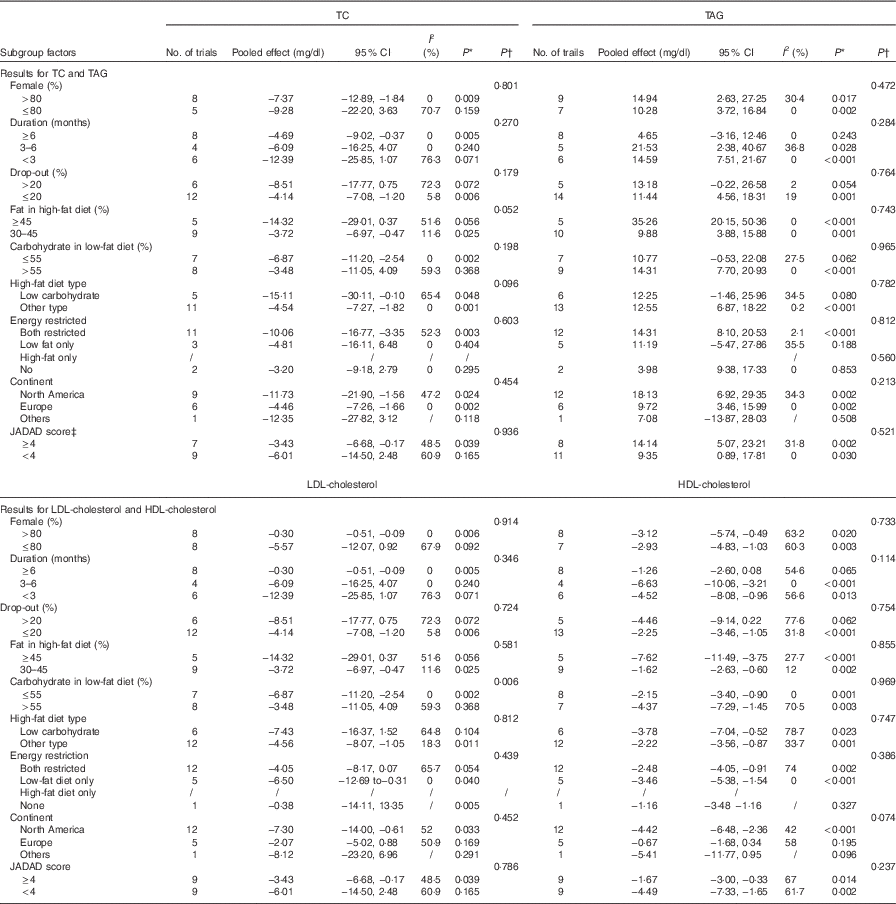
* P for effect size; it was calculated with a random effect model with weighted mean difference·
† P for meta-regression analysis.
‡ JADAD score were graded by modified JADAD score method.
Sensitivity analysis and publication bias
Sensitivity analysis showed there was no apparent difference for the pooled estimate of the WMD for the effects of low-fat diet on BW, HDL-cholesterol, TC, TAG, SBP, DBP, or LDL-cholesterol after any one study was removed (online Supplementary Fig. S1–S12). The results for Begg’s rank correlation test and Egger’s linear regression test indicated that there were no obvious publishing bias detected in the meta-analysis of BW, TC, TAG, SBP, DBP, LDL-cholesterol, plasma insulin, leptin, Hs-CRP and adiponectin. Publication bias may exist for HDL-cholesterol and plasma glucose according to Egger’s linear regression test (P<0·001), however, it was not evident from the Begg’s rank correlation test (P=0·820, P=0·477) (Table 5 and online Supplementary Fig. S13–S36). After further analysed by the trim and fill method, there were no articles indicated to be trimmed, which suggests little evidence for publication bias.
Table 5 P values of publication bias tests
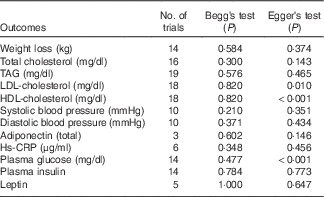
Hs-CRP, high-sensitivity C-reactive protein.
Discussion
To our knowledge, this is the first meta-analysis to systematically compare the effects of low-fat diet with high-fat diet in people who are metabolically healthy but are overweight or obese. This is important for contributing to understanding what factors may be involved in the transition from a metabolically healthy profile to a metabolically unhealthy profile and consequently increase disease risk. Findings of this meta-analysis suggests that short- to medium-term (6 months–2 years) intake of low dietary fat compared with high dietary fat was associated with lower plasma TC and LDL-cholesterol. Conversely, low-fat diet was associated with a more unfavourable change in TAG, HDL-cholesterol and DBP compared with high-fat diet. There appeared to be little impact of the low-fat diet on other cardiometabolic risk factors compared with high-fat diet including BW, SBP, plasma insulin, plasma glucose, leptin, adiponectin and Hs-CRP. These results should be explained cautiously.
Metabolic phenotype with excess adiposity
The results of this meta-analysis are consistent with that of Schwingshackl & Hoffmann’s( Reference Schwingshack and Hoffmann 9 ), who compared low-fat diets with high-fat diets in overweight and obese populations without screening of metabolic status, and the results found low-fat diets were associated with lower TC and LDL-cholesterol levels, whereas high-fat diets were associated with lower TAG level and higher HDL-cholesterol level. However, WMD of all of the four blood lipid indicators were more remarkable in the present meta-analysis than Schwingshackl & Hoffmann’s( Reference Schwingshack and Hoffmann 9 ), which suggests that overweight and obese populations with healthy metabolism have a more distinct reaction to dietary fat than those metabolically unhealthy people.
Suppressing the conversion from metabolically healthy to metabolically unhealthy obesity
Epidemiological studies have shown that MHO populations are at a lower risk of some chronic diseases and lower all-cause mortality than metabolically unhealthy obese (MUO)( Reference Das, Ma and Sharma 17 , Reference Harmer and Stamatakis 48 , Reference Eckel, Meidtner and Uhlmann 49 ), it is therefore, meaningful to find methods to stop the transition from MHO to MUO. Soriguer et al.( Reference Soriguer, Gutierrez-Repiso and Rubio-Martin 50 ) have found that after a 6-year’s follow-up, about 37 % of the MHO population transformed to MUO, a recent longitudinal study also indicate that MHO is an intermediate stage to MUO( Reference Appleton, Seaborn and Visvanathan 51 ). A prospective study reported that a healthy lifestyle helps to maintain a favourable cardiometabolic profile and thus counterbalance the risk of transition from MHO to MUO( Reference Schroder, Ramos and Baena-Dıez 20 ). According to these results, macronutrient composition of the diet, including the amount and the type of dietary fat may play an important role in maintaining metabolic healthy status in people with excess adiposity. However, according to the results of the present meta-analysis, it is unclear what role dietary fat may play in the transition from MHO to MUO.
Dietary fat and body weight
In this meta-analysis that included participants with excess adiposity and who were metabolically healthy, significant difference between low-fat diets and high-fat diets on weight loss was not found. Besides, no remarkable differences between low-fat diets and high-fat diets were found for either leptin or adiponectin in the present study (Table 2). Both leptin and adiponectin are well known to be inversely correlated with BW( Reference Yatagai, Nagasaka and Taniguchi 52 , Reference Hotta, Funahashi and Bodkinet 53 ), leptin represses food intake and increases food expenditure to regulate BW( Reference Friedman 54 – Reference Pelleymounter, Cullen and Baker 57 ). These results are consistent with pooled data from RCT, which showed that low-fat diet have little effect on weight loss during long-term intervention of more than 12 months( Reference Tobias, Chen and Manson 58 )compared with high-fat diet. However, another meta-analysis concluded RCT and cohort studies found that diets low in total fat were associated with lower relative BW( Reference Hooper, Abdelhamid and Moore 59 ) compared with high-fat diets. These disparate results may be because of the different type of dietary fat and different duration of intervention. As most of the experimental diets were energy restricted, both the low-fat diets and high-fat diets should be effective for weight loss, however, the potential benefits of the high-fat diet may because of the greater satiety. Besides, most of the high-fat diets were also low carbohydrate diets, low carbohydrate diets have been reported to be good for weight loss( Reference Sondike and Copperman 60 – Reference Spieth and Harnish 62 ). So further studies that aim to compare the effects of low-fat diet with high-fat diet on weight loss should control the percentage of carbohydrate between the two diets.
Dietary fat and CVD
The proportion of dietary fat in the low-fat diets in this review is consistent with the latest American Dietary Guidelines recommendation on fat intake. In this meta-analysis, high-fat diets were found to be favourable for TAG (P<0·001) and HDL-cholesterol (P<0·001), and these results are also consistent with the studies including metabolically heterogeneous groups of participants( Reference Nordmann, Nordmann and Briel 63 – Reference Kodama, Saito and Tanaka 65 ). In patients with type 2 diabetes, high-fat diet was also associated with lower TAG level and higher HDL-cholesterol level compared with low-fat diet( Reference Briel, Ferreira-Gonzalez and You 66 ). As TAG and HDL-cholesterol levels are important indices for CVD risk, each 10 mg/dl (0·26 mmol/l) increase of HDL-cholesterol is associated with a decreased CHD risk of 29 %( Reference Laragh 67 ). The present meta-analysis found that high-fat diets can bring an average increase of HDL-cholesterol concentration of 2·57 mg/dl (0·066 mmol/l) compared with a low-fat diet which means a relative risk reduction for CVD of 7·45 %.
The improvement in TAG after following a high-fat diet may be linked to an increased intake of PUFA which have been demonstrated to be favourable for reducing TAG and VLDL-cholesterol as well as increasing HDL-cholesterol. For example, EPA can reduce serum levels of TAG by inhibiting the activity of fat synthetase and reducing fatty acids for synthesising TAG. Besides, n-6 PUFA can inhibit the expression of stearyl coenzyme A desaturation enzyme in adipocytes, which is also an important enzyme in the synthesis of TAG.
Interestingly, subgroup analysis by geographical location in the present meta-analysis found greater effect sizes for low-fat diets compared with high-fat diets on serum levels of TC and TAG of trials conducted in North America than in Europe; and for LDL-cholesterol and HDL-cholesterol, those trials conducted in Europe lost statistical significance. Dietary sources of fat often vary between Europe and North America which may further hint towards an effect of fat type as a source of heterogeneity. A limitation of this review is that most of the studies included in this meta-analysis did not analyse the type of fat. Future studies should consider the effect of types of dietary fat on cardiometabolic changes in dietary intervention studies.
Strengths and weaknesses of the article
The strengths of this meta-analysis and systematic review is the large sample size ,with little publication bias evident, which permitted analysis using meta-regression to investigate the potential sources of heterogeneity. The limitations of the present study include: the lack of detailed information on the type of dietary fat which prohibited the analysis of the mechanisms between fat-type and cardiometabolic risk factors; the lack information on blinding within studies which increases the risk of bias and similarly the bias introduced into several studies by the high (>20 %) attrition rate; and the heterogeneity can only be partly explained through the meta-regression performed indicating other unknown factors account for the findings for some parameters.
Conclusion
This meta-analysis found that people who are overweight/obese but metabolically healthy, exhibit some metabolic changes after dietary fat manipulation. This is mostly characterised by an overall decrease in plasma TC, LDL-cholesterol, HDL-cholesterol and an increase in TAG following low-fat diets compared with high-fat diets. Future studies are needed to focus on the influences of different types of fat. More high-quality RCT for low-fat diet v. high-fat diet on metabolically healthy overweight and obese are warranted to inform dietary guidelines.
Acknowledgements
This study was supported by the National Basic Research Program of China (973 Program: 2015CB553604) and by National Natural Science Foundation of China (NSFC: J20121077).
M. L. and Y. W. performed the database research and data analysis; M. L. wrote the paper; C. E. H., B. Y. and D. L. helped with interpretation of the results and the drafting of the final manuscript.
None of the authors has any conflicts of interest to declare.
Supplementary material
For supplementary material/s referred to in this article, please visit https://doi.org/10.1017/S0007114517002902


