


Although many people in North America and Europe are aware of the importance of eating plenty of fruits and vegetables and intend to do so, most people eat substantially fewer fruits and vegetables than recommended( Reference Blanck, Gillespie and Kimmons 1 ). Several national food guides, such as Eating Well with Canada’s Food Guide( 2 ) and My Plate( 3 ), promote 3·5–5·0 cups or 7–10 servings of fruits and vegetables daily for adults. However, only 40·6 % of Canadians reported eating fruits and vegetables five or more times daily in a recent analysis of the Canadian Community Health Survey 2012( 4 ) and disappearance has changed little since 1980( 5 ). Reasons for low intake have been explored in previous research, and include low taste perception and other sensory factors, lack of time and inconvenience associated with preparing vegetables, low food preparation skills, costs and seasonality issues, and perishability( Reference Brug, Debie and van Assema 6 – Reference Uetrecht, Greenberg and Dwyer 8 ).
The consumption of deep yellow and orange vegetables, deep green leafy vegetables and cruciferous vegetables is of particular concern( Reference Krebs-Smith and Kantor 9 , Reference Guthrie, Lin and Reed 10 ). For example, disappearance data showed an average of 64 kg fresh equivalent potatoes used in 2009, while use of broccoli was 2·89 kg and Brussels sprouts was only 0·14 kg (not counting waste)( 5 ). These vegetables are excellent sources of carotene, vitamin C and folate, and some have been associated with decreased cancer and CVD( 11 – Reference Boeing, Bechthold and Bub 14 ). Thus, there is a need to help consumers overcome specific barriers to consuming these vegetables. However, most previous nutrition research has focused on overall consumption, rather than specific types of vegetables. Better understanding of preferences for specific vegetables by different segments of the population, using methods from marketing, may yield insights that can inform public health and clinical interventions.
Some previous research has focused on the variety of vegetables consumed by individuals( Reference Wolfe, Frongillo and Cassano 15 – Reference Pollard, Greenwood and Kirk 17 ). However, the operationalization of variety as the number of specific vegetables purchased within 1 year does not provide insights into which groups of vegetables are more regularly purchased and eaten by whom. To the best of our knowledge, only Drewnowski( Reference Drewnowski 18 ) has systematically assessed consumers’ perceptions of specific vegetables using perceptual mapping of twenty different vegetables based on three dimensions (i.e. calories, colour and convenience). Findings clearly indicated a great deal of variance in perception of specific vegetables across the three perceptual dimensions. For example, compared with other vegetables (e.g. potatoes and tomatoes), asparagus, cauliflower and broccoli were perceived as lower in calories, greener in colour and less convenient to prepare. However, the perception of different forms of the same vegetables was not assessed (e.g. fresh potatoes v. frozen potatoes). Furthermore, Drewnowski’s( Reference Drewnowski 18 ) perceptual mapping did not address the possibility that perception of specific vegetables may differ substantially across consumers. For example, perception of broccoli and cauliflower may differ substantially between consumers who frequently eat them and those who rarely do. Lastly, differences among specific vegetables in perceptual dimensions (e.g. inconvenience of preparation) were not linked to the frequency or amounts consumed. Given the variance on perception, segmenting on actual consumption of different vegetables may provide new insights.
Focusing on main food preparers may be important in that many types of vegetables require some preparation before eating. Lewin( Reference Lewin 19 ) recognized the important role that main food preparers play in family members’ eating behaviour and referred to them as ‘nutritional gatekeepers’. Good nutritional gatekeepers are capable of changing the taste preferences and eating habits of their family members by planning and preparing healthy and satisfying meals( Reference Wansink 20 ). Segmenting main household food preparers based on the type of vegetables they serve may be contrasted with previous approaches of segmenting consumers based on demographic and/or psychographic variables and overall shopping tendencies( Reference Bertail and Caillavet 21 – Reference Nie and Zepeda 23 ). Although the segmentation approaches employed by previous researchers generated clusters of buyers with distinct personal characteristics and/or overall shopping tendencies, application to vegetable consumption is uncertain.
Food preparers’ personal characteristics, especially their beliefs about foods and meal preparation, are likely important variables associated with cluster membership. Our review of previous research identified four important beliefs about foods and meal preparation that may impact on vegetable consumption. First, convenience orientation in meal planning, defined as ‘the degree to which a consumer is inclined to save time and energy as regards meal preparation’( Reference Candel 24 ) (p. 17), may be relevant. A strong preference for convenience in meal preparation is likely to characterize consumer segments that frequently purchase pre-processed vegetables (e.g. frozen, canned, pre-washed). Second, variety seeking in food choice refers to ‘the motivational factor that aims at providing variation in stimulation through varied food product consumption, irrespective of the instrumental or functional value of the food product alternatives’( Reference Van Trijp and JBEM 25 ) (p. 185). Thus, variety seeking in meal preparation may be an important correlate of the diversity of vegetables prepared and consumed. Third, the lay belief in the negative association between healthiness and tastiness of foods has recently been found to predict consumers’ food choice behaviour( Reference Raghunathan, Naylor and Hoyer 26 ). Lastly, to the extent that most consumers in North America do not shop for their groceries on a daily basis, forward meal planning is likely to be associated with the frequency of preparing diverse types of vegetables (e.g. having specific plans for the next day’s meals). Crawford and colleagues( Reference Crawford, Ball and Mishra 27 ) found that forward menu planning as well as enjoyment of grocery shopping and food preparation were associated with high intakes of vegetables. On the other hand, family intakes of vegetables were low for main food preparers who perceived cooking as a chore, decided what to serve for dinner only a few hours before dinner time, and spent less than 15 min preparing dinner. It should be noted that unlike other personal characteristics described above, the tendency to practise meal planning is a behaviour (i.e. habit) rather than a belief.
In sum, our review of previous research on vegetable consumption indicates that: (i) there is very little research available about the diversity of vegetables consumed in households; and (ii) no systematic research has been done to examine differences in both the perception of specific vegetables and the frequency of preparing and eating them among consumers. In the present study we begin to address these gaps by assessing the heterogeneity of main food preparers based on the frequency of serving specific types of vegetables. Main food preparers’ beliefs about foods and meal planning habit are then examined by segment.
Methods
An online self-report survey design was chosen for the present study. A panel of randomly selected consumers living in Ontario, Canada had been created in 2009 and this panel periodically received food-related surveys to complete. The panel was stratified by sex, age and educational status to reflect the demographic profile of Ontario based on the 2006 Census of Canada. Characteristics of the panel are described elsewhere( Reference Henson, Blandon and Cranfield 28 ).
For the present study, it was necessary to choose a small subset of all possible vegetables for feasibility reasons to differentiate consumers. Market segmentation depends on variation among consumers; neither vegetables that everyone eats nor vegetables few people eat will differentiate segments. Disappearance data were reviewed( 5 ) to identify a few common vegetables consumed in Canada (potatoes and tomatoes), as well as some less common vegetables that were still consumed by a sizeable minority and in different formats. We chose eight vegetables that are widely available: fresh potatoes, frozen potatoes (including oven fries and other forms), fresh and canned tomatoes, broccoli, asparagus, Brussels sprouts, frozen mixed vegetables and mushrooms. Mushrooms are fungi, but share many nutrition features with vegetables (e.g. low energy, low fat), and are most often eaten with other vegetables in meals.
Participants and procedures
Among 4517 panellists who received the invitation email for the survey, 1013 panellists logged into the online survey (i.e. response rate=22·4 %) in the first two weeks of December 2011. Sixteen panellists’ responses were not usable because they skipped too many questions. Since 241 individuals reported preparing less than 50 % of meals in their household, we used data provided by 756 panellists identified as the main food preparers. Panellists who completed the survey were entered into a draw and two winners received $CAN 1000 each.
Once participants provided informed consent, they were asked food frequency questions about the number of times they served the nine specific vegetables in the past two weeks. Canada’s Food Guide servings were listed as a guide( 2 ). Afterwards, they filled out several self-report scales (described in the ‘Measures’ section). Participants also answered miscellaneous questions about their food preparation and cooking techniques (i.e. ‘How much time do you spend to prepare supper at home on typical weekdays?’, ‘How many times did you eat frozen meals or takeaway foods for supper in the past two weeks?’). Participants were also asked where they usually buy vegetables.
Measures
Perceived benefits and obstacles of specific vegetables
Participants were asked to rate each vegetable on taste, healthfulness, ease of preparation and cost (all 7-point Likert scales). For example, perceived taste was assessed with one item: ‘How tasty do you find food prepared from ______?’ (1=‘not at all tasty’; 7=‘tasty’).
Convenience orientation in meal preparation
We used Candel’s( Reference Candel 24 ) scale of convenience orientation in meal planning. This scale consists of six items intended to assess the inclination of saving time and energy in meal preparation (e.g. ‘Preferably, I spend as little time as possible on meal preparation’) on a 7-point scale (1=‘completely disagree’; 7=‘completely agree’). The unidimensionality and construct validity of this scale were satisfactory, and it was cross-validated with a separate sample in Candel’s paper( Reference Candel 24 ). The internal consistency of this scale was high in the current sample (Cronbach’s α=0·86).
Variety seeking in meal preparation
Candel’s( Reference Candel 24 ) measure of variety seeking in meal preparation was used to assess the tendency to prepare a variety of dishes. This scale consists of five items (e.g. ‘I enjoy making new dishes’) measured on a 7-point scale (1=‘completely disagree’; 7=‘completely agree’). Candel( Reference Candel 24 ) demonstrated the discriminant validity of this scale vis-à-vis the convenience orientation scale by identifying separate factors in factor analysis and they had a moderate negative correlation (r=−0·56, P<0·001). The internal consistency of this scale was high in the current sample (Cronbach’s α=0·83).
Meal planning
Since there is no established measure of meal planning, we used four items that were used in Crawford et al.’s( Reference Crawford, Ball and Mishra 27 ) study (i.e. ‘I make specific meal plans for the next several days before I go shopping for groceries’, ‘I write a grocery shopping list to take with me when I shop for food’, ‘When I wake up, I know what I will have for breakfast that day’, ‘I know in the morning what I will eat for dinner that night’). A 5-point scale was used (1=‘almost never’; 2=‘some of the time’; 3=‘half of the time’; 4=‘most of the time’; 5=‘always/almost always’). Exploratory factor analysis showed that the four items loaded on one factor and the internal consistency of this scale was adequate (Cronbach’s α=0·70).
The ‘healthy=not tasty’ belief
We used Raghunathan et al.’s( Reference Raghunathan, Naylor and Hoyer 26 ) scale to assess the strength of the ‘healthy=not tasty’ stereotypic belief. This scale consists of three items (i.e. ‘Foods that are healthy are not as tasty as less healthy foods’, ‘Things that are good for me rarely taste good’, ‘There is no way to make food healthier without sacrificing taste’) measured with a 7-point scale (1=‘completely disagree’; 7=‘completely agree’). The internal consistency of this scale was high in the current sample (Cronbach’s α=0·94).
Data analysis
Latent profile analysis( Reference Lazarsfeld and Henry 29 ) was employed to determine cluster membership (Mplus software)( Reference Muthén and Muthén 30 ). Clusters were compared using either ANOVA followed by Hochberg’s GT post hoc test (SAS version 9·2) or the χ 2 test followed by the Z test for comparison of proportions, assuming the central limit theorem applies, with Bonferroni adjustment for multiple comparisons (IBM SPSS 20). The study was approved by the University of Guelph Research Ethics Board.
Results
On average, our participants included more females (77·5 %), was older in age (40–59 years category: 58·3 %), reported earning higher income (59·9 % earning $CAN 50 000 or more per annum) and was better educated (44·9 % having bachelor’s degree or more) than average Ontario residents. This was due to a relatively low response rate as well as the exclusion of participants who reported preparing less than 50 % of meals in their household.
As expected, the overall frequency of serving fresh tomatoes and potatoes was the highest and frequency of consumption of frozen potatoes, asparagus and Brussels sprouts was the lowest (see Table 1). Also as expected, perceptions of different vegetables differed in terms of taste, healthiness, ease of preparation and cost (see total column, Table 2).
Table 1 Mean frequency of serving eight vegetables and mushrooms per three clusters of main food preparers identified from latent profile analysis (in the past two weeks), Ontario, Canada, 2011

d, Cohen’s d effect size.
Thirty-six participants were not classified into any cluster because of missing values on the frequency of serving one or more vegetables. For each vegetable, participants were asked ‘How often did you serve foods prepared from _____ in your household during the last two weeks?’ The response options included ‘I have never served foods prepared from ____ in my life’ (−1), ‘I have not served foods prepared from _____ in last two weeks’ (0), ‘once’ (1), ‘2–3 times’ (2), ‘4–5 times’ (3), ‘6–7 times’ (4), ‘almost every day’ (5). Response to this item was recoded to the number in parentheses next to each response option.
a,b,cMean values within a row with unlike superscript letters were significantly different based on Hochberg’s GT2 test (P≤0·01).
Significant F statistic: *P<0·05.
Table 2 Comparison of mean perception ratings of vegetables across consumer segments, Ontario, Canada, 2011
d, Cohen’s d effect size.
Perceptions rated on a scale of 1=‘not at all’; 4=‘neutral’; 7=‘very xxxx or similar’.
a,b,cMean values within a row with unlike superscript letters were significantly different based on Hochberg’s GT2 test (P≤0·05).
Significant F statistic: *P<0·05, **P<0·01.
Segmentation and hypothesized predictors of segments
First, to determine the number of clusters that best fit the data, we ran the baseline model in which the frequency of serving the nine types of vegetables was used as indicators of latent clustering. Following Muthén’s( Reference Muthén 31 ) recommendation, we conducted a series of Lo–Mendell–Rubin (LMR) adjusted likelihood ratio tests( Reference Lo, Mendell and Rubin 32 ). The LMR ratio for the two- v. three-cluster model was significant (LMR ratio=127·83, P<0·001), but the ratio was no longer significant for the three- v. four-cluster model (LMR ratio=70·04, P=0·53). Thus, the three-cluster solution was determined to fit the data better than either the two-cluster solution or the four-cluster. Once the number of clusters was decided from the baseline model, we ran the covariate model, in which convenience orientation in meal preparation, variety seeking in meal preparation, meal planning and the ‘healthy=not tasty’ belief were entered as predictors of the latent cluster membership (see Fig. 1 for a schematic view of the model). This part of the latent profile analysis is equivalent to a multinomial logistic regression analysis.
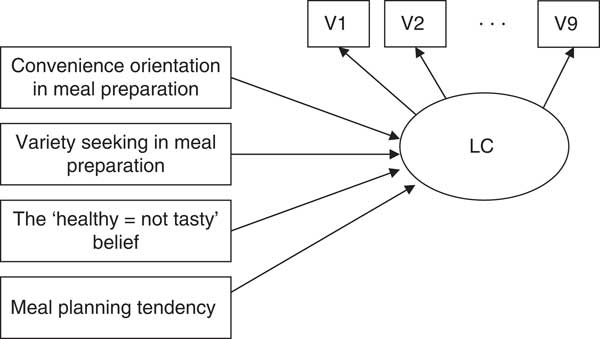
Fig. 1 A schematic view of the latent profile model. Note: LC refers to latent clusters of main food preparers to be estimated from the frequency of serving the nine vegetables (denoted by V1, V2, …, V9), which are used as the base of segmentation. The four variables shown to the left of the LC circle are a priori predictors of latent clustering
The mean estimates of the frequency of serving the nine types of vegetables for each buyer cluster are reported in Table 1. Cluster 1 reported the greatest frequency of serving all the fresh vegetables and was characterized by a higher frequency of serving broccoli and Brussels sprouts, as well as asparagus. Thus it was named ‘crucifer lovers’ (n 95, 13·3 %). In contrast, cluster 2 was characterized by the highest frequency of serving frozen potatoes and frozen mixed vegetables and the lowest frequency of serving fresh vegetables and canned tomatoes. Thus, cluster 2 was labelled ‘frozen vegetable users’ (n 239, 33·2 %). Lastly, cluster 3 was in-between in the frequency of serving both frozen and fresh vegetables. Thus, cluster 3 was named ‘average consumers’ (n 386, 53·6 %). Thirty-six participants could not be classified into any cluster because of missing values on the frequency of serving one or more vegetables.
Multinomial logistic regression results showed that membership to the three clusters was significantly predicted by beliefs about foods and meal planning (see Table 3). Each of convenience orientation, variety seeking and ‘healthy=not tasty’ belief was scored on a 7-point scale while more meal planning was scored on a 5-point scale. For one-unit increase in ‘healthy=not tasty’ belief the OR for membership to the frozen vegetable user cluster v. the average consumer segment was 1·49 (see Table 3). On the other hand, convenience orientation in meal preparation was a significant negative predictor of membership to the crucifer lover segment v. the average consumer segment (OR=0·74). Meal planning was not a significant predictor of cluster membership.
Table 3 Results of logistic regression built in latent profile analysis of consumer segments, Ontario, Canada, 2011
† Each scale scored from 1 to 7 (1=‘low’; 7=‘high’).
‡ Scale scored from 1 to 5 (1=‘never’; 5=‘always’).
Other characteristics of the consumer segments
Demographically, the crucifer lovers and frozen vegetable users differed on age distribution and percentage who worked. Crucifer lovers were more likely to be older, with 34·7 % aged 60–69 years, compared with 15·9 % of frozen vegetable users (P<0·05). Only 54 % of crucifer lovers were working in the past month compared with 72 % of frozen vegetable users (P<0·05). Average consumers had intermediate values. Average consumers were less likely to have annual household income <$CAN 50 000 (12·5 %) compared with the other two groups (crucifer lovers 23·1 % and frozen vegetable users 21·9 %; P<0·05). With respect to shopping behaviour, the most striking difference was use of farmers’ markets by 52·6 % of crucifer lovers, compared with 37·1 % of average consumers and 18·0 % of frozen vegetable users (all P<0·05). There were no significant differences by sex, ethnicity, household size, educational level, marital status or community size across the three segments.
A series of one-way ANOVA with the cluster membership as the independent variable were conducted to analyse meal preparation behaviours (see Table 4). Both the crucifer lover segment and the average consumer segment reported spending significantly more time preparing supper at home in the past two weeks than the frozen vegetable user segment. However, nearly half of all respondents (49 %) ate supper together 7 d/week and this did not differ by segment (data not shown). In terms of cooking, crucifer lovers were more likely to use diverse methods, while frozen vegetable users rarely used stir-frying or roasting (Table 4). Furthermore, the mean importance of buying local vegetables was significantly higher for the crucifer lover segment than for the average consumer segment, followed by the frozen vegetable lover segment (Table 4).
Table 4 Comparison of the three segments of main food preparers, Ontario, Canada, 2011
a,b,cMean values within a row with unlike superscript letters were significantly different based on Hochberg’s GT2 multiple comparisons (P≤0·05). Percentage values within a row with unlike superscript letters were significantly different in pairwise comparisons by Z test (P≤0·05), using a Bonferroni adjustment for multiple comparisons.
Significant F statistic: **P<0·01, ***P<0·001.
† ’In a typical week, how much time do you spend to prepare supper at home on weekdays?’ (1=‘5 min or less’; 2=‘6–16 min’; 3=‘16–30 min’; 4=‘31–45 min’; 5=‘46–60 min’; 6=‘more than 1 h’).
‡ ‘How many times did you eat frozen meals or takeaway foods for supper in the past two weeks?’ (1=‘never’; 2=‘once’; 3=‘2–3 times’; 4=‘4–5 times’; 5=‘6–7 times’; 6=‘almost every day’).
§ ‘Looking back the last two days, how many servings of vegetables and fruits did you eat a day?’ (1=‘0 serving’; 2=‘1 serving’; 3=‘2 servings’; 4=‘3 servings’; 5=‘4 servings’; 6=‘5 servings or more’).
|| Of thirty-five possible cooking methods typically used across nine vegetables, the percentage of methods reported to have been used in the past two weeks by more than 25 % of the group.
¶ Importance questions: 1=‘not at all important’; 7=‘extremely important’.
Differences in perception of vegetables across segments
Next, we compared perception of vegetables in terms of taste, healthiness, ease of preparation and cost across the three segments (see Table 2). There were no significant differences in healthiness ratings of the vegetables across the three segments at P≤0·05 (data not shown). The perception of canned tomatoes, frozen potatoes and mixed vegetables did not differ significantly across the three segments (data not shown). In contrast, there were marked differences in perception of fresh produce. Brussels sprouts were rated significantly tastier, easier to prepare and more inexpensive by the crucifer lover segment than the average buyer segment, followed by the frozen vegetable user segment. A similar pattern was found for mushrooms, asparagus and broccoli, although the differences between segments were not as marked among these vegetables compared with Brussels sprouts. On the other hand, significant differences in the perception of fresh tomatoes and potatoes were limited to the ease of preparation and cost. These two vegetables were considered significantly easier to prepare and more inexpensive by crucifer lovers than by average consumers, followed by frozen vegetable users. A similar pattern was found for perceived cost although the difference between segments was not as marked as for the ease of preparation.
Discussion
Segmentation of consumers is a common strategy for identifying subgroups in the population for marketing or health promotion efforts. Application of this method to identify segments by self-reported consumption of specific vegetables was novel. There was substantial heterogeneity in the variety and amount of vegetables prepared and served and this heterogeneity was significantly associated with beliefs about foods and orientation to meal preparation. Three segments of main food preparers were identified by our latent profile analysis: the crucifer lover segment (13 %), the average consumer segment (54 %) and the frozen vegetable user segment (33 %). Furthermore, the three segments differed on meal preparation and vegetable shopping behaviours, overall vegetable intakes and some demographic variables. Lastly, there were significant differences in the perception of vegetables’ taste, ease of preparation and cost across the three segments, but not healthiness. If confirmed, the results may be helpful for health promotion efforts, as they suggest strategies should be tailored to different segments and vegetables.
Overall, our findings indicate that the frequency of serving specific vegetables provides an adequate base for segmenting main food preparers. Our segmentation approach is similar to the practice of segmenting consumers based on the frequency of product usage( Reference Wind 33 ) in marketing research. Compared with segmentation based on psychographic variables, such as life cycle or health motives( Reference Geeroms, Verbeke and Kenhove 22 , Reference Nie and Zepeda 23 ), this approach to segmentation offers the benefit of identifying segments that are maximally different from one another in terms of reported frequency of serving specific vegetables. This feature is highly advantageous for health professionals and social marketers interested in designing tailored strategies for specific types and forms of vegetables.
Our findings suggest that separate strategies for increasing the consumption of specific vegetables, like Brussels sprouts or broccoli, may be necessary to appeal to different segments. Given that frozen vegetable users perceive all vegetables as healthy, yet eat less, they may be more likely to try these vegetables when they are exposed to messages that emphasize ease of preparation or taste attributes than messages that focus on healthiness. For example, recipes based on frozen convenience packaging may be better received. On the other hand, since the average consumer segment already perceives that asparagus and broccoli are quite tasty and easy to prepare, the appropriate strategy may be to provide more novel recipes to boost consumption further. In contrast, our findings suggest that separate strategies for different segments are not necessary to increase fresh potatoes and tomatoes, as perception of these vegetables was relatively positive and homogeneous across the segments. This demonstrates the advantage of segmentation based on the frequency of serving vegetables in guiding health marketing strategies tailored for specific vegetables. Additional work is needed to better define segments in differing populations for specific vegetables.
Another important finding from our study is the importance of main food preparers’ convenience orientation and variety seeking in meal preparation. Although there may be several reasons for high convenience orientation and low variety seeking in meal planning exhibited by frozen vegetable users (and less so by average consumers), limited meal preparation skills appears to be one of the important reasons. The three segments extracted from the current study share some resemblance to the three clusters of cooks identified from a qualitative study of low-income communities in the UK( Reference Stead, Caraher and Wrieden 34 ). Specifically, similar to our crucifer lovers, ‘confident cooks’ had adequate skills for preparing healthy meals but needed family members’ encouragement to serve more vegetables. ‘Basic but fearful cooks’ are similar to our average consumer segment, in that they had anxiety about going beyond familiar dishes that matched their current meal planning skills. Lastly, similar to our frozen vegetable user segment, ‘useless and hopeless cooks’ relied heavily on frozen and pre-prepared foods and lacked general food preparation and organization skills. This similarity suggests, as recently reported by Winkler and Turrell( Reference Winkler and Turrell 35 ), that confidence in meal preparation and food skills are key to substantial increase in the consumption of various vegetables, regardless of income and socio-economic status.
Furthermore, our finding that the lay belief that healthy foods tend not to be tasty predicted membership to the frozen vegetable user segment is alarming. Main food preparers who strongly hold this belief are likely to pass it to their young family members. Future research is necessary to develop interventions to reduce this belief.
Overall, all of the fresh vegetables were considered very healthy and there was no significant difference in the healthiness rating across the three segments. However, the uniform high rating of healthiness was contrasted by greater variances in the perception of taste and the ease of preparation among fresh vegetables, especially Brussels sprouts. Our findings suggest that strategies for increasing the consumption of Brussels sprouts and other unfamiliar vegetables should be focused on how these vegetables can be transformed into dishes that provide satisfying sensory experiences (e.g. taste and texture) by providing easy-to-follow recipes.
The present study is not without its limitations. First, the nine foods used as the base of segmentation in the study are not representative of all vegetables. In addition, although the panel we used was stratified to represent Ontario residents in terms of sex, age, education and income, a relatively low response rate resulted in our participants being educated consumers with higher incomes than the average Ontario population. However, interested main food preparers are likely a core target group for any planned interventions. Additional studies are necessary to replicate the general characteristics of the three segments among main food preparers based on more vegetables and in other samples.
Another issue is the possible seasonal differences in the availability and quality of some vegetables. For example, the availability, price and quality of asparagus is more favourable in spring than in other seasons in Ontario, and the preparation and consumption of this vegetable may fluctuate substantially across seasons. Although most vegetables are available throughout the year to many consumers in developed countries, seasonality is an important issue to consider when assessing the frequency of vegetable consumption.
Lastly, the limitations of self-reported food frequency and portion size estimation methods are well known( Reference Mikkelsen, Olsen and Rasmussen 36 ). Our data rely on participants’ recall of the frequency of vegetables served in the past two weeks, based on traditional Block or Willett FFQ methods. Newer methods of assessing food intake using biomarkers and other methods should be considered in future studies and may combine increased convenience with improved accuracy( Reference de Boer, Slimani and van’t Veer 37 , Reference Woodside, Young and McKinley 38 ).
Conclusion
Findings from the current study indicate that there is a substantial heterogeneity in the variety and amount of vegetables prepared and served and that this heterogeneity is significantly associated with beliefs about foods and orientation to meal preparation. Practical implications of our findings are twofold. First, it is recommended that researchers and practitioners assess the preparation and intake of specific vegetables in order to identify the type of vegetables that individuals rarely eat. To the extent that frequent intake of diverse vegetables, including cruciferous and dark red and yellow vegetables, is essential to healthy eating, it is important to identify the type of vegetables that are rarely eaten and to develop strategies to reduce barriers to frequent consumption of difficult vegetables. Second, our findings suggest that tailored social marketing approaches can be used to help different consumer segments overcome their unique challenges to increasing the consumption of specific vegetables.
Acknowledgements
Financial support: This research was supported by the OMAFRA (Ontario Ministry of Food and Rural Affairs)–University of Guelph partnership programme (‘Food for Health’ track). The funder has no role in the design, analysis or writing of this article. Conflict of interest: None. Author contributions: S.Y. (40 %) developed the overall framework of the current research and all three authors were jointly involved in refining the research question(s), designing the study, carrying it out, analysing the data and writing the article: P.B. (30 %) and V.K. (30 %). Ethics of human subject participation: The study was approved by the University of Guelph Research Ethics Board.


