Fe metabolism has an essential role in mammalian physiological functions. Dysregulation of Fe homeostasis results in diseases characterised by Fe overload (hereditary haemochromatosis) or by Fe depletion (Fe-deficiency anaemia)(Reference Hentze, Muckenthaler and Galy1). Fe overload results in excessive oxidative stress and is detrimental to the function of many organs. In particular, Fe deposition in pancreatic β-cells can impair their function, resulting in the decreased secretion of insulin and the development of diabetes mellitus(Reference Bertelsen, Anggard and Carrier2), a major global public health threat. Increasing epidemiological evidence suggests that Fe overload results in an increased incidence of type 2 diabetes (T2D)(Reference Fernandez-Real, Lopez-Bermejo and Ricart3). Diabetes is also one of the typical presentations of human hereditary haemochromatosis, a disease characterised by elevated serum Fe and ferritin concentrations and excess Fe deposition in major organs including liver, pancreas and heart. Notably, the prevalence of diabetes in hereditary haemochromatosis patients exceeds 20 %(Reference McClain, Abraham and Rogers4).
Hepcidin is the key regulator of systemic Fe levels(Reference Hentze, Muckenthaler and Galy1). Circulating hepcidin binds to ferroportin 1, the only known Fe exporter, and causes its internalisation and degradation in enterocytes and in splenic macrophages(Reference Nemeth, Tuttle and Powelson5). Loss of hepcidin results in failure to down-regulate ferroportin 1, leading to excess Fe absorption and hereditary haemochromatosis(Reference Bridle, Frazer and Wilkins6–Reference Nemeth, Roetto and Garozzo8). Hepcidin is mainly synthesised in the liver as an 84-amino acid prepropeptide, processed into a 60- to 64-residue prohepcidin peptide and then finally into the mature and biologically functional 25-amino acid hepcidin(Reference Hunter, Fulton and Ganz9).
Serum ferritin concentrations are widely used as a clinical biomarker for evaluating body Fe status in epidemiological studies. Several studies have shown that serum ferritin concentrations are increased in T2D patients and relatively high levels of ferritin are associated with increased risks of T2D in healthy individuals(Reference Jiang, Manson and Meigs10, Reference Forouhi, Harding and Allison11). However, how hepcidin concentrations change in T2D patients and whether hepcidin is associated with risks of T2D remain controversial due to the use of assays that are not specific for biologically functional hepcidin in earlier studies. Moreover, sample size has often been small. Moreover, multiple regulatory pathways controlling hepcidin expression and systemic inflammation concurrent with T2D may influence hepcidin expression. In this regard, Fernandez-Real et al. (Reference Fernandez-Real, Equitani and Moreno12) reported that serum prohepcidin concentrations are significantly higher in men with impaired glucose tolerance or T2D than in those with normal glucose tolerance and that prohepcidin concentrations are associated with parameters of glucose and Fe metabolism. However, they also noted that the population sample size in this study was too small (ninety-two normal participants and forty-three patients with altered glucose tolerance) to draw a definitive conclusion. Another study has suggested that the presence of diabetes does not modify hepcidin expression levels in the liver or in adipose tissue(Reference Bekri, Gual and Anty13). In two independent case–control studies, Aso et al. (Reference Aso, Takebayashi and Wakabayashi14) reported that serum prohepcidin concentrations are significantly lower in people with diabetes than in control subjects, yet Jiang et al. (Reference Jiang, Sun and Tang15) reported a significant increase in serum hepcidin levels in people with diabetes associated with higher serum ferritin and IL-6 levels.
The conflicting results from these studies are partially, if not mainly, due to the lack of an accurate assay for biologically functional hepcidin. Previous studies have quantified prohepcidin concentrations in different populations and failed to find significant associations between prohepcidin concentrations and Fe status or absorption(Reference Kulaksiz, Gehrke and Janetzko16–Reference Utzschneider and Kowdley20). This suggests that prohepcidin is a poor marker for evaluating Fe status and absorption(Reference Young, Glahn and Ariza-Nieto21). A more recent study has suggested that the mature form of serum hepcidin is a more sensitive and reliable biomarker for determining Fe absorption and concentrations compared with prohepcidin(Reference Frazer and Anderson22). Thus, we measured serum hepcidin concentrations in a large case–control population. The aim of the present study was to determine (1) whether serum hepcidin concentrations are associated with Fe metabolism parameters such as serum ferritin and Hb concentrations and (2) whether serum hepcidin concentrations are correlated with T2D risk factors. To our knowledge, this is the largest population analysis, to date, to have investigated the association between hepcidin concentrations and T2D.
Materials and methods
Subjects
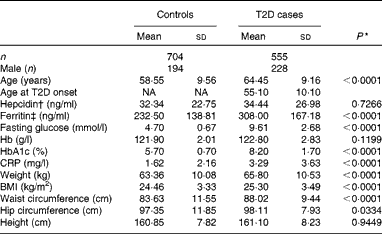
The population analysed in the present study was selected from our previous study(Reference Liu, Zhou and Zhang23), including 555 T2D patients and 704 control participants. All Han Chinese participants in the present study were recruited from Shanghai, China. The eligibility of the participants was defined as those who were residents for at least 20 years in the area and were free of the following conditions: (1) severe psychological disorders, physical disabilities, cancer, history of stroke, CHD, Alzheimer's disease or dementia and (2) tuberculosis, AIDS or other communicable diseases. Home interviews were conducted by trained physicians or public health workers from the Pudong and Baoshan Centers for Disease Control and Prevention and from community hospitals in Shanghai, China. For all individuals, height, weight, hip and waist circumference, and blood pressure were measured by trained medical professionals using a standardised protocol. BMI was calculated as weight (kg)/(height (m))2. The participants gave written informed consent to publish their case details, and the study protocols were approved and reviewed by the ethics committee of the Institute for Nutritional Sciences, Shanghai Institute for Biological Sciences(Reference Liu, Zhou and Zhang23). The present study adhered to the principles of the Declaration of Helsinki. The basic characteristics of the study population are summarised in Table 1.
Table 1 Characteristics of the study population (Mean values and standard deviations)
T2D, type 2 diabetes; NA, not available; HbA1c, glycosylated Hb; CRP, C-reactive protein.
* P values were calculated using the Wilcoxon rank test.
† Serum hepcidin concentration.
‡ Serum ferritin concentration.
Measurements
Serum hepcidin concentrations were determined using a commercially available competitive ELISA according to the manufacturer's instructions (DRG Diagnostics). Serum ferritin concentrations were measured using a human ferritin ELISA kit (DRG Diagnostics). Sample absorbance was measured on a SpectraMax 190 (Molecular Devices). All samples were collected after an overnight fast, when the diurnal fluctuations in hepcidin concentrations were minimised. Hb, C-reactive protein (CRP), glycosylated Hb (HbA1c) and fasting plasma glucose concentrations were measured enzymatically according to standard methods (Roche Diagnostics GmbH) on a modular P800 model autoanalyser (Roche). Individuals with diabetes were defined in accordance with the WHO criteria (fasting plasma glucose concentrations >7 mmol/l).
Statistical analysis
To compare means between the control and T2D groups, the Wilcoxon rank test was used. A linear regression model was used to analyse the relationship between hepcidin concentrations and other serum parameters. A logistic regression analysis was used to assess the association of parameters with the risk of T2D. Parameters with a skewed distribution (serum hepcidin and ferritin) were natural log-transformed. Statistical significance was defined as P< 0·05. The statistical analysis was performed using R (http://www.r-project.org/).
Results
Baseline characteristics of the study population
In the present study, 1259 case–control samples were analysed. The ages of the participants in the case and control groups were comparable. As expected, participants with T2D had significantly higher fasting blood glucose (9·61 (sd 2·68) v. 4·70 (sd0·67) mmol/l, P< 0·001) and HbA1c (8·2 (sd1·70) v. 5·7 (sd0·7) %, P< 0·001) concentrations (Table 1). Also, BMI (25·30 (sd3·49) v. 24·46 (sd3·33) kg/m2, P< 0·001), weight (65·80 (sd10·53) v. 63·36 (sd10·08) kg, P< 0·001) and waist circumference (88·02 (sd9·44) v. 83·63 (sd11·55) cm, P< 0·001) were significantly higher in the T2D population compared with individuals in the control group (Table 1). In addition, serum ferritin concentrations were significantly elevated in individuals with diabetes compared with those in the control group (308·00 (sd167·18) v. 232·50 (sd138·81) ng/ml, P< 0·001), while no significant differences in hepcidin concentrations were detected between the two groups (34·44 (sd26·98) v. 32·34 (sd22·75) ng/ml, P =0·2959) (Table 1).
Association of serum ferritin concentrations with diabetic traits and risks
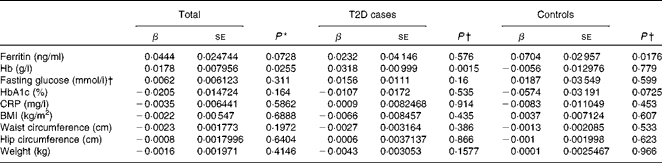
We first examined the association between serum ferritin concentrations and selected diabetic risk factors. The logistic regression analysis showed a statistically significant association between the presence of T2D and serum ferritin concentrations adjusted for age, sex and BMI (OR 1·85; 95 % CI 1·56, 2·19; P< 0·0001; Table 2). When all the participants were analysed, serum ferritin concentrations were positively correlated with fasting blood glucose (β = 0·0322, P< 0·0001) and HbA1c (β = 0·0501, P =0·0032) concentrations and BMI (β = 0·0195, P =0·0018) after adjustments for sex, age and T2D factor (T2D = 1 and control = 0) (Table 3), indicating that elevated ferritin concentrations are associated with increased risks of T2D. We also found significant correlations of ferritin concentrations in the control group with fasting blood glucose (β = 0·1333, P =0·0033) and HbA1c (β = 0·1026, P =0·012) concentrations (Table 3). In contrast, when the group with diabetes was evaluated, only a weak association between serum ferritin and HbA1c (β = 0·0377, P =0·0362) concentrations was observed (Table 3). Moreover, ferritin concentrations were not significantly correlated with fasting blood glucose concentrations (β = 0·0076, P= 0·502). The present data are consistent with those of the previous studies regarding the Fe–T2D relationships.
Table 2 Logistic regression analysis of type 2 diabetes (T2D) and log(ferritin)* (Odds ratios and 95 % confidence intervals)
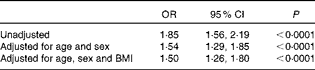
* Logistic regression analysis between T2D factor (T2D = 1 and control = 0) and log (ferritin), unadjusted or adjusted for age, sex and BMI.
Table 3 Multiple linear regression analysis of associations of log(ferritin) with iron-related traits and type 2 diabetes (T2D) (β Coefficients and standard errors)
HbA1c, glycosylated Hb; CRP, C-reactive protein.
* P value was calculated using a multiple linear regression model, adjusted for age, sex and diabetic status.
† P value was calculated using a multiple linear regression model, adjusted for age and sex.
Distribution of serum hepcidin concentrations and the association of hepcidin, iron-related parameters and diabetic risks
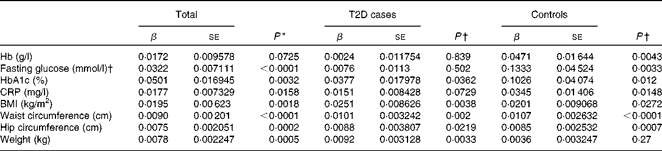
Hepcidin acts as a negative regulator of intestinal Fe absorption and influences systemic Fe homeostasis. The 5–95 % ranges of serum hepcidin concentrations were 8·04–81·98 ng/ml in men and 8·73–68·32 ng/ml in women, with median values of 27·4 ng/ml in men and 26·1 ng/ml in women. We first tested the possible associations between serum hepcidin concentrations and ferritin and Hb concentrations, two known Fe status indicators. After adjusting for age and sex, a significant positive correlation between serum hepcidin and ferritin concentrations was found in the control group (β = 0·0704, P =0·0176; Table 4). After adjusting for sex and age, we also found a statistically significant correlation between hepcidin and Hb concentrations in individuals with diabetes (β = 0·0318, P =0·0015) and in both the groups combined (β = 0·0178, P =0·0255) (Table 4).
Table 4 Multiple linear regression analysis of associations of log(hepcidin) with iron-related traits and type 2 diabetes (T2D) (β Coefficients and standard errors)

HbA1c, glycosylated Hb; CRP, C-reactive protein.
* P value was calculated using a multiple linear regression model, adjusted for age, sex and diabetic status.
† P value was calculated using a multiple linear regression model, adjusted for age and sex.
We then examined the possible association between serum hepcidin concentrations and T2D risk factors. The logistic regression analysis showed that there was no significant association between serum hepcidin concentrations and the onset of T2D (OR 1·03; 95 % CI 0·87, 1·22; P= 0·753; Table 5). In addition, no significant correlations were found between serum hepcidin concentrations and T2D risk factors including fasting blood glucose (β = 0·0062, P =0·311) and HbA1c (β = − 0·0205, P =0·1640) concentrations and BMI (β = − 0·0022, P =0·6888) in both combined and individual groups (Table 4).
Table 5 Logistic regression analysis of type 2 diabetes (T2D) and log(hepcidin)* (Odds ratios and 95 % confidence intervals)
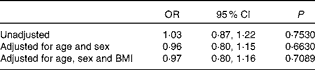
* Logistic regression analysis between T2D factor (T2D = 1 and control = 0) and log(hepcidin), unadjusted or adjusted for age, sex and BMI.
A mild inflammatory state may cause chronic elevation of circulating hepcidin concentrations and, consequently, may also induce anaemia(Reference Ferrucci, Semba and Guralnik24). However, we found no significant correlation between serum CRP and hepcidin concentrations (β = − 0·0035, P =0·5862) when all the participants were analysed.
Discussion
Although hepcidin is the primary hormone responsible for regulating systemic Fe homeostasis, the lack of an accurate method to measure physiologically functional hepcidin concentrations has limited the use of this hormone as an Fe biomarker in earlier high-throughput population studies. In the present study, we used a newly developed ELISA based on the principle of competitive binding to determine serum hepcidin concentrations in a large population. The competitive ELISA for human serum hepcidin accurately and reproducibly detects physiological and pathological changes in serum hepcidin concentrations(Reference Ganz, Olbina and Girelli25). Utilising this assay, the present study aimed to find a possible association between serum hepcidin concentrations and risks for the development of T2D. In this regard, we did not find significant differences in serum hepcidin concentrations in people with diabetes compared with the control group. Also, no significant associations between serum hepcidin concentrations and T2D risk factors (fasting glucose and HbA1c concentrations and BMI) were found in the present case–control study.
Previous studies examining the relationship between Fe stores evaluated by serum ferritin concentrations and diabetes risks have mainly been carried out in Western countries or in apparently healthy Chinese subjects(Reference Shi, Hu and Yuan26). Few studies have examined such correlations in a large, diabetic case–control population. Consistent with previous studies, we found that serum ferritin concentrations are significantly elevated in individuals with diabetes compared with the controls and are significantly correlated with risks of T2D. The present data suggest an important role for Fe overload in the onset of T2D.
Whether serum hepcidin concentrations are associated with Fe status (serum ferritin and Hb) was unclear previously(Reference Young, Glahn and Ariza-Nieto21, Reference Dallalio, Fleury and Means27). In the present study, we found weak, but significant, positive correlations between serum hepcidin concentrations and Hb and ferritin concentrations. Factors that contribute to the development of T2D such as obesity, inflammation and the metabolic syndrome have also been demonstrated to be significantly associated with serum ferritin concentrations(Reference Vari, Balkau and Kettaneh28). Thus, the multifactorial effect on serum ferritin concentrations could be one explanation for the finding that the hepcidin–ferritin association is more significant in the control group than in the T2D group in the present study. Furthermore, the present results indicate that serum hepcidin concentrations reflect Fe metabolism status in humans. Previous studies have also detected associations between serum ferritin concentrations and both urinary(Reference Ferrucci, Semba and Guralnik24) and serum(Reference Ganz, Olbina and Girelli25) hepcidin concentrations. Hepcidin acts as a negative regulator of Fe absorption, and its positive association with serum ferritin concentrations is probably due to feedback responses resulting from elevated systemic Fe status. All of these results are consistent with the fact that ferritin and hepcidin are biologically relevant and affirm the role of hepcidin as a key regulator of Fe metabolism. The present study can be considered to be more conclusive than previous studies due to the accurate quantification of biologically functional hepcidin and the large sample size.
Ferritin is an acute-phase reactant and its synthesis is up-regulated by infection or inflammation. The chronic inflammatory state accompanied by T2D may also contribute to increased ferritin concentrations measured in T2D patients(Reference You and Wang29). In the present study, we observed a strong positive correlation between serum ferritin and CRP concentrations; however, we did not find evidence of a significant association between serum hepcidin and CRP concentrations. Consistent with these results, Ferrucci et al. (Reference Ferrucci, Semba and Guralnik24) did not find significant associations between urinary hepcidin concentrations and inflammatory markers such as CRP, IL-6, IL-1β and TNF-α. They concluded that abnormally elevated hepcidin concentrations may not be necessary to sustain mild hypoferraemia and inflammation-induced anaemia. Several studies have suggested that inflammation does not explain the correlation between ferritin concentrations and T2D(Reference Sun, Franco and Hu30, Reference Sharifi, Ziaee and Feizi31). Increased oxidative stress or liver injury caused by high Fe status is probably the mechanism underlying the Fe–diabetes association(Reference Hanley, Williams and Festa32). Furthermore, the associations of diabetes with ferritin and CRP concentrations are probably independent of each other(Reference Jiang, Manson and Meigs10, Reference Sun, Franco and Hu30). Given such suggestions, it is not contradictory that hepcidin concentrations only correlate with ferritin concentrations and not with CRP concentrations or T2D risk factors. However, the relationships between serum hepcidin concentrations and other inflammatory markers such as IL-6 and TNF-α should be investigated in order to better elucidate the effects of inflammation on hepcidin expression in humans.
We speculate that a slight up-regulation of serum hepcidin concentrations compensates for elevated body Fe status as measured by serum ferritin and Hb levels. The intestine only absorbs 1–2 mg of dietary Fe daily, and most Fe needed for the daily production of erythrocytes (20–30 mg Fe/d) is provided by macrophage Fe recycling. Thus, mildly elevated serum hepcidin concentrations may be sufficient to down-regulate duodenal Fe absorption while maintaining the Fe recycling process. Of note, because the present study is an epidemiological study, we did not evaluate the possible associations of hepcidin concentrations with other haematological parameters (serum Fe or transferrin saturation), which are needed to fully elucidate the correlation of hepcidin concentrations with body Fe status. Furthermore, investigation of hepcidin expression in populations with altered Fe metabolism, such as in an anaemic case–control cohort, may lead to a better understanding of the possible correlations between hepcidin concentrations and other Fe-related parameters.
In summary, we measured serum hepcidin and ferritin concentrations in a diabetic case–control population. We found that serum ferritin concentrations significantly correlate with risks of T2D. More importantly, we found that serum hepcidin concentrations positively correlate with Fe-related parameters (Hb and ferritin) in human subjects. Compared with prohepcidin in serum and urinary hepcidin, serum hepcidin concentrations may more accurately reflect body Fe metabolism status. Strikingly, no significant differences in serum hepcidin concentrations were found in individuals with diabetes compared with the control group. Furthermore, no significant associations of serum hepcidin concentrations with T2D or CRP concentrations were found.
Acknowledgements
We acknowledge the participants of the research study for their effort and time. We also acknowledge other members of the Wang laboratory for their support and helpful comments. The present study was supported by research grants from the Ministry of Science and Technology of China (973 Program) (2009CB941400, 2011CB966200, 2012BAD33B05, 2010CB529600, 2011CB504001 and 2012BAI01B09), the National Natural Science Foundation of China (31225013, 31030039, 30972529 and 81170332) and Shanghai Key Laboratory of Pediatric Gastroenterology and Nutrition (grant no. 11DZ2260500). It was also supported by the Distinguished Professorship Program from Zhejiang University (to F. W.).
X. G., Daizhan Zhou and P. A. conceived and designed the research and analysed the data; Daizhan Zhou, Z. Z., Di Zhang, Y. L. and L. H. recruited the study subjects and performed the T2D-related clinical measurements; X. G., P. A., Q. W., A. W., Hao Wang, Hui Wang and M. M. measured the Fe-related parameters; X. G. and F. W. wrote the manuscript; F. W. and Y. L. oversaw the study and designed the research.
Duality of interest: the authors declare that there is no duality of interest associated with the present study. Disclosure information: none of the authors has anything to declare.