


Globally, in 2010, there were an estimated 52 million people with autism that accounted for more than 111 disability adjusted life years (DALYs) per 100 000 population. Reference Baxter, Brugha, Erskine, Scheurer, Vos and Scott1 Until recently, information on the epidemiology of autism was based on childhood studies. Reference Fombonne2,Reference Newschaffer, Croen, Daniels, Giarelli, Grether and Levy3 A complete understanding of the nature, causes and public health impact of autism should consider the interplay of genetic, epigenetic and environmental associations throughout the life course. Reference Bresnahan, Brugha, Susser, Koenen, Rudenstine, Susser and Galea4 There is a widespread but largely uninformed assumption 5,6 that as many as a half of all adults with autism have intellectual disability, which, if untrue, could distort planning a balanced range of services for the whole population with autism. As childhood diagnoses of autism (or of Asperger syndrome) have increased, Reference Gee7,8 parental fears remain undiminished concerning the future care of their offspring with little prospect of funded services when they can no longer provide support.
Two UK studies limited to adults with intellectual disability Reference Cooper, Smiley, Morrison, Williamson and Allan9,Reference Bhaumik, Tyrer, McGrother and Ganghadaran10 suggest autism rates between 70/1000 and 210/1000 but lacked a validated systematic diagnostic assessment. Recently the prevalence of autism was reported as 9.8/1000 in the Adult Psychiatric Morbidity Survey (APMS), a nationally representative sample of adults capable of giving informed consent and of taking part in a survey interview, living in private households. Reference Brugha, McManus, Bankart, Scott, Purdon and Smith11 That study Reference Brugha, McManus, Bankart, Scott, Purdon and Smith11 found autism was associated with reduced verbal IQ, low educational achievement, male gender and epilepsy. Reference Rai, Kerr, McManus, Jordanova, Lewis and Brugha12 However, by excluding people without the decision-making capacity to consent or to take part in a standard survey interview, or who were living in care settings such as institutions or care homes for people with intellectual disabilities, adults with moderate to profound intellectual disability were unrepresented. Given the strong association between intellectual disability and a childhood Reference Baird, Simonoff, Pickles, Chandler, Loucas and Meldrum13 and adulthood Reference Cooper, Smiley, Morrison, Williamson and Allan9 diagnosis of autism, knowledge of the overall prevalence and age Reference Brugha, McManus, Bankart, Scott, Purdon and Smith11 and gender Reference Fombonne2,Reference Newschaffer, Croen, Daniels, Giarelli, Grether and Levy3 profile of autism in adults requires adults of all ability levels to be examined using comparable methods. This paper reports on the epidemiology of autism drawing on samples combined to reflect the full range of ability levels in the adult general population. The sample from the first general population study Reference Brugha, McManus, Bankart, Scott, Purdon and Smith11 was extended with the inclusion of representative samples of adults with intellectual disability omitted from the earlier survey. The aims were to provide an estimate of the overall prevalence of autism and to examine key associations in adults at all intellectual ability levels.
Method
Data from a multiphase survey of adults in private households throughout England (APMS; Reference Brugha, McManus, Bankart, Scott, Purdon and Smith11 fieldwork 2007) and a single-phase survey of a representative group of adults with intellectual disability drawn from intellectual disability case registers in three areas of England (the Intellectual Disability Case Register study (IDCR); Reference Brugha, Cooper, McManus, Purdon, Scott and Spiers14 fieldwork 2010) were combined. The APMS employed a stratified two-phase design based on a random probability sample of one adult per private household, Reference McManus, Meltzer, Brugha, Bebbington and Jenkins15 throughout England (as already described Reference Brugha, McManus, Bankart, Scott, Purdon and Smith11 ) followed by diagnostic assessments of respondents at an increased risk of autism. Reference Lord, Rutter and Le Couteur16
For the IDCR, adults not considered in the APMS, by design, and living in communal care establishments and private households, were randomly sampled from three adult intellectual disability registers in England, in Leicestershire, Lambeth and Sheffield, stratified by age, gender and type of residence (detailed in online supplement DS1). For the adults living in private households, those judged sufficiently able to have taken part in the APMS were then excluded. All adults living in communal care establishments were included, as these establishments were excluded from the APMS, yet a lot of people with intellectual disabilities live in such establishments. The sample size in APMS phase two was chosen to reflect the sample sizes and precision of psychosis prevalence estimates required to monitor trends in each APMS survey since the first APMS in 1993. Reference Jenkins, Lewis, Bebbington, Brugha, Farrell and Gill17 The IDCR sample was designed to achieve similar precision.
APMS participants gave informed consent directly to APMS phase-one interviewers. In the IDCR, following the English Mental Capacity Act 2005, consent was taken wherever possible with input from consultees as appropriate. In keeping with the requirements of the ethics committees, participants in Leicestershire were telephoned by the research team (‘opt-out consent procedure’); those in Lambeth and Sheffield contacted the research team only if they wished to take part in the study (‘opt-in consent procedure’). Ethical approval for the APMS was obtained from the Royal Free Medical School Research Ethics Committee, London, UK. Ethical approval for the IDCR was obtained in Leicestershire from the Derbyshire Ethics Committee and for Sheffield and Lambeth from the ‘Essex 2’ Research Ethics Committee, UK.
The 20-item self-completion Autism-spectrum Quotient (AQ) Reference McManus, Meltzer, Brugha, Bebbington and Jenkins15,Reference Baron-Cohen, Wheelwright, Skinner, Martin and Clubley18 was used in phase one of the APMS to select participants for a second-phase evaluation using detailed clinical assessments based on Module 4 of the Autism Diagnostic Observation Schedule (ADOS-Mod4). Reference Lord, Rutter and Le Couteur16 In the IDCR study, most participants were assessed at first interview with Module 1 of ADOS (ADOS-Mod1), Reference Lord, Rutter, DiLavore and Risi19 which is designed for individuals who do not consistently use phrase speech. The ADOS-Mod4 was used for verbally fluent adults living in communal care establishments.
Threshold scores of 12+ on the ADOS-Mod1 and 10+ on the ADOS-Mod4 were used to define an individual as having autism. Both the ADOS-Mod1 and ADOS-Mod4 were subject to validation and calibration work (online supplement DS2) within the study general population samples Reference Brugha, McManus, Bankart, Scott, Purdon and Smith11,Reference Brugha, Cooper, McManus, Purdon, Scott and Spiers14 based on developmental assessments using the Autism Diagnostic Interview – Revised (ADI-R) Reference Lord, Rutter and Le Couteur20 and the Diagnostic Interview for Social and Communication Disorders (DISCO) Reference Wing, Leekam, Libby, Gould and Larcombe21 and, in the APMS, a consensus clinical diagnosis evaluation (n = 200). Reference Brugha, McManus, Smith, Scott, Meltzer and Purdon22 In the IDCR a random sample of 30 carers of individuals who scored high on the ADOS-Mod1 (⩾7) and a random sample of 30 carers of individuals who scored low on the ADOS-Mod1 (<7) were invited to take part in an interview by a senior research psychologist (J.S.) using the DISCO and ADI-R, to test the accuracy of the ADOS-Mod1 in identifying individuals with autism. Both studies confirmed the diagnostic thresholds for autism originally recommended by the developers of the ADOS. Reference Lord, Rutter, DiLavore and Risi19 Footnote †
Diagnostic interviewers were experienced in psychological research, and received an induction and training programme, run by a senior research psychologist (J.S.), a psychiatrist (T.S.B.) and a qualified ADOS trainer (F.J.S.). Training experience was gained through assessing adults living in settings in which fieldwork subsequently took place. Field interviews did not commence until the interviewers achieved at least 90% agreement on ratings of jointly observed ADOS examinations. During fieldwork, interviewers received supervision sessions and prepared case vignette reports. They took part in post fieldwork debriefing to add further contextual information.
Intellectual disability was defined as a significant intellectual impairment with onset before adulthood and deficits in skills needed for daily functioning 23–25 assessed in the IDCR by the carer-report version of the Vineland II Adaptive Behaviour Scales. Reference Sparrow, Cicchetti and Balla26 In the APMS, predicted Verbal IQ (V-IQ; range estimate 70–130) was derived using the National Adult Reading Test (NART). Reference Nelson and Willison27 The NART requires a high reading age, leaving gaps in its completion for adults with literacy problems of a wide range of causes, including mild intellectual disability, dementia, dyslexia, lack of education. Given this limitation (online supplement DS2), we were unable to identify those in the APMS with mild intellectual disability, so they all were included in a category of none to mild intellectual disability. This assumption is reasonable, as ability to participate in the APMS would be extremely unlikely at an ability level of moderate intellectual disabilities or lower. In both surveys questionnaires were completed covering participant's physical and mental health, socioeconomic factors and use of services, using comparable measures. Reference McManus, Meltzer, Brugha, Bebbington and Jenkins15
Statistical analysis
Online supplement DS1 describes how the APMS and IDCR samples were combined for analysis, which is illustrated in online Fig. DS1. The svytabulate procedure (Stata 12.0 for Windows) was used to estimate prevalence of autism by intellectual disability, age and gender; svylogistic was used to fit logistic regression models for autism by age and gender, taking the complex survey design into account and adjusting for the presence of epilepsy; confidence intervals were calculated using Taylor linearisation. Reference Binder28 To examine whether predictors of autism are the same in those with and without moderate intellectual disability, models were fitted for univariable predictors with an interaction term, allowing odds ratios to vary by disability level. The significance of interaction terms was tested using an adjusted Wald test Reference Eltinge and Sribney29 and where significant (P<0.05) was included in the final multivariable model.
Results
Achieved sample and response rate
Of 13 171 households identified as potentially eligible in the APMS, 7461 (57%) provided a complete phase-one interview of whom 849 were selected for phase-two interviews. Of these 630 (74%) completed phase-two assessments: 618 full ADOS-Mod4 assessments were carried out in the APMS. Analyses reported previously Reference Brugha, McManus, Bankart, Scott, Purdon and Smith11 found no evidence of non-response bias.
In the IDCR study, response rates were much higher in Leicestershire under the opt-out ethical approval procedure than for Lambeth or Sheffield. There were only five individuals assessed from Sheffield. Response rates were also higher in communal care establishments. Overall, 75/118 (64%) establishments took part and, in these 207/300 (69%) eligible individuals approached took part. In the IDCR private households, however, only 83/410 (20%) individuals took part, of whom 78 were from Leicestershire. Very few family carers of adults living in private households in Lambeth or Sheffield responded to the written invitation so, under ‘opt-in’ procedures, almost all could not be contacted further. Nevertheless, the achieved communal care establishments sample in Leicestershire compared well with the case-register population (see online supplement DS3), although the participants in the private household sample were more likely to be male and have more severe intellectual disability.
Of 290 individuals interviewed, 276 were assessed for autism. Assessments with the remaining 14 were attempted but could not be completed because participants had profound and multiple disabilities and assessors were unable to give a confident assessment. Missing values in the APMS were minimal (<1% on all variables): there were 12 (4.3%) individuals in the IDCR study who had no Vineland assessment but were assessed for autism. Sensitivity analyses with these sequentially counted as having and not having intellectual disability had no effect on the findings. Other missing values in the IDCR study were infrequent and are shown in the tables where they amount to more than 5% of n.
Participant characteristics by intellectual ability
Participants with moderate to profound intellectual disability were more likely to be male, younger, and were more ethnically diverse than those with no or mild intellectual disability (see Table 1 and online Table DS4 for a version of Table 1 covering a larger number of characteristics). The increased prevalence of South Asian ethnicity reflects the location of most of the IDCR sample in Leicestershire (online Table DS4). Those in the sample with moderate to profound intellectual disability were more likely to be disabled and less likely to have ever worked.
Table 1 Sample characteristics a
| No or mild/borderline intellectual disability | |||
|---|---|---|---|
| Characteristic | Moderate to profound
intellectual disability IDCR (n = 217) |
IDCR no or
mild/borderline intellectual disability (n = 47) |
APMS (n = 7274) |
| Gender, n (%) | |||
| Male | 121 (55.8) | 19 (40.4) | 3130 (43.0) |
| Female | 96 (44.2) | 28 (59.6) | 4144 (57.0) |
| Age group, n (%) | |||
| 18–29 | 38 (17.5) | 13 (27.7) | 921 (12.7) |
| 30–44 | 62 (28.6) | 18 (38.3) | 1966 (27.0) |
| 45–64 | 97 (44.7) | 10 (21.3) | 2409 (33.1) |
| 65+ | 20 (9.2) | 6 (12.8) | 1978 (27.2) |
| Intellectual ability, n (%) b | |||
| Profound intellectual disability | 125 (57.6) | – | – |
| Severe intellectual disability | 58 (26.7) | – | – |
| Moderate intellectual disability | 34 (15.7) | – | – |
| Mild/borderline intellectual disability | – | 47 (100) | – |
| IQ 70–85 | – | – | 1006 (13.8) |
| IQ 86–100 | – | – | 1829 (25.1) |
| IQ 101+ | – | – | 3916 (53.8) |
| IQ not assessed | – | – | 523 (7.2) |
| Activities of daily living (ADL) | |||
| ADL difficulties, median (IQR) c | 7 (7, 7) | 5 (4, 7) | 0 (0, 1) |
| ADL with a lot of difficulty, median (IQR) | 6 (4, 7) | 2 (0, 3) | 0 (0, 0) |
| Participants with missing data on ADL, n (%) | 13 (6.0) | 8 (17.0) | 18 (0.2) |
| Work, n (%) | |||
| Never in paid work | 185 (85.3) | 30 (63.8) | 230 (3.2) |
| Ever in paid work | 10 (4.6) | 11 (23.4) | 6975 (95.9) |
| Missing | 22 (10.1) | 6 (12.8) | 69 (0.9) |
IDCR, Intellectual Disability Case Register; APMS, Adu It Psychiatric Mobility Survey; IQR, interquartile range.
a. See online Table DS4 for a more detailed version of this table covering a larger number of variables.
b. Classified using the Vineland II caregiver-rating form Reference Sparrow, Cicchetti and Balla26 for the Intellectual Disability Case Register (IDCR) sample and the National Adult Reading Test (NART) for Adult Psychiatric Morbidity Survey (APMS) sample. Twelve adults from the IDCR study were excluded because they could not be classified.
c. Difficulty with seven ADL including personal care, getting out and about and using transport, medical care, household activities, practical activities, paperwork and managing money.
Autism prevalence by age, gender and intellectual ability
There were 14 men and 4 women with autism in the APMS subsample, and 49 men and 40 women with autism in the IDCR subsample. The prevalence of autism in England, estimated from the combined reweighted sample, was 1.1% (95% CI 0.3–1.9%). Because people with moderate to profound intellectual disability make up just 0.3% of the total population, overall associations of autism with age and gender for the population as a whole are unchanged by the inclusion of rates for people with intellectual disability. There was a gradient of autism prevalence by intellectual ability (Fig. 1), with prevalence considerably higher in those with moderate to profound intellectual disability (39.3%, 95% CI 31.0–48.4, compared with 1.0%, 95% CI 0.4–2.2 in those with no or mild intellectual disability (OR = 63.5, 95% CI 27.4–147.2)).
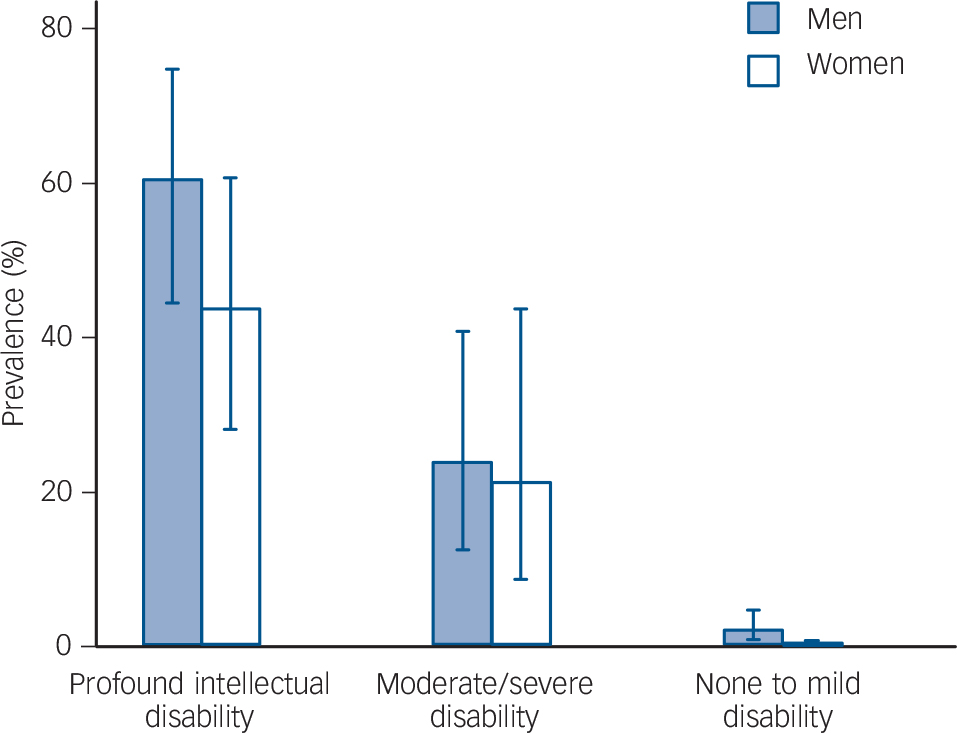
Fig. 1 Gradient of autism prevalence by intellectual ability; combined sample.
Intellectual ability is classified using the Vineland II caregiver-rating form for the Intellectual Disability Case Register (IDCR) sample; those in the Adult Psychiatric Mobility Survey (APMS) sample are assumed to have no or mild intellectual disability.
In the population with moderate to profound intellectual disability, prevalence of autism was not specifically associated with gender, being 42.3% (95% CI 31.1–54.3) in men and 35.2% (95% CI 23.5–49.0) in women, P = 0.43 (Table 2). However, in the population with no or mild intellectual disability, prevalence was considerably higher in men at 1.9% (95% CI 0.8–4.2) than in women 0.2% (95% CI 0.0–0.7). The interaction between intellectual disability and gender on the prevalence of autism was statistically significant (P = 0.02; Wald test) and remained statistically significant when adjusted for age and presence of epilepsy (Table 3). There was evidence of a small decline in the prevalence of autism with age, statistically significant only in those with moderate to profound intellectual disability (Table 2).
Table 2 Univariate predictors of autism by intellectual disability a
| Moderate to profound intellectual disability b | No or mild/borderline ini tellectual disability |
P for variable ×
intellectual disability interaction |
|||
|---|---|---|---|---|---|
| Characteristic | OR (95% CI) | P | OR (95% CI) | P | |
| Gender | |||||
| Women | 1.00 | 1.00 | |||
| Men | 1.35 (0.64–2.83) | 0.43 | 8.97 (2.20–36.52) | 0.002 | 0.02 |
| Age (year) | 0.96 (0.93–1.00) | 0.008 | 0.98 (0.92–1.04) | 0.51 | 0.61 |
a. Weighted to represent the English population by age, gender, intellectual disability and type of residence.
b. Classified using the Vineland II caregiver-rating form in the Intellectual Disability Case Register (IDCR); those in the Adult Psychiatric Mobility Survey (APMS) sample are assumed to have no or mild intellectual disability.
Table 3 Multivariate predictors of autism by intellectual disability, with gender × intellectual disability interaction a
| OR (95% CI) | ||||
|---|---|---|---|---|
| Characteristic | All | Moderate to
profound intellectual disability b |
No or
mild/borderline intellectual disability |
P-value for variable ×
intellectual disability interaction |
| Gender | ||||
| Women | – | 1.00 | 1.00 | – |
| Men | – | 1.31 (0.58–2.99) | 8.46 (2.05–34.80)c | 0.03 |
| Age (year) | 0.98 (0.92–1.05) | – | – | – |
a. Reweighted to represent the English population by age, gender, intellectual disability and type of residence and adjusted for carer or self-reported epilepsy or fits since age 16.
b. Classified using the Vineland II caregiver-rating form in the Intellectual Disability Case Register (IDCR); those in the Adult Psychiatric Mobility Survey (APMS) sample are assumed to have no or mild intellectual disability.
c. P<0.01.
Discussion
This standardised whole population sample case-finding study has yielded new understanding of the prevalence of autism and its associations in adults with intellectual disability, gender and age. The usual male gender excess for autism in childhood Reference Fombonne2,Reference Newschaffer, Croen, Daniels, Giarelli, Grether and Levy3 was not evident among adults with intellectual disability, showing a significant gender × intellectual disability interaction on autism prevalence, with men and women with at least moderate intellectual disability having similar prevalence. Previous studies of adults with intellectual disability have found a higher rate of autism in men than women Reference Cooper, Smiley, Morrison, Williamson and Allan9,Reference Bhaumik, Tyrer, McGrother and Ganghadaran30,Reference Saemundsen, Juliusson, Hjaltested, Gunnarsdottir, Halldorsdottir and Hreidarsson31 although not as high as for the rest of the population. Reference Wing32 Childhood population estimates Reference Saemundsen, Magnusson, Georgsdottir, Egilsson and Rafnsson33 have reported a male:female ratio of 2.1:1 for children with IQ<70 and 3.7:1 for those without; an administrative study Reference Lin, Sung, Lin, Hsu, Chien and Su34 also found that the gender ratio diminished with increasing disability level in children; the Global Burden of Disease (GBD) project estimate, Reference Baxter, Brugha, Erskine, Scheurer, Vos and Scott1 based on childhood, incidence and mortality data, was three times commoner in males than females with autistic disorders (autism with delay in language or cognitive development) and over four times commoner for other forms of autism.
Strengths and limitations
The strength of this study lies in the comprehensive epidemiological sampling of adults of all ability levels in defined geographic areas and the use of direct diagnostic assessments of autism carefully validated in the study samples with the aim of achieving comparable measurement across intellectual ability levels. However, there is potential for selection bias on the estimate of autism prevalence in the IDCR study as a result of the low response in the IDCR private household sample. Detailed investigation of the pattern of non-response by age, gender, residence and presence of autistic traits in Leicestershire (online supplement DS3), makes type II error unlikely (i.e. failure to find a relationship between gender and prevalence of intellectual disability where it really exists).
We used moderate intellectual disability assessed by the Vineland II caregiver-rating form in the IDCR as a threshold for intellectual disability in the logistic regression, with none or mild intellectual disability imputed for the APMS sample. This measure is consistent with other recent prevalence studies of adults, Reference McConkey, Mulvany and Barron35,Reference Bailey36 giving a standardised but more exclusive measure of intellectual disability. Our results were substantially unchanged when we reanalysed with intellectual disability defined pragmatically as lack of decision-making capacity to consent and to participate in a household survey. This is closer to a threshold of mild intellectual disability, but with unavoidable undercounting of those with mild disability in the APMS.
Analysis was limited by the small number of individuals with autism, particularly in the APMS sample. The presented analyses are weighted to represent the national population by age, gender, intellectual disability and type of residence. Calculation of the IDCR weights was subject to error as it relied upon incomplete official statistics, and on the assumption that the three case-register areas represent the English population as a whole. Detailed sensitivity analyses found that the effects of estimating unknown population quantities on the overall prevalence estimates was minimal, giving prevalence of between 1.1 and 1.2%, regardless of assumptions made. Reference Brugha, Cooper, McManus, Purdon, Scott and Spiers37
Interpretation of our findings
There are various hypotheses that could account for the gender pattern we found: women with autism could be more severely impaired Reference Holtmann, Bolte and Poustka38 or there could be more ‘missed’ cases of autism in women without intellectual disability. Missed cases could result from male bias in autism diagnostic markers; Reference Gould and Ashton-Smith39 female presentation of autism may differ from male presentation and measures may be less able to detect the female presentation. Reference Gould and Ashton-Smith39,Reference Lai, Lombardo, Pasco, Ruigrok, Wheelwright and Sadek40 Autism in women of average or above average intelligence may be ‘masked’ by other conditions, such as eating disorders, Reference Nilsson, Gillberg, Gillberg and Rastam41 anxiety disorders Reference Kopp and Gillberg42 and borderline personality disorders. Reference Rydén, Rydén and Hetta43 Such women may be better than women with intellectual disability at hiding their difficulties by imitating social interactions, Reference Holliday-Willey44 having better language skills, different special interests, less hyperactivity and aggression. Reference Gillberg45 If more able women with autism are not diagnosed or are incorrectly diagnosed, then the prevalence of autism could be underestimated and their needs unmet. Biological theories for the male excess of autism Reference Baron-Cohen, Lombardo, Auyeung, Ashwin, Chakrabarti and Knickmeyer46 may also benefit from reconsideration. Gender determination and autism could have a common cause, i.e. intrauterine levels of testosterone. Differences in gender ratio could reflect different causes for autism. One small study (n = 94 individuals with autism) Reference Miles and Hillman47 reported a male:female gender ratio that was closer to 2:1 in individuals with genetic, magnetic resonance imaging or clinical morphological abnormalities and found gender ratios closer to 8:1 in individuals without these abnormalities.
Although almost two in five adults with moderate to profound intellectual disability had autism, higher than expected based on previous research, Reference Cooper, Smiley, Morrison, Williamson and Allan9,Reference Wing32,Reference Saemundsen, Juliusson, Hjaltested, Gunnarsdottir, Halldorsdottir and Hreidarsson48 only 1% of adults with no or mild intellectual disability had autism. But because moderate to profound intellectual disability affects only 0.3% of all adults Reference Cooper, Smiley, Morrison, Williamson and Allan9 the point estimate for the prevalence of autism in the population as a whole only changed from 1.0 to 1.1% when adults with intellectual disability were included in the overall prevalence estimate. This finding runs counter to a widespread assumption that as many as half of adults who have autism have intellectual disability. 6
Only a small decline in the prevalence of autism with increasing age in adults with moderate to profound intellectual disability emerged, the same in magnitude to that reported previously in the household population, Reference Brugha, McManus, Bankart, Scott, Purdon and Smith11 but the finding was only statistically significant in the intellectually disabled population and not in the combined or household population samples. The GBD Reference Baxter, Brugha, Erskine, Scheurer, Vos and Scott1 showed no clear evidence of a change in prevalence of autism between 1990 and 2010 but as there was no information on prevalence in adulthood, age pattern findings were informed entirely by remission and mortality data. Although our finding does not support the suggestion that rates of autism are increasing rapidly (although diagnosis may be), Reference Gee7,8 further independent work on this association using case-finding population research methods is needed.
It was noted that research-identified individuals with autism reported previously in the able household population Reference Brugha, McManus, Bankart, Scott, Purdon and Smith11 had not been recognised or diagnosed by health services. New findings reported here suggest that the research case-finding measures used may also fail to identify women with autism who do not have intellectual disabilities, possibly adding further to the invisibility of autism in society. The picture that emerges is of a large population of adults who are significantly disabled whose needs remain unmet because they are not recognised, particularly when they do not have intellectual disabilities. The clinical, health and economic implications are potentially enormous and urgently merit the attention of further research.
We acknowledge that for some there may be a difficulty in placing the present prevalence work in a familiar autism diagnostic context. The instruments used in our survey, including the ADOS, in many ways are reflective of, but are not directly derived from either of the classification systems current when we developed the study. These were the ICD-10 49 and the DSM-IV-TR 50 diagnostic criteria for pervasive developmental disorder (including childhood autism and Asperger disorder) both primarily developed for use in childhood. We believe that the strength of our approach to assessing autism in adulthood is that it is achieved in such a way as to make future replication and reliable comparison by independent researchers possible in other countries and populations. All such research requires a trade-off between reproducibility and clinical familiarity and usage. We believe that for a first-ever epidemiological study in adults we have taken the most appropriate line using the most relevant instruments, with clearly established reliability, supported by validation studies. Reference Brugha, McManus, Smith, Scott, Meltzer and Purdon51 In future work additional clinical information will be collected with the intention of making it possible to describe findings in relation to more recent developments in the classification of autism such as the DSM-5 52 and ICD-11 autism spectrum disorder criteria currently being finalised and possibly also to future such developments in classification.
Funding
The study was funded by the Department of Health, London, through the Health and Social Care Information Centre, Leeds, UK. The funder played a substantial role in determining the content of the surveys, but played no part in the design, analysis or interpretation of this study, in drafting this article or in the decision to submit it for publication.
Acknowledgements
Our recently deceased colleague Professor Howard Meltzer played a key role in the design and development of this study; we would like to express our appreciation for his insight, knowledge and contribution. We acknowledge all the carers and adults with intellectual disability who participated in this study. We are grateful to Susan Purdon for advice and comments on study design and analysis and to Abdolreza Ashtarikiani, Sabyasachi Bhaumik, Gyles Glover, Richard Mills and Patricia Howlin for advice. Anonymised data arising from this survey have been archived following standard procedures by the UK Data Service (https://discover.ukdataservice.ac.uk/catalogue?sn=6379). As the survey involved a case register, particular care was taken to ensure that the data were anonymised, including using a new numeric identifier, removing place of recruitment and presenting broad age groups. Cross-tabulations of all variables archived were conducted to ensure that no fewer than six individuals fell into each ‘cell’.


eLetters
No eLetters have been published for this article.