


Introduction
Catharanthus roseus (L.) G. Don (periwinkle) is a perennial semi-shrub that belongs to Apocynaceae family (Sreevalli et al., Reference Sreevalli, Kulkarni and Baskaran2002). The genus Vinca was initially classified by Linnaeus in 1753 and it consists of two species: Vinca minor and Vinca major (blue periwinkle). George Don split the species in the genus Vinca, keeping the name Vinca for the genus that comprised V. major, V. minor and V. herbacea and giving the new name Catharanthus to a new genus that included V. rosea kind of species (Stearn, Reference Stearn, Taylor and Farnsworth1975). The genus comprises eight species being seven endemic to Madagascar, and one to India: C. trichophyllus, C. lanceus, C. coriaceus, C. ovalis, C. longifolius, C. scitulus, C. roseus and C. pusillus (Van, Reference Van1996). Catharanthus roseus has been cultivated as an ornamental plant all over the world and commonly grown as a summer and rainy season crop in the subtropical climatic conditions of Punjab and nearby areas. Under local conditions, it blooms year round except in December and January (Ravikumar and Dhatt, Reference Ravikumar and Dhatt2024). However, it can grow better in various climatic conditions and soils of tropical and sub-tropical areas of northern India and also have resistance to drought and other adverse conditions. In recent years, periwinkle has been extensively used in landscaping designs as a border planting due to its delightful appearance, varied colour, size, shape, forms of flowers, etc. (Howe and Waters, Reference Howe and Waters1994). It is propagated commonly by seeds or cuttings and blooms throughout the year. Tropical periwinkle is a day-neutral plant with a tendency for longer days and flowers throughout the year. The flower opening commences in the evening and continues until the morning hours of the next day (Ravikumar and Dhatt, Reference Ravikumar and Dhatt2023b). The flowers remain open up to 3 days and self-pollination is observed (Kulkarni, Reference Kulkarni1999). The stigma remains receptive between four and eight in the evening. The flower colours are reported to be under the control of II–IV genes (Krishnan et al., Reference Krishnan, Naragund and Kumar1979).
Understanding of the plant's biology is an important step for breeding programmes and maintenance of germplasm integrity in a particular crop. The haploid chromosome number of periwinkle is 2n = 16. It is an erect, evergreen, ever blooming, highly branched, drought-tolerant, perennial herb. Considering the export market of alkaloids viz., vinblastine and vincristine, importance of periwinkle raw material for industries and a major crop of drought areas, it is essential to improve it genetically (Ravikumar and Dhatt, Reference Ravikumar and Dhatt2023a). Diallel analysis utilized in the breeding programme of many crops offers genetic information on quantitative characters to the breeders (Glover et al., Reference Glover, Willmot, Darrah, Eh and Zhu2005). Flower yield in periwinkle is a complicated character and is a role of components of other contributing traits and their associations. The correlation analysis determines the degree of relationship between the traits under consideration. Estimating genotypic and phenotypic correlations between characters is helpful in planning and evaluating breeding programmes. Plant breeding necessitates an understanding of the relationships between different traits (Esmail, Reference Esmail2007; Hallauer, Reference Hallauer2007). However, correlation will be exhibited efficiently to frame the selection tactics for yield improvement in crop breeding methods but it does not report the direct and indirect magnitudes of individual attributes on flower yield trait. Hence, for powerful selection, it is necessary to consider the relative values of various variables contributing to flower yield (Rukhsar et al., Reference Rukhsar, Patel, Parmar, Kalola and Kumar2017). Path analysis separates correlation coefficients resulting from a specific trait into direct and indirect impacts of independent variables on a dependent variable in order to calculate the proportionate contributions of each independent trait (Wright, Reference Wright1921). The principal component approach illustrates the genetic diversity across genotypes and the genetic correlations between attributes. For instance, tall plants are being used for screening, while dwarf plants are used as pot culture and edges. However, the information on genetic studies in periwinkle is meagre. Thus, a study was carried out to obtain exhaustive knowledge on the correlation among important morphological traits and their effect on flower yield in periwinkle using F2 population.
Materials and methods
Experimental materials and design
Six morphologically diverse inbred lines of periwinkle (C. roseus (L.) G. Don) viz. white centred magenta (Vi-15-1), white with red spot (Vi-13-2), dark purple (Vi-16), light purple (Vi-15-2), white (Vi-29) and dark pink colour (Vi-14-3) were selected to generate a mapping population with 30 F2 plants (Supplementary Table 1). These homogeneous inbred lines are generated by continuous selfing of four to five generations. The current study was carried out at the Research Farm of Department of Floriculture and Landscaping, the Punjab Agricultural University, Ludhiana in the years of 2019–2022. In the first (I) year, selected inbred lines were evaluated for various morphological characters. In the second (II) year, a set of 6 × 6 complete diallel crosses were made using six inbred lines (Supplementary Table 2). The fully matured and unopened flower buds were emasculated in the evening with the help of forceps, and next day morning crossing was made by dusting desired pollen of the plant on emasculated buds. The crossed flower buds were tagged individually with proper information about the crossing. F1 seeds were collected and raised, followed by self-pollination to generate 30 F2 segregating population in the third (III) year. In the fourth year (IV), F2 plants were evaluated and F3 seeds were collected. The observations were recorded from five randomly selected plants from each plot for 12 morphological traits viz., leaf area (LA), plant height (PH), days to flowering (DTF), plant spread (PS), number of primary branches (NFB), internodal length (INL), duration of flowering (DFF), corolla tube length (CTL), number of flowers per plant (NFF), flower diameter (FD), follicle length (FL) and number of seeds per follicle (NFS). The height of five randomly selected plants was measured from the base of the plant to the growing tip at peak flowering time with the help of metre scale and averages were computed and expressed in centimetres. North-South and East-West direction was measured at peak flowering and their average was taken as plant spread. Days taken to flowering were calculated as the number of days between transplanting and the appearance of the first flower. The duration of flowering was measured from when the plants had a minimum of 8–10 flowers per plant to when the plants had 25–30% flowers per plant. The total number of flowers per plant was counted at weekly intervals from five randomly selected plants, and these numbers were totalled together for the entire flowering period, and an average was recorded (Singh, Reference Singh2021).
Statistical analyses
The experiment was designed as a randomized block design with three replications with 2.4 × 1.2 m plot size and the seedlings were planted at a spacing of 60 cm between rows and 40 cm within rows. The perusal data recorded from the 30 cross-combinations and their six different parents for 13 characters were used for further analysis. Inter-trait Pear's correlation and path analysis were calculated at the phenotypic and genotypic levels using the formulae proposed by Jibouri et al. (Reference Jibouri, Miller and Robinson1958) and computed and compared to the t value at (n-2) degrees of freedom to determine its significance (Snedecor and Cochran, Reference Snedecor and Cochran1956). Principal component analysis (PCA) was calculated using RStudio software.
Results
The descriptive statistics and correlation studies of F2 plants and parents for traits under research are presented in Table 1. The results revealed a positive correlation (P = 0.433**, G = 0.441**) between leaf area and days to flowering. Days to flowering exhibited highly significant positive correlation with plant height (0.753**, 0.766**). A significant positive association (0.682**, 0.699**) between plant height and plant spread was observed. The plant spread showed highly positive relationship with days to flowering across all the traits (0.749**, 0.734**). Number of branches per plant was positively correlated with seed yield (0.156, 0.160). The internode length was weakly positively correlated with the duration of flowering (0.025, 0.047). The duration of flowering was positively correlated with follicle length (0.175, 0.188*). The non-significant positive correlation of flower diameter with plant height (140, 150) and plant spread (0.113, 0.117) was observed. The follicle length showed a significant positive association with the number of seeds per follicle (0.802**, 0.845**).
Table 1. Pearson phenotypic (below diagonal) and genotypic (above diagonal) correlation among 12 various morphological traits in F2 population of periwinkle

Critical value of ‘r’ at 5% = 0.187 and that at 1% = 0.243. The significant symbols (*) are provided in text and table 1 for only significant values.
LA, leaf area; INL, internode length; NFF, number of flowers per plant; PH, plant height; CTL, corolla tube length; FD, flower diameter; PS, plant spread; DTF, days to flowering; FL, follicle length; NFB, number of primary branches per plant; DFF, duration of flowering; NFS, number of seeds per follicle.
In the current study, path analysis showed that flower yield per plant was maximum directly influenced by number of seeds per follicle (0.357) and corolla tube length (0.308). Therefore, maximum efforts should be given to these two characters for the enhancement of number of flowers per plant (Table 2). Indirectly, almost all traits had positive magnitudes and the highest indirect effect was observed for plant height (0.779) and days to flowering (0.663). In the current segregation population, maximum flower yield per plant indicates more number of seeds per follicle, long corolla tube, maximum plant spread and long internodes, which eventually enhance the flower yield per plant.
Table 2. Path coefficient analysis showing direct (diagonal and bold) and indirect effects (upper and lower diagonal, unbold) of various traits on number of flowers per plant (NFF) in F2 population of periwinkle

Critical value of ‘r’ at 5% = 0.187 and that at 1% = 0.243.
LA, leaf area; INL, internode length; NFF, number of flowers per plant; PH, plant height; CTL, corolla tube length; FD, flower diameter; PS, plant spread; DTF, days to flowering; FL, follicle length; NFB, number of primary branches per plant; DFF, duration of flowering; NFS, number of seeds per follicle.
In the present study, among 13 variables plant height (0.864), number of flowers/plant (0.857), plant spread (0.847) and number of primary branches/plant (0.777) were strongly associated with PC1 (Table 3; Fig. 1). Corolla tube length had a fragile positive association with PC1. Almost all variables have a positive correlation except days to flowering (−0.519) which is worthy. PC1 is primarily a measure of flower yield. The strongest contribution of variability in PC2 was due to follicle length (0.708), days to flowering (0.673), number of seeds/follicle (0.632), duration of flowering (−0.598) and corolla tube length (0.389). The maximum variability in PC3 population was observed due to flower diameter (−0.783), internode length (0.541), leaf area (0.519) and corolla tube length (0.315). The top contributing attributes in PC1 were plant height (15.642%) and plant spread (15.023%) followed by number of primary branches (12.640%); in PC2, follicle length (23.510%), days to flowering (21.286%), number of seeds/follicle (18.729%) followed by duration of flowering (16.789%). The highest contributing variables in PC3 were flower diameter (40.635%), internode length (19.384%) and leaf area (17.853%). The maximum cumulative variation was due to flower diameter (41.364%) and days to flowering (29.746%) followed by leaf area (29.202%) while plant height (15.724%) was a minimum variable.
Table 3. Principal component analysis of 12 characters in F2 population of periwinkle

Critical value of ‘r’ at 5% = 0.187 and that at 1% = 0.243.
LA, leaf area; INL, internode length; NFF, number of flowers per plant; PH, plant height; CTL, corolla tube length; FD, flower diameter; PS, plant spread; DTF, days to flowering; FL, follicle length; NFB, number of primary branches per plant; DFF, duration of flowering; NFS, number of seeds per follicle.
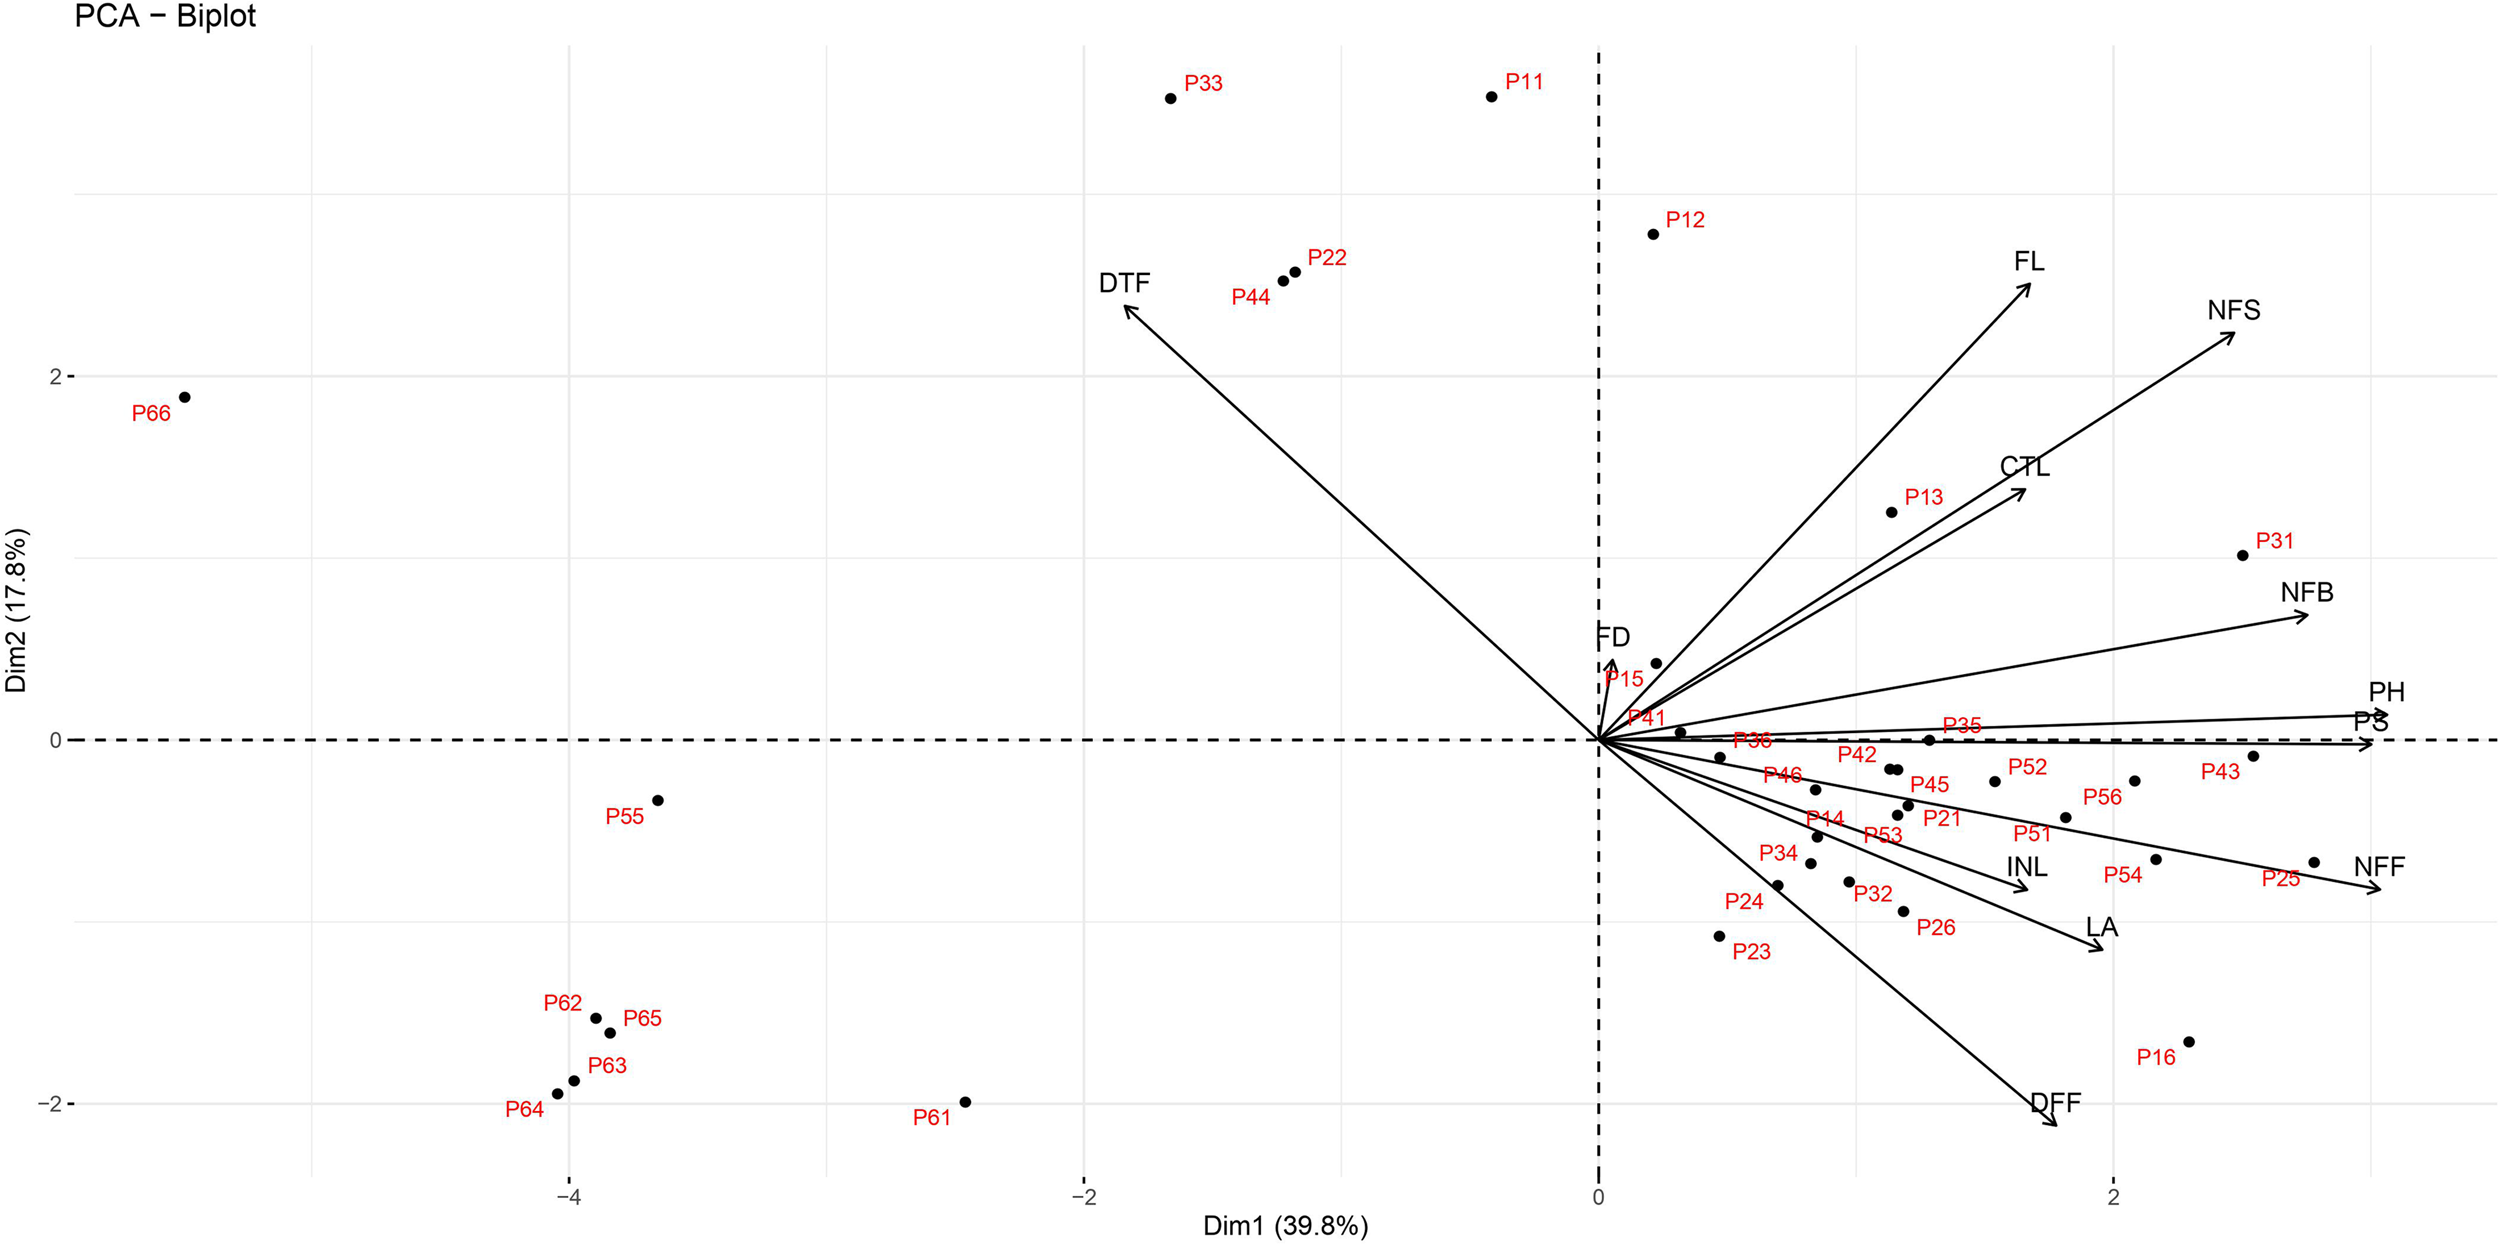
Figure 1. PCA analysis of phenotypic characters in F2 mapping population of periwinkle.
Discussion
The significant magnitudes of the genotypic and phenotypic correlations for leaf area and number of flowers per plant showed how closely related these two characteristics are to one another. A similar positive correlation between leaf area and days to flowering was recorded in the present study (Table 1); this might be because minimum enhancement of leaf area causes the earlier commencement of flowering. The current results were compatible with the findings of Valencia et al. (Reference Valencia, Mendez, Saavedra and Maestre2016) who reported that plant size and leaf area altered the physiological response of Mediterranean species. The negative association of days to flowering with the duration of flowering suggested that the delay of flowering would reduce the duration of flowering which might be due to adverse weather conditions at Ludhiana during the peak flowering period mostly in the month of January and February. Therefore, breeding should be targeted for early flowering to prolong the flowering duration and escape from frost. The positive correlation between traits can be due to epistatic effects between various genes or linkage according to Malaghan et al. (Reference Malaghan, Madalageri and Kotikal2014). According to Song et al. (Reference Song, Park, Lee, Kim and Kim2004), days to flowering was negatively correlated with plant height in Lilium. The present results showed that a positive significant correlation of days to flowering with plant height indicated that plants with early flowering would increase plant growth. These types of plants can be used as hedging in landscape gardening for screening purpose. In the present study, selection for early flowering through plant height would result in reasonably high yield. A significant positive association between plant height and plant spread observed in current investigation suggested that plant growth restricts the plant spread that occurs across all plants. The plant spread showed a positive relationship across all the traits under current study except the duration of flowering. Similar results were also observed by Bharathi et al. (Reference Bharathi, Jawaharlal, Kannan, Manivannan and Raveendran2014) in marigold. Number of branches per plant was negatively associated with flower duration and diameter, while it was positively correlated with flower and seed yield. Hence, a common phenomenon is if number of branches increases, yield automatically increased. More number of branches enhances photosynthetic ability, resulting in higher yields (Adekoya et al., Reference Adekoya, Ariyo, Kehinde and Adegbite2013).
Singh (Reference Singh2021) reported that duration of flowering was positively associated with plant height and flower yield. In the current study, duration of flowering was negatively correlated with all the traits under study except nodal and follicle length and seeds per follicle. This indicated that if duration increases all other traits will decrease. Therefore, duration of flowering is an important consideration for the improvement of periwinkle. The non-significant negatively associated corolla tube with flower diameter indicated that large flowers contain short corolla tube. Giri et al. (Reference Giri, Kumar, Kumar, Sharma, Naresh and Malik2018) reported that flower diameter was positively correlated with plant height and flower yield. In the current study, almost all traits were negatively correlated with flower diameter except seeds per follicle, plant growth and days to flowering. A significant negative correlation of flower diameter with leaf area and braches suggested that flower diameter increased with reduced branches. If number of branches reduced, the availability of photosynthates increased and moved into flowers, which might be the reason to an eventual increase in flower diameter. The significant association of follicle length with number of seeds per follicle suggested that if follicle length increases automatically seed yield increases. Flower yield exhibited significant positive correlations with all characters except flower diameter and duration of flowering. A highly significant positive correlation of plant growth with flower number implies that during periwinkle improvement, more targets should be emphasized on duration of flowering and plant growth. Thus, selection of parent based on any of these traits, alone or in conjunction, will generate high-yielding cultivars.
Path analysis indicated that flower yield per plant was maximum directly influenced by number of seeds/follicle and length of corolla tube (Table 2). Therefore, maximum efforts should be given to these two characters for the enhancement of number of flowers per plant. Indirectly, almost all traits had positive magnitudes and the highest indirect effect was observed for plant height and days to flowering. Similarly, Singh (Reference Singh2021) recorded direct effects of seeds per follicle on total number of flowers per plant. In the current segregation population, maximum flower yield per plant indicates more number of seeds per follicle, long corolla tube, maximum plant spread and long internodes, which eventually enhance the flower yield per plant. However, with linkage, the breaking of undesirable associations between traits was possible via recombination, segregation and mutagenesis.
The results of principal components revealed that the first three components accurately described 70.1% of the total variability (Table 3; Fig. 1). The scattering of F2 plants in bi-plot suggested that both inbred parents were genetically dissimilar and more diverse. The bi-plot also explained that days to flowering and flower duration were negatively correlated while flower yield and flowering duration were positively associated. According to Sharma et al., (Reference Sharma, Mahla, Kumar and Gaikwad2021), scattering of F2 plants in bi-plot confirmed both parents were quite diverse. In the present study, among 13 variables plant height, number of flowers/plant, plant spread and number of primary branches/plant were strongly associated with PC1. Two of the PCs demonstrated that 57.5% variation occurred in the F2 population, suggesting many more F2 plants had different character combinations, which are suitable as parents in hybridization for crop improvement.
Conclusion
According to the current study, there was a high significant positive correlation between flower yield and plant height, corolla tube length, days to flowering, plant spread and leaf area in periwinkle. In addition, path coefficient analysis revealed that flower yield was directly affected by seed yield and corolla tube length. Furthermore, the PCA indicated that among 13 variables plant height, plant spread and branches per plant were strongly associated with PC1. It was concluded that selection of parents based on these traits improves the flower yield and reduces the time of selection for better parents in future hybridization programmes in periwinkle.
Supplementary material
The supplementary material for this article can be found at https://doi.org/10.1017/S1479262124000285.
Data availability
Data are available on reasonable request from the corresponding author.
Acknowledgements
The authors are thankful to the Punjab Agricultural University, Ludhiana, India.
Author contributions
B. R. and K. K. D. were involved in conceptualization of research; B. R. and K. K. D. were involved in designing of the experiments; K. K. D. was involved in contribution of experimental materials; B. R. was involved in execution of experiments and data collection; B. R. was involved in analysis of data and interpretation; all these authors have substantial contributions to the final manuscript.
Funding statement
None.
Competing interests
None.
Informed consent
None.


