


Sleep duration among UK adults has been declining with 70 % of them sleeping <7 hours/day(1) and only 30 % of UK adults consume 5 portions per day of fruit and vegetables (FV)(Reference Bates2) which influence body weight and chronic disease risk(Reference Aune, Giovannucci and Boffetta3). Few studies have investigated the association between sleep duration and FV intakes. We therefore, assessed both cross-sectional and prospective associations between sleep duration and FV intakes in UK women.
Cross–sectional and prospective data were obtained from the UK Women's Cohort Study (UKWCS)(Reference Cade, Burley and Alwan4). Sleep duration was assessed by self-report of average hours slept and diet was assessed by a 4-day food diary at baseline and follow-up. Sleep duration was categorised as short (<7 h/d), reference (7–8 h/d) and long (>8 h/d). Regression analyses adjusting for age, socio-economic status, smoking, ethnicity and total energy intake were used for the analyses. Sleep duration was the exposure and FV intakes and their associated biomarkers (carotenoids, vitamin C and lycopene) were the outcomes. Restricted cubic spline (RCS) models were developed to explore potential non-linear associations.
In adjusted cross-sectional analyses (n = 11,522), there were no significant differences between reference sleepers (RS) and short sleepers (SS). However, long sleepers (LS) had on average 19 g/d (95 % CI −28 to −9, p < 0·001) less total FV compared to RS. In adjusted prospective analyses (n = 447), SS had on average 60 g/d (95 % CI −112 to −7, p = 0·02) less total FV in comparison to RS. No significant differences were shown between RS and LS in prospective analyses. There was no association between sleep duration and plasma biomarkers, although numbers were small (n = 140). RCS modelling showed that the cross-sectional (Figure 1.) (p < 0·001) and prospective (Figure 2.) (p = 0·001) associations between sleep duration and FV intakes were non-linear with women sleeping 7–8 h/d having the highest intakes compared to SS and LS. In conclusion, sleep duration was non-linearly associated with total FV intakes. These findings suggest an important link between sleep duration and FV consumption.

Fig. 1. Cross-sectional.
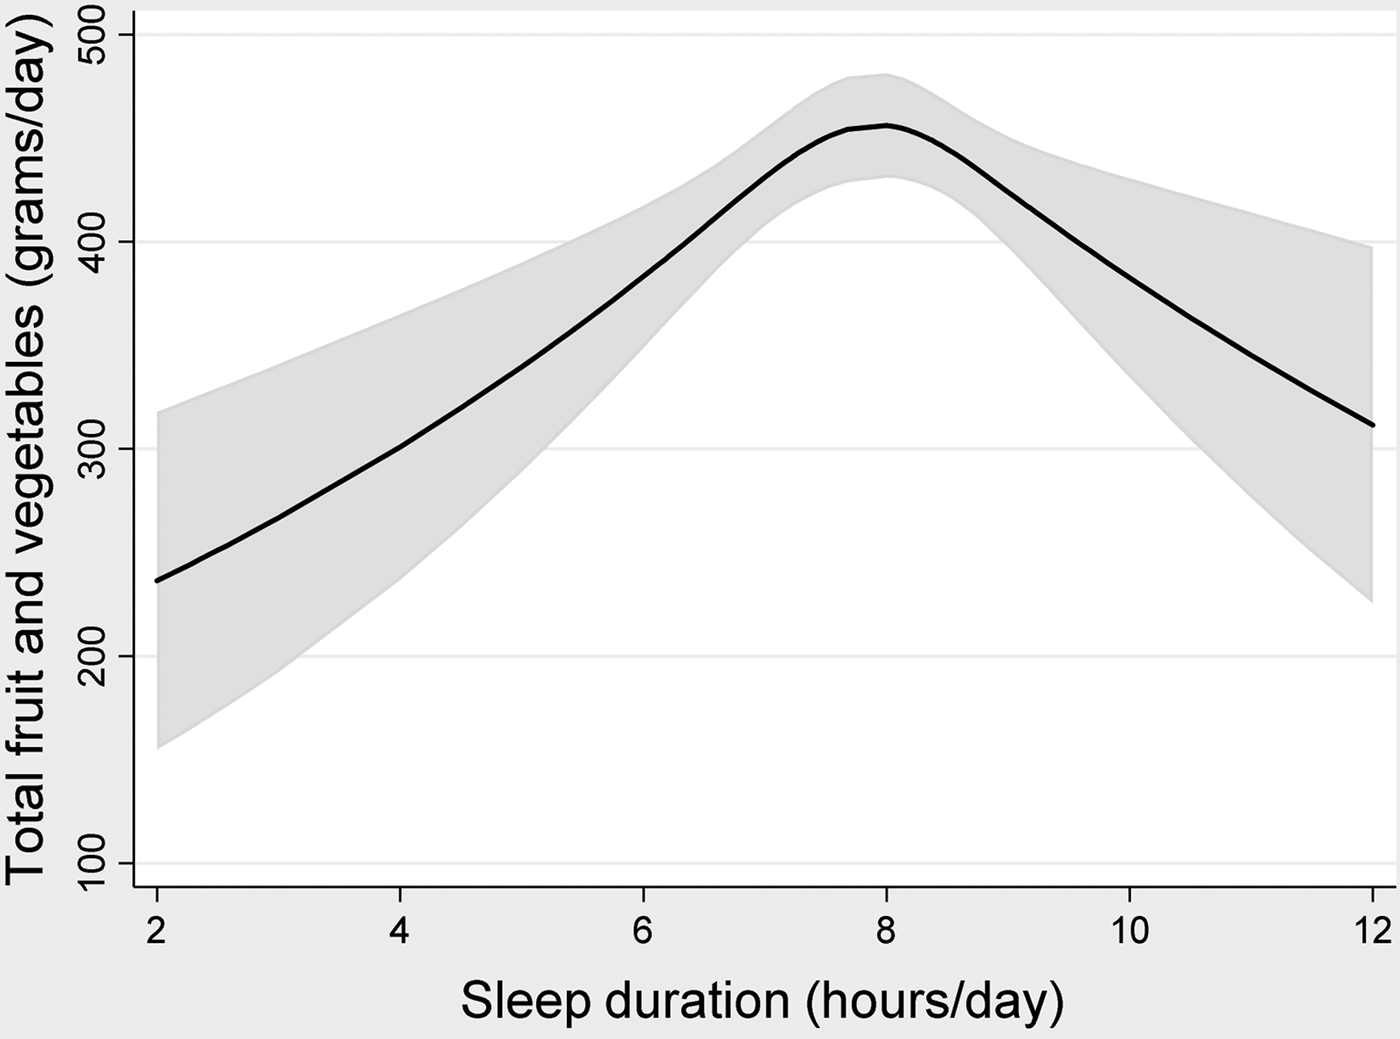
Fig. 2. Prospective.
E.A.N is in receipt of a scholarship from Umm Al-Qura University, Saudi Arabia.


