


The hypothalamic–pituitary–adrenal (HPA) axis related to the release of glucocorticoids (e.g. cortisol) by the adrenals plays an important role in regulating energy balance and body homoeostasis. Along with a wide range of actions on metabolic and neurophysiological processes, glucocorticoids promote gluconeogenesis in order to provide energy and are important indicators of physiological stress responses( Reference Nieuwenhuizen and Rutters 1 – Reference Sapolsky, Romero and Munck 3 ). Interestingly, hypothalamic functions and the control of energy balance seem to be strongly modulated by dietary intake of PUFA. Dietary intake of n-3 PUFA can counteract hypothalamic inflammation in obesity( Reference Cintra, Ropelle and Moraes 4 ) and act positively on hypothalamic neurogenesis( Reference Nascimento, Souza and Morari 5 ) and hypothalamic control of pituitary activity( Reference Shewchuk 6 ). These positive effects have mainly been demonstrated for proopiomelanocortin (POMC)-expressing neurons in the arcuate nucleus and the paraventricular nucleus of the hypothalamus( Reference Cintra, Ropelle and Moraes 4 , Reference Nascimento, Souza and Morari 5 ), whereas the latter produces and releases corticotropin-releasing hormone (CRH) in response to ‘stress’. CRH stimulates the release of adrenocorticotropic hormone (ACTH) by the pituitary, which, in turn, is synthesised from POMC( Reference Nieuwenhuizen and Rutters 1 ). This cascade may finally result in a modulation of the whole HPA axis and glucocorticoid secretion rates in the long-term. In this context, dietary intake of n-3 PUFA such as the essential α-linolenic acid (ALA, 18 : 3) and its long-chain metabolites EPA (20 : 5) and DHA (22 : 6) has been shown repeatedly to diminish HPA axis activity and glucocorticoid concentrations( Reference Ferraz, Delattre and Almendra 7 – Reference Nemeth, Millesi and Wagner 9 ). Rather elevated concentrations and even excessive glucocorticoid responses to stress can be assumed for n-6 PUFA, including linoleic acid (LA, 18 : 2) and its long-chain metabolite arachidonic acid (20 : 4), and n-3 PUFA deficiencies in general( Reference Morgese, Tucci and Mhillaj 10 , Reference Chen and Su 11 ), which emphasises the importance of a balanced dietary n-6:n-3 ratio.
However, changes in circulating plasma NEFA concentrations can modulate glucocorticoid secretions within a few hours, which could definitely not be related to any long-lasting effects of PUFA on neurophysiological functions. NEFA and their metabolism in specific hypothalamic areas after crossing the blood–brain barrier are suggested to signal the nutritional status, resulting in a modulation of hypothalamic activity and expression of genes involved in the control of energy balance( Reference Lam, Schwartz and Rossetti 12 ). Recent investigations in rats showed that a decrease in NEFA stimulates the HPA axis, resulting in increased ACTH and glucocorticoid concentrations, which was mediated primarily by the saturated palmitic acid (16 : 0) but not by n-6 PUFA( Reference Oh, Kim and Kang 13 ). Earlier studies in humans, which did not differentiate between specific fatty acids, showed inhibitory effects of NEFA on cortisol secretions under basal and stimulated conditions( Reference Lanfranco, Giordano and Pellegrino 14 , Reference Coiro, Casti and Rubino 15 ). However, another study in humans did not reveal such effects( Reference Mai, Bobbert and Kullmann 16 ), whereas increased glucocorticoid concentrations due to elevated non-esterified unsaturated fatty acid concentrations were found even in cultured adrenocortical rat cells( Reference Widmaier, Margenthaler and Sarel 17 ).
Diverse findings for NEFA effects on whole HPA axis functions and glucocorticoid secretions could be related to different experimental NEFA concentrations and compositions. Too high experimental NEFA concentrations may rather trigger a detrimental metabolic state such as obesity, which could be related to excessive glucocorticoid secretions( Reference Foss and Dyrstad 18 ) and impaired neuronal plasticity in hypothalamic areas such as the arcuate nucleus( Reference McNay, Briancon and Kokoeva 19 ). Furthermore, n-3 and n-6 PUFA can affect adrenal steroidogenesis and glucocorticoid synthesis varyingly strong( Reference Xie, Wang and Mick 20 ), which is not considered when referring to total NEFA concentrations rather than specific fatty acids. Therefore, we suggest that different effects of plasma non-esterified PUFA on glucocorticoid concentrations could be linked to the n-6:n-3 ratio and PUFA accumulation rates in plasma. The latter point would argue also for effects of plasma PUFA kinetics on HPA axis functions and could help determining time-related (e.g. short-term) effects of PUFA supplementation.
In this study on domestic guinea pigs, we determined time-related effects of natural diets differing in the essential PUFA ALA and LA on plasma PUFA patterns (plasma ALA, LA, total PUFA, and the n-6:n-3 ratio) over a 20-d supplementation period in order to describe the kinetics of plasma PUFA accumulations initially. Concurrent analyses of saliva cortisol concentrations were performed to determine time-related effects of plasma PUFA patterns on this indicator of HPA axis activity. Effects on saliva cortisol responses to a social stressor after the 20-d supplementation period enabled analysing influences on the HPA axis response. We recently introduced the guinea pig as a model species to study the effects of dietary fatty acids on HPA axis activity and cortisol secretion rates( Reference Nemeth, Millesi and Wagner 9 , Reference Nemeth, Millesi and Puehringer-Sturmayr 21 ). This may further be promoted by the possibility of frequent and reliable non-invasive cortisol measurements in saliva, which enables detailed and unbiased investigations( Reference Nemeth, Pschernig and Wallner 22 ). Based on a large sample size and repeated sampling procedures, considering possible sex differences, the results of this study may further contribute to the evaluation of the role of PUFA in the short-term modulation of HPA axis activity and physiological stress responses.
Methods
Ethical statement
The experiment was performed in accordance with EU Directive 2010/63/EU for animal experiments and has been checked and approved by our institutional board on animal ethics and experimentation (Faculty of Life Sciences, University of Vienna; no. 2014-005) and permitted by the Austrian Federal Ministry of Science and Research (BMWF-66.006/0024-II/3b/2013).
Animals and housing conditions
All domestic guinea pigs (Cavia aperea f. porcellus) used in this study (forty males and forty females) originated from an established heterogeneous stock of animals at our department. All animals were adult (age: 21·6 (se 1·4) months; body mass: 781·2 (se 21·6)), sexually intact, accustomed to daily contact with humans, and could be identified by natural fur colourations. Regular health checks were carried out by animal keepers and a veterinary; only healthy animals were used for the study. Before the experiments, animals were kept in socially established single-sexed groups of up to ten individuals. Each group’s enclosure measured 2 m×1·6 m and was environmentally enriched with different shelters; the floor was covered with woodchip bedding material. Daily provided food consisted of ad libitum guinea pig pellets (Altromin 3023; Altromin Spezialfutter GmbH & Co. KG), fresh vegetables, and hay; water was always available ad libitum.
For the experiment, animals were kept in individual cages (80 cm×50 cm×40 cm) in a separate test room to prevent any behavioural or physiological influences caused by social interactions. The floor of each cage was covered with bedding material, which was renewed each day, and a shelter was provided. Ambient conditions, including a light–dark cycle of 12 h each (lights on at 07.00 hours), a temperature of 22±2°C, and a humidity of 50±5 %, were maintained throughout the study.
Dietary regimens
The daily provided standard food throughout the experiment consisted of 25 g guinea pig pellets, 25 g fresh vegetables (12·5 g cucumber, 12·5 g carrots), and 5 g hay per animal. In addition, one of three natural sources showing high fat contents and different PUFA compositions were supplemented. These supplements originated from either chia seeds (Salvia hispanica), walnuts (Juglans regia), or peanuts (Arachis hypogaea). Pure water was supplemented for a control group. Chia seeds are one of the best natural sources for ALA (per 100 g: 30·74 g total fat, 23·67 g total PUFA, 5·84 g LA, 17·83 g ALA, 2034kJ), walnuts contain both LA and ALA in relatively high amounts and in a balanced ratio of approximately 4:1 (per 100 g: 65·21 g total fat, 47·17 g total PUFA, 38·09 g LA, 9·08 g ALA, 2738kJ), and peanuts contain very low PUFA levels in general but mainly MUFA and LA and almost no ALA (per 100 g: 49·24 g total fat, 15·56 g total PUFA, 15·56 g LA, <0·01 g ALA, 2374kJ); information extracted from the US Department of Agriculture National Nutrient Database( 23 ). For each animal, 500 mg/kg body mass of the respective supplement was crushed, dissolved in 500 µl water and administered orally using 1 ml syringes; in case of the control diet, animals were administered with 1 ml pure water. The overall nutrient composition and amounts of specific fatty acids of the resulting diets supplemented each day are outlined in Table 1. This feeding procedure has previously been shown to significantly affect plasma fatty acid patterns in guinea pigs based on end-point analyses( Reference Nemeth, Millesi and Wagner 9 , Reference Nemeth, Millesi and Wagner 24 ), while time-related effects have not been considered yet. Furthermore, statistical analyses of the resulting dietary regimes revealed significant differences in specific fatty acids only, while amounts of other nutrients remained similar( Reference Nemeth, Millesi and Wagner 9 ).
Table 1 Dietary composition, nutrients, and amounts of specific fatty acids supplemented each day per kg body mass
* Calculations for overall nutrient composition and amounts of specific fatty acids based on manufacturer information for Altromin 3023 guinea pig pellets (Altromin Spezialfutter GmbH & Co. KG) and the US Department of Agriculture National Nutrient Database( 23 ).
† All other fatty acids <0·01 g.
Experimental procedure
Due to logistical reasons, experiments were carried out in ten consecutive runs, with eight animals (four males and four females, which were unfamiliar among each other) being tested at one time. The eight isolated animals were randomly allocated to the four different dietary regimes, which was carried out by persons that were blind to the planned study. This yielded a total of ten males and ten females per dietary group after all ten runs. The resulting groups did not differ in age or body mass before testing (chia: 22·6 (se 2·8) months, 795 (se 44) g; walnut: 20·6 (se 2·4) months, 806 (se 44) g; peanut: 21·2 (se 2·7) months, 779 (se 45) g; control: 22·2 (se 3·4) months, 743 (se 44) g). Each run started with a 20-d isolation housing period, during which animals remained in their cages. After this isolation period all animals of the current run were transferred to a squared arena (1·4 m2; built of fibreboard; floor covered with bedding material) for 48 h of social confrontations. These confrontations with unfamiliar conspecifics are known to represent a strong stressor in guinea pigs( Reference Nemeth, Millesi and Wagner 9 ). Blood and saliva samples were collected during the experiments in order to analyse plasma fatty acids and saliva cortisol concentrations. Blood samples were collected with heparinised micropipettes via prominent ear veins; saliva samples were collected using cotton buds (detailed sampling procedures have been described previously( Reference Nemeth, Pschernig and Wallner 22 )). During isolation housing, samples were collected on days 0 (before animals were transferred to the cages), 5, 10, 15 and 20, always at 09.00 hours, in order to determine time-related changes in plasma PUFA patterns and saliva cortisol concentrations. During social confrontations, saliva samples were collected after 30 min, 24 and 48 h. This was done to analyse the long-lasting cortisol response to the stressful situation. Animals were additionally video recorded during social confrontations, directly before samples were collected, always for 30 min. This was done to analyse displayed behaviours during the social setup in order to correct saliva cortisol concentrations statistically for any behavioural influences. Feeding procedures, including the group-specific supplementation, were carried out each day at 10.00 hours; water was always available ad libitum.
Saliva cortisol analysis
Cortisol concentrations in saliva samples (in total 640 samples) were analysed via biotin–strepdavidin enzyme-linked immunoassays using a cortisol-specific antibody( Reference Palme and Möstl 25 ), which has previously been shown to highly reflect measurements in plasma of guinea pigs( Reference Nemeth, Pschernig and Wallner 22 ). Saliva samples were centrifuged (14 000 rpm, 10 min), diluted 1:50, and analysed in 10 µl duplicates. Intra- and interassays CV were 7·5 and 8·3 %, respectively.
Plasma fatty acid analysis
Fatty acid patterns in plasma (in total 400 samples) were analysed via GC, following previously established procedures for fatty acid preparation( Reference Nemeth, Millesi and Wagner 9 ). Briefly described, fatty acids in 100 µl plasma were transesterificated using 1 ml methanolic NaOH containing butylated hydroxytoluene and fatty acid methly ethers were obtained by adding 1 ml 14 % boron–trifluoride–methanol. Separation was performed using a Auto-System gas chromatograph with flame ionization detector (Perkin Elmer), equipped with an Rtx-2330 30 m×0·25 mm inner diameter silica column. In all, 1 µl of prepared samples was injected at 250°C and detected at 270°C; helium was used as carrier gas. Fatty acids were identified using a thirty-seven component FAME Mix Standard (Supelco) and peak integration was performed using TotalChrom Workstation 6.3.0 (PE Nelson). All detectable fatty acids were analysed in this way but due to the purpose of the study we only consider plasma ALA, LA, total PUFA levels, and the n-6:n-3 ratio in the following. As ALA and LA highly determine total PUFA and the n-6:n-3 ratio, these indicators of the plasma PUFA status were handled separately in the following (see ‘Statistical analysis’ section).
Behavioural analysis
Videos recorded during social confrontations were analysed using the Observer XT 10 version 10.5 (Noldus). All displayed behaviours were analysed for each individual, following the behavioural categories and definitions by Rood( Reference Rood 26 ). Behavioural categories were: (1) locomotion; (2) socio-positive interactions and (3) agonistic interactions. Locomotion was measured in durations, behavioural interactions in frequencies (per 30 min). Each category included several types of behaviours but their numbers were summed up to these categories. It was not the purpose of this study to analyse the effects of the supplements and/or PUFA on social behaviours, which has been described elsewhere( Reference Nemeth, Millesi and Wagner 9 ). The behavioural categories were used only to correct statistically for any influences on saliva cortisol measurements during social confrontations (see ‘Statistical analysis’ section), because behavioural interactions and general activity patterns can highly influence cortisol concentrations but we were solely interested on diet- and plasma PUFA-related effects.
Statistical analysis
Statistics were performed using the statistical software package R version 3.4.1( 27 ). Plasma fatty acids and saliva cortisol concentrations during the 20-d isolation housing period were analysed by linear mixed effect (LME) models using library ‘nlme’( Reference Pinheiro, Bates and DebRoy 28 ). Saliva cortisol concentrations measured during social confrontations were analysed by applying linear models. Except for a control female, measurements from all animals were included in the following statistical analyses. Library ‘pwr’( Reference Champely 29 ) was used for power calculations in order to calculate effect sizes at a statistical power of 80 % and a two-sided significance level of 0·05. Based on Cohen’s f 2 the given sample size and/or degrees of freedom per analysis were determined to be adequate in order to extract large effect sizes (f 2>0·35).
To analyse plasma fatty acid patterns (ALA, LA, total PUFA, n-6:n-3 ratio), diet (chia, walnut, peanut, control), sex (male, female), day (0, 5, 10, 15, 20), as well as their interactions, were initially included as fixed effects in the LME. As differences between groups were already detected on day 0, baseline values from this day were additionally included to correct the analyses for the first measurements and therefore statistically creating the same basis on day 0 among individuals. Individual ID was included as random effect to control for repeated measurements. Based on the Akaike information criterion (AIC), sex was determined to exert no effect on plasma fatty acids and was therefore completely removed from these analyses.
Saliva cortisol concentrations during isolation housing and social confrontations were analysed via two models each, which included the different indicators of the plasma PUFA status, namely plasma ALA and LA levels (=model 1) or total PUFA levels and the n-6:n-3 ratio (=model 2), in order to avoid aliased coefficients in the analyses. LME for isolation housing therefore included diet (to control for effect of the supplements themselves and therefore for other included nutrients) and the respective indicators of the plasma PUFA status, all interacting with sex and day, as fixed effects and individual ID as random effect. Linear models for social confrontations included diet and the respective indicators of the plasma PUFA status, all interacting with sex, as predictors, as well as baseline cortisol concentrations, measured directly before social confrontations, and behaviours (locomotion, socio-positive interactions, agonistic interactions) displayed during confrontations. As cortisol concentrations measured 30 min, 24 and 48 h after the onset of social confrontations did not differ among each other, the mean of all three values per animal was used as response variable in the respective models.
The AIC was further used to remove non-significant interactions and main effects in order to reduce the analyses to the relevant predictors. The control group was set as reference group in all analyses and the supplemented groups (chia, walnut, peanut) in contrast. Post hoc interaction analyses with Bonferroni corrections using library ‘phia’( Reference De Rosario-Martinez 30 ) were performed on significant effects. Shapiro–Wilk normality tests and Levene’s test for homogeneity of variance were applied on model residuals. Residual outliers were eliminated based on Cook’s distance. Some of the response variables had to be transformed by applying the natural logarithm, but raw data were used for visualisation of the results. All F- and P-values are based on type 3 sum of squares. Significance was set at P≤0·05.
Results
Plasma PUFA patterns
α-Linolenic acid (18 : 3n-3)
Plasma ALA levels were differently affected by the dietary supplements on a daily basis (baseline ALA: F 1,70=71·707, P<0·001; diet: F 3,70=2·024, P=0·119; day: F 4,275=1·391, P=0·237; diet:day: F 12,275=4·476, P<0·001). ALA highly increased due to chia supplementation and also due to walnuts, while peanuts and the control diet did not affect ALA levels (chia: χ 2=57·409, P<0·001; walnut: χ 2=9·707, P=0·046; peanut: χ 2=7·359, P=0·118; control: χ 2=5·902, P=0·207). Significantly increased ALA levels were detected from day 5 due to chia supplementation and from day 15 due to walnuts compared with the control group (Fig. 1(a) and Table 2).
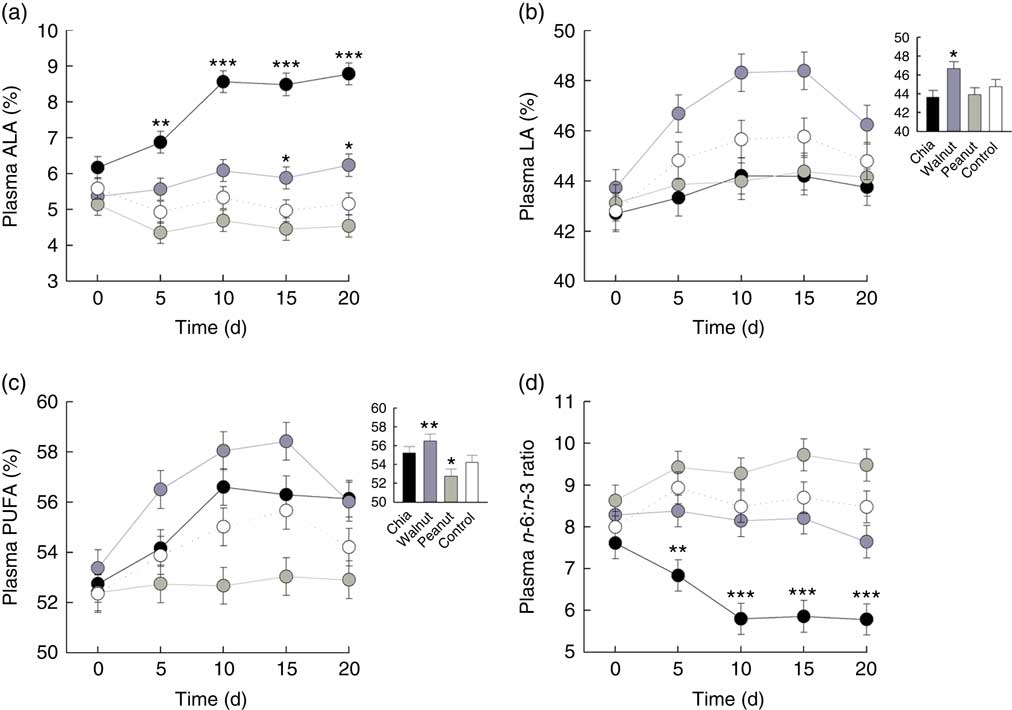
Fig. 1 Effects of chia (![]() ) seeds, walnuts (
) seeds, walnuts (![]() ) and peanuts (
) and peanuts (![]() ) (500 mg/kg body mass per d) on plasma PUFA patterns compared with a control (
) (500 mg/kg body mass per d) on plasma PUFA patterns compared with a control (![]() ) diet. (a) Percentage of plasma α-linolenic acid (ALA; 18 : 3n-3) on total fatty acids. (b) Percentage of plasma linoleic acid (LA; 18 : 2n-6) on total fatty acids. (c) Percentage of total plasma PUFA on total fatty acids. (d) Plasma n-6:n-3 ratio. (a–d) Values are means, with their standard errors represented by vertical bars for each supplement and day. Inset graphs show general differences if those were not based on a daily basis. Contrasts: * P≤0·05, ** P≤0·01, *** P≤0·001 compared with control diet.
) diet. (a) Percentage of plasma α-linolenic acid (ALA; 18 : 3n-3) on total fatty acids. (b) Percentage of plasma linoleic acid (LA; 18 : 2n-6) on total fatty acids. (c) Percentage of total plasma PUFA on total fatty acids. (d) Plasma n-6:n-3 ratio. (a–d) Values are means, with their standard errors represented by vertical bars for each supplement and day. Inset graphs show general differences if those were not based on a daily basis. Contrasts: * P≤0·05, ** P≤0·01, *** P≤0·001 compared with control diet.
Table 2 Group contrasts for significant effects of chia seeds, walnuts and peanuts on the plasma PUFA status
ALA, α-linolenic acid (18 : 3n-3); LA, linoleic acid (18 : 2n-6).
Linoleic acid (18 : 2n-6)
Plasma LA levels differed significantly between the dietary treatments and increased from day to day (baseline LA: F 1,70=242·272, P<0·001; diet: F 3,70=7·441, P<0·001; day: F 4,287=9·868, P<0·001). The diet:day interaction was removed beforehand (diet:day: F 12,275=1·080, P=0·3767). Increasing LA levels from day to day, however, were caused by walnut supplementation and the control diet (chia: χ 2=4·113, P=0·391; walnut: χ 2=35·697, P<0·001; peanut: χ 2=2·349, P=0·672; control: χ 2=13·931, P=0·007), but LA levels decreased in walnut supplemented animals from day 15 to 20 again. Nevertheless, walnuts resulted in highest LA levels throughout the 20-d isolation housing (Fig. 1(b) and Table 2).
Total plasma PUFA
Total plasma PUFA levels generally increased from day to day and were differently affected by the diets (baseline PUFA: F 1,70=134·965, P<0·001; diet: F 3,70=10·128, P<0·001; day: F 4,287=13·509, P<0·001). The diet:day interaction missed the criterion of significance only marginally and was removed beforehand (diet:day: F 12,275=1·685, P=0·070). However, total PUFA levels significantly increased in all animals except for the peanut supplement (chia: χ 2=27·619, P<0·001; walnut: χ 2=37·796, P<0·001; peanut: χ 2=0·587, P=0·965; control: χ 2=14·880, P=0·005). Similar to plasma LA, total PUFA decreased in walnut supplemented animals from day 15 to 20. Compared to the control diet, total PUFA appeared to be significantly higher due to walnut supplementation, while peanuts resulted in lowest levels throughout (Fig. 1(c) and Table 2).
Plasma n-6:n-3 ratio
Finally, the plasma n-6:n-3 ratio was significantly affected and differed between the dietary treatments on a daily basis (baseline n-6:n-3: F 1,70=191·561, P<0·001; diet: F 3,70=1·236, P=0·303; day: F 4,275=1·137, P=0·339; diet:day: F 12,275=2·798, P=0·001). Supplementation of chia seeds significantly decreased the n-6:n-3 ratio until day 10, while no changes were observed for the remaining supplements (chia: χ 2=28·149, P<0·001; walnut: χ 2=3·141, P=0·534; peanut: χ 2=6·961, P=0·138; control: χ 2=4·827, P=0·306). Compared to the control diet, a significantly decreased n-6:n-3 ratio from day 5 was detected due to chia seeds (Fig. 1(d) and Table 2).
Saliva cortisol concentrations
Isolation housing
Model 1, considering effects of plasma ALA and LA, yielded significant main effects of both PUFA on saliva cortisol concentrations during isolation housing, which did not differ between single days or sexes (Table 3). Saliva cortisol concentrations were negatively affected by plasma ALA levels (Fig. 2(a)) and positively by plasma LA levels (Fig. 2(b)). Subsequently analysing the effects of total plasma PUFA levels and the plasma n-6:n-3 ratio in model 2 revealed a positive effect of total PUFA on saliva cortisol concentrations during isolation housing (Table 3 and Fig. 2(c)). Moreover, an effect of the plasma n-6:n-3 ratio differed significantly between days (Table 3). The n-6:n-3 ratio had no effect on saliva cortisol concentrations on day 0, significantly positive effects on days 5, 10 and 15, and showed no effect on day 20 (day 0: χ 2=0·496, P=0·481; day 5: χ 2=3·895, P=0·048; day 10: χ 2=18·396, P<0·001; day 15: χ 2=11·421, P=0·001; day 20: χ 2=0·541, P=0·462). Higher levels of plasma n-3 in relation to n-6 PUFA resulted in lower cortisol concentrations from day 5 to 15 (Fig. 2(d)).
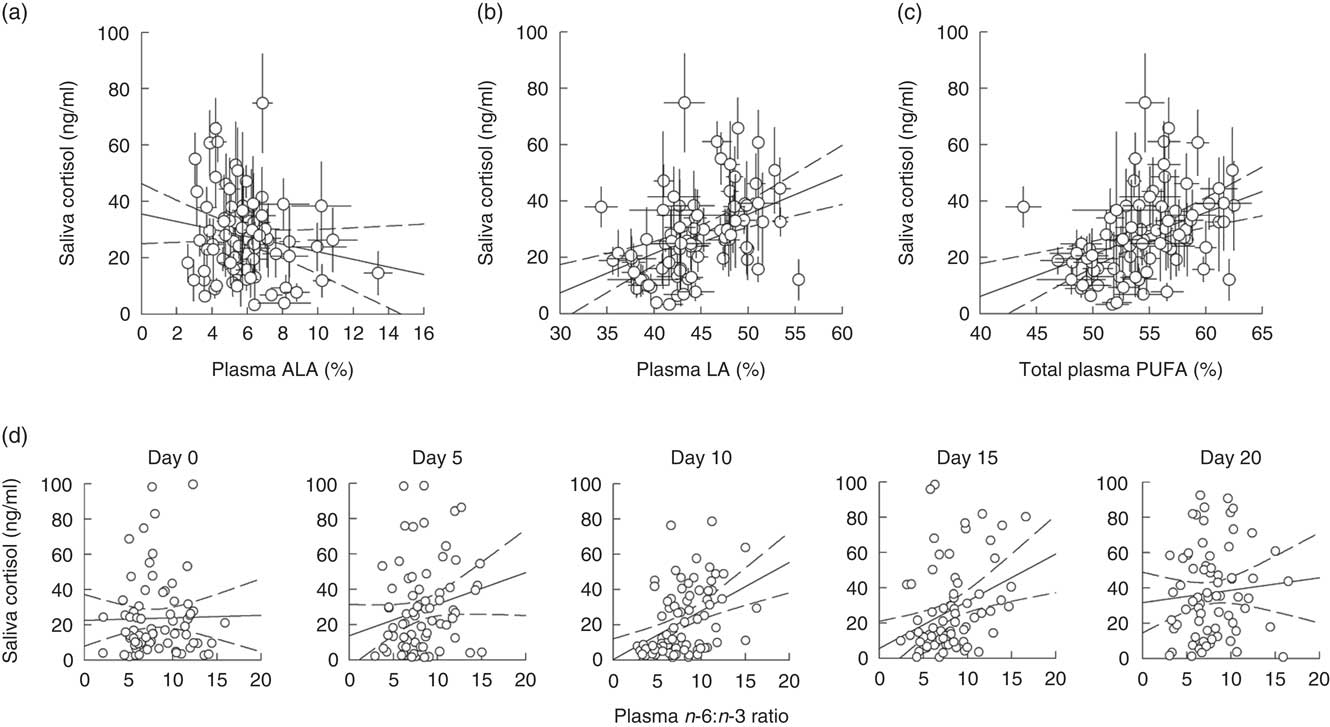
Fig. 2 Raw data plots for significant effects of plasma PUFA patterns on saliva cortisol concentrations during isolation housing. Effects of (a) plasma α-linolenic acid (ALA, 18 : 3n-3; P≤0·01) and (b) plasma linoleic acid (LA, 18 : 2n-6; P≤0·05) analysed in model 1. Effects of (c) total plasma PUFA (P≤0·05) and (d) the plasma n-6:n-3 ratio (day 0: NS; day 5: P≤0·05; day 10: P≤0·001; day 15: P≤0·001; day 20: NS; between days: P≤0·01) analysed in model 2. (a–d) Plasma ALA, LA and total PUFA as percentage of total fatty acids are plotted as averaged data per individual. Values are means, with their standard errors. Dashed lines represent 95 % CI. For model statistics see Table 3.
Table 3 Type 3 ANOVA results of full and fitted models for the effects of the plasma PUFA status on saliva cortisol concentrations (log transformed) during isolation housing*
ALA, α-linolenic acid (18 : 3n-3); LA, linoleic acid (18 : 2n-6).
* Model 1: effects of ALA and LA. Model 2: effects of total PUFA and the n-6:n-3 ratio. Models were fitted (removal of non-relevant and non-significant predictors) based on the Akaike information criterion. Intercepts for interaction effect coefficients: (sex) males, (day) day 0.
In addition, both models revealed that changing saliva cortisol concentrations from day to day in general differed significantly between the sexes (Table 3). Females exhibited no pronounced changes in their cortisol concentrations (χ 2=4·873, P=0·301) but male levels decreased until day 10 and strongly increased thereafter (χ 2=26·969, P<0·001) (Fig. 3). Male and female cortisol concentrations, however, did not differ on any day (P>0·05 for all post hoc comparisons). The dietary regimes per se showed no effect on saliva cortisol concentrations during the isolation housing period. Therefore, all diet-related effects were removed from the analyses during model fitting (Table 3).
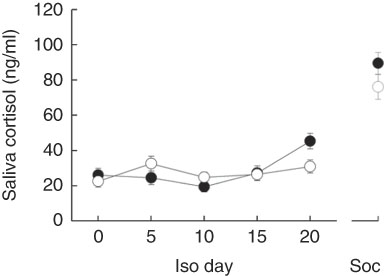
Fig. 3 Saliva cortisol concentrations in male (![]() ) and female (
) and female (![]() ) guinea pigs during isolation housing (Iso) and social confrontations (Soc). Values are means, with their standard errors. Day 0–20: P≤0·01; Soc: NS.
) guinea pigs during isolation housing (Iso) and social confrontations (Soc). Values are means, with their standard errors. Day 0–20: P≤0·01; Soc: NS.
Social confrontations
Saliva cortisol concentrations similarly increased in both sexes in response to social confrontations (F 1,77=64·641, P<0·001).
Analysing the effects of plasma ALA and LA levels on saliva cortisol concentrations during social confrontations in model 1 revealed a significant main effect of ALA and an interaction of LA and sex (Table 4). ALA negatively affected cortisol concentrations (Fig. 4(a)), whereas plasma LA levels had no effect in males (F=2·746, P=0·102) but positively affected cortisol concentrations in females (F=6·924, P=0·011) (Fig. 4(b)). Considering total plasma PUFA levels and the plasma n-6:n-3 ratio in model 2 yielded a similar interaction of total PUFA and sex (Table 4). This was caused by a slightly negative effect in males (F=3·314, P=0·073) and a positive one in females (F=3·312, P=0·073) (Fig. 4(c)). The plasma n-6:n-3 ratio showed a positively pronounced effect on saliva cortisol concentrations during social confrontations (Table 4). Similar to the isolation period, lower saliva cortisol concentrations during social confrontations were associated to higher plasma n-3 in relation to n-6 PUFA (Fig. 4(d)).
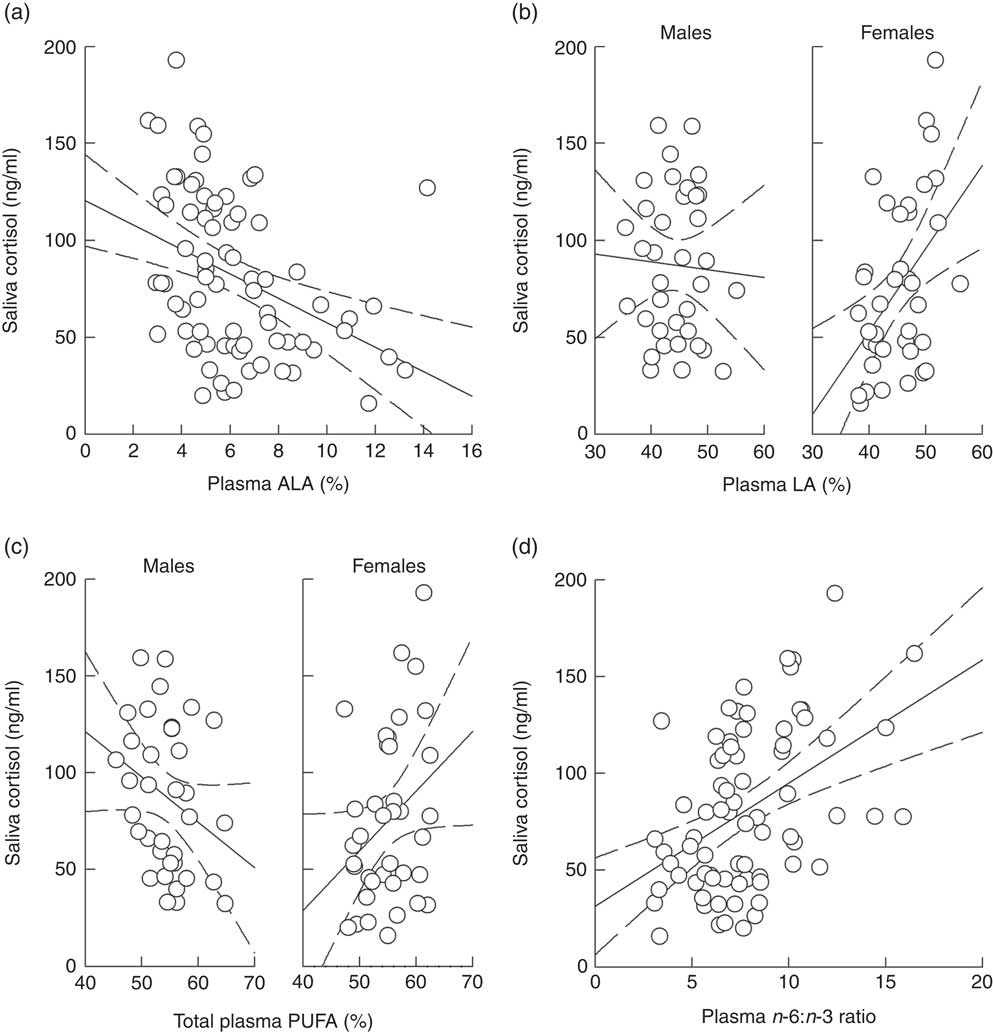
Fig. 4 Raw data plots for significant effects of plasma PUFA patterns on saliva cortisol concentrations during social confrontations. Effects of (a) plasma α-linolenic acid (ALA, 18 : 3n-3; P≤0·01) and (b) plasma linoleic acid (LA, 18 : 2n-6; males: NS; females: P≤0·05; males v. females: P≤0·01) analysed in model 1. Effects of (c) total plasma PUFA (males: NS; females: NS; males v. females: P≤0·05) and (d) the plasma n-6:n-3 ratio (P≤0·01) analysed in model 2. (a–d) Plasma ALA, LA and total PUFA as percentage of total fatty acids. Dashed lines represent 95 % CI. For model statistics see Table 4.
Table 4 Type 3 ANOVA results of full and fitted models for the effects of the plasma PUFA status on saliva cortisol concentrations (log transformed) during social confrontations*
ALA, α-linolenic acid (18 : 3n-3); LA, linoleic acid (18 : 2n-6).
* Model 1: effects of ALA and LA. Model 2: effects of total PUFA and the n-6:n-3 ratio. Models were fitted (removal of non-relevant and non-significant predictors) based on the Akaike information criterion. Intercepts for interaction effect coefficients: (sex) males, (day) day 0.
In addition, both models revealed a positive effect of baseline saliva cortisol concentrations and a negative effect of socio-positive interactions on saliva cortisol concentrations during social confrontations (Table 4). All diet-related effects were removed during model fitting again, as diet showed no influence on saliva cortisol concentrations during social confrontations (Table 4).
Discussion
The present results confirm our assumption that changing plasma non-esterified PUFA patterns can profoundly affect glucocorticoid secretion rates in the short-term. Although we supplemented relatively low concentrations of natural sources high in the essential PUFA ALA and LA in this study, they remarkably affected the plasma PUFA status and a plateau phase was reached in a very short time span. ALA and LA showed opposed effects on saliva cortisol concentrations both during basal and stimulated conditions. However, effects of the plasma n-6:n-3 ratio varied with changing plasma PUFA patterns and saliva cortisol concentrations. This may be highly important regarding short-term influences of PUFA on HPA axis functions and the control of energy balance under changing environmental and/or physiological conditions.
Our analyses revealed that basal and socially stimulated saliva cortisol secretion rates were predicted by altering plasma PUFA patterns, whereas the dietary supplements per se showed no effects at all. Possible side effects caused by other nutrients included in the chosen PUFA sources, as previously discussed example for walnuts( Reference Willis, Shukitt-Hale and Cheng 31 , Reference Tapsell, Gillen and Patch 32 ), can therefore be excluded in this study. Nevertheless, the dietary supplements contributed to the modulation of the HPA axis and cortisol secretion rates indirectly by their significant effects on plasma PUFA patterns. As already mentioned, an unexpected and remarkably fast plateau phase in plasma PUFA, especially in plasma ALA levels and the n-6:n-3 ratio, was reached after approximately 10 d of supplementation. This corresponds to recent findings in beagles, which showed that dose-dependent effects of dietary DHA are related to a steady state in plasma after 28 d of supplementation or perhaps even earlier( Reference Dahms, Bailey-Hall and Salem 33 ). Further supplementation beyond this time span did not affect plasma DHA levels considerably. These indications for a relatively fast steady state or plateau phase in plasma PUFA is highly interesting because it was recently shown that plasma non-esterified DHA represents the major pool supplying the brain with this essential molecule( Reference Chen, Kitson and Hopperton 34 ). A stable plasma PUFA pool maintained by regular and adequate dietary intake would therefore be of major importance to supply the brain with sufficient PUFA, which would be highly essential regarding the maintenance of optimal neurophysiological and metabolic processes( Reference Salem, Litman and Kim 35 , Reference Sinclair, Attar-Bashi and Lib 36 ). With regard to our findings, a plateau phase in plasma ALA and the lowered n-6:n-3 ratio following chia seeds supplementation was definitely of major relevance regarding cortisol secretion rates in the studied guinea pigs too. This was achieved by supplementing the animals with 500 mg chia seeds/kg body mass, which increased the total energy intake by 3·3 % only (control diet: 308·28 kJ/d; chia diet: 318·44 kJ/d) but resulted in a 3-fold increase in the available energy from dietary ALA from 0·48 % in the standard control diet to 1·52 % (calculations based on manufacturer information for the guinea pig pellets and the US Department of Agriculture National Nutrient Database( 23 )). This would be comparable to recommended dietary ALA intakes in humans( Reference Simopoulos 37 ), although differences in metabolic pathways and plasma PUFA accumulations have to be assumed. However, walnut supplementation tended to increase plasma ALA levels as well, but their pronounced positive effect on plasma LA definitely makes them a less valuable n-3 PUFA source compared with chia seeds.
Saliva cortisol concentrations during isolation housing were diminished by the plasma n-3 PUFA status, including elevated plasma ALA and a decreased n-6:n-3 ratio. This effect corresponds to previous findings( Reference Nemeth, Millesi and Wagner 9 , Reference Rabinovitz, Mostofsky and Yehuda 38 ), although this was seldom shown with regard to plasma non-esterified PUFA levels. A specific effect of plasma non-esterified ALA on the regulation of HPA axis activity, as shown for the saturated palmitic acid in rats( Reference Oh, Kim and Kang 13 ), could therefore be assumed. Opposed and rather stimulating effects were detected for LA and total PUFA levels, which would argue for increased adrenal steroidogenesis( Reference Widmaier, Margenthaler and Sarel 17 ). However, as LA was the predominant plasma PUFA in all animals used in this study, probably because LA was the major fatty acid in the standard pellet diet, the stimulating effect of total PUFA levels on saliva cortisol concentrations definitely reflects the effect of the n-6 LA. If we would have analysed effects of total plasma PUFA levels without referring to ALA and LA, this could have resulted in a misinterpretation regarding the effects of plasma PUFA patterns on saliva cortisol concentrations. Differentiating effects of single types of plasma fatty acids is therefore definitely of major importance to unravel their effects on HPA axis functions.
Saliva cortisol concentrations were positively linked to the plasma n-6:n-3 ratio from day 5 to 15 after the onset of supplementation, whereas the strongest effect was detected on day 10. This coincides with the onset of the plasma PUFA plateau phases. This finding would imply a high sensitivity of the HPA axis to an altered plasma n-6:n-3 ratio following changes in specific plasma PUFA. Studies conducted in rats and humans so far showed that effects of altered plasma NEFA concentrations on HPA axis activities usually occur immediately, at least within 30 min( Reference Lanfranco, Giordano and Pellegrino 14 , Reference Oh, Oh and Kang 39 ), and seemingly disappear with clearance of NEFA from plasma( Reference Lanfranco, Giordano and Pellegrino 14 ). Our results suggest that such an effect in terms of the plasma n-6:n-3 ratio was prolonged or enhanced by continuous supplementation. In addition to an assessment of the nutritional status by the hypothalamus, resulting in a modulation of HPA axis activity in the short-term( Reference Lam, Schwartz and Rossetti 12 ), a higher mobilisation rate of stored n-3 compared with n-6 PUFA for subsequent oxidation( Reference Raclot 40 ) could have additionally modulated HPA axis activity in the long-term. Such an effect could have been indicated in humans where n-3 PUFA supplementation diminished HPA axis activity and energy expenditure under stressful conditions( Reference Delarue, Matzinger and Binnert 41 ). This could have also resulted in lower saliva cortisol concentrations with decreasing n-6:n-3 ratios from day to day in the studied guinea pigs here. However, different effects of n-3 and n-6 PUFA on adrenal steroidogenesis( Reference Xie, Wang and Mick 20 ) or globulin binding capacities( Reference Martin, Vranckx and Benassayag 42 ) cannot be excluded, which may have affected cortisol secretion rates in the short- and/or long-term too. We suggest that the opposed effects of n-3 and n-6 PUFA and perhaps different accumulation rates of ALA and LA resulted in more variable cortisol secretion rates in response to a changing plasma n-6:n-3 ratio.
Nevertheless, as soon as the plateau phase in plasma PUFA was reached, the effect of the n-6:n-3 ratio disappeared at day 20 of isolation housing. This was the same day when males showed increasing saliva cortisol concentrations and decreasing plasma LA and total PUFA levels. Male and female individuals usually differ in PUFA accumulation and metabolism rates, which is probably caused by positive effects of female sex hormones on enzyme activities involved in fatty acid metabolism( Reference Sibbons, Thomas Brenna and Lawrence 43 , Reference Extier, Perruchot and Baudry 44 ). However, no sex difference in plasma PUFA patterns was detected in the studied guinea pigs. Nevertheless, due to this general sex difference reported by other studies, male individuals may be more dependent on adequate dietary PUFA intake and perhaps show a higher physiological susceptibility to altered plasma PUFA patterns. This could have been indicated by a slightly pronounced decrease in saliva cortisol concentrations until day 10 in male guinea pigs here, which coincides with plasma PUFA accumulation. In addition, also their increasing concentrations thereafter when the plateau phase was reached and plasma LA decreased, perhaps due to its oxidation( Reference Sanz, Lopez-Bote and Menoyo 45 ), may be indicative for such a sex-specific susceptibility. We therefore conclude that while a decreasing plasma n-6:n-3 ratio in general diminished basal HPA axis activity in the short-term, no such effect can be assumed in the long-term linked to the plateau phase. This may be supported also by the missing effect of the plasma n-6:n-3 ratio on day 0. At this stage plasma PUFA pattern reflected the pool, which resulted from the standard diet before the supplementation. Short-term PUFA supplementation and the acute PUFA availability in plasma may therefore be more beneficial compared with a continuous long-term supplementation regarding basal HPA axis activity.
Although we initially detected individually different plasma PUFA patterns on day 0, which required statistical corrections to these baseline values in order to extract effects of the supplementation procedure only, no effects on saliva cortisol concentrations and also no group and/or sex differences in saliva cortisol concentrations were detected at this stage. We highly assume that the very low plasma PUFA levels on day 0, presumably resulting from the minimal PUFA concentrations in the standard diet (guinea pig pellets, fresh vegetables and hay), were also too low at this stage to show any effects on saliva cortisol concentrations. The social environment the animals were housed in, including social interactions, represents a very strong modulator of individual cortisol concentrations( Reference Nemeth, Millesi and Puehringer-Sturmayr 21 ), which might have affected baseline saliva cortisol concentrations in the beginning too. However, such a possible influence was extinguished by the social isolations and effects on saliva cortisol concentrations are definitely attributable to changing plasma PUFA patterns only.
Subjecting guinea pigs to social confrontations with unfamiliar individuals is highly stressful( Reference Nemeth, Millesi and Wagner 9 ) and resulted in increased saliva cortisol concentrations in this study too. As neither agonistic interactions, nor locomotor activity affected saliva cortisol responses to social confrontations, the novel environment as a whole can be assumed to increase HPA axis activity and related cortisol concentrations in guinea pigs. However, as socio-positive interactions diminished cortisol responses, correcting saliva cortisol concentrations to displayed behaviours during this social setup was obviously highly important to extract effects attributed to plasma PUFA only. Sexually different effects of plasma LA on saliva cortisol concentrations were detected during stressful social confrontations, insofar as male cortisol concentrations were no longer positively affected. This resulted in similar cortisol concentrations in males and females during social confrontations, which are usually higher in males during this setup( Reference Nemeth, Millesi and Wagner 9 , Reference Nemeth, Millesi and Puehringer-Sturmayr 21 ). In this social environment, LA partly diminished the HPA axis and cortisol responses in males additionally to ALA, perhaps due to increased β-oxidation rates( Reference Sanz, Lopez-Bote and Menoyo 45 ). Interestingly, along with this social stressor the plasma n-6:n-3 ratio affected saliva cortisol concentrations again, which indicates a long-term effect related to plasma PUFA patterns. Although no effect of the n-6:n-3 ratio was detected with the occurrence of its plateau phase at the end of the isolation housing period, a maintenance of this seemed to be important in modulating the HPA axis and cortisol response to subsequent social confrontations. This would imply that the plasma n-6:n-3 ratio positively affects HPA axis functions with regard to altered physiological conditions and impacts on homoeostasis, analogous to changing NEFA concentrations or increased cortisol secretion rates. Such a scenario could explain positive long-term effects of dietary n-3 PUFA and lower n-6:n-3 ratios on glucocorticoid secretion rates, which were described mainly under stressful or adverse physiological conditions so far ( Reference Ferraz, Delattre and Almendra 7 , Reference Hennebelle, Balasse and Latour 8 , Reference Rabinovitz, Mostofsky and Yehuda 38 , Reference Song, Li and Leonard 46 ). Altered plasma PUFA patterns may be of major importance regarding basal HPA axis activity in the short-term, but long-term maintenance of the plasma PUFA pool could be important to supply the brain continuously and therefore modulating neurophysiological and HPA axis functions long-lastingly. This may highlight the importance of the n-6:n-3 ratio with regard to the reactivity of the HPA axis under stimulated conditions. Chronically elevated glucocorticoid secretion rates can result in glucocorticoid receptor resistance, which negatively affects HPA axis and glucocorticoid responses to stressful events or immune challenges, impairs the immune system, and even increases the risk for diseases( Reference DuRant, Arciniega and Bauer 47 , Reference Cohen, Janicki-Deverts and Doyle 48 ). An adequate dietary n-3 PUFA intake and n-6:n-3 ratio may promote the HPA axis even under stimulated conditions and still enable appropriate stress responses in order to cope with the prevalent conditions. However, our assumption for these highly flexible effects of the plasma n-6:n-3 ratio remains to be determined.
We conclude that short-term effects of dietary PUFA intake on basal cortisol secretion rates are highly related to plasma PUFA accumulation rates and presumably not linked to any long-lasting influences on neurophysiological functions. Although we supplemented the PUFA sources for a relatively short time span, long-term influences may have been indicated in relation to the n-6:n-3 ratio at the end of the 20-d isolation housing period by affecting physiological stress responses to social confrontations but showing no effect on basal cortisol concentrations linked to the plateau phase. This would also argue for time-limited positive short-term effects of PUFA. It remains to be determined experimentally if these effects may be related to specific short-chain or long-chain PUFA, but changes in plasma non-esterified PUFA patterns can definitely modulate basal and stimulated HPA axis functions and therefore possibly contribute to the control of energy balance. Such physiological reactions may be of importance regarding therapeutic effects of short-term PUFA supplementation according to chronically increased cortisol concentrations and HPA axis dysfunctions, which are often accompanied by or co-responsible for a variety of serious neurophysiological and metabolic diseases( Reference Nieuwenhuizen and Rutters 1 , Reference Chrousos 49 , Reference Dearden and Ozanne 50 ). This includes CVD, diabetes, obesity, the metabolic syndrome or depression. By affecting the plasma PUFA pool and obtaining an adequate plasma n-6:n-3 ratio in a very short time span of dietary PUFA intake, a fast emergence of long-lasting anti-stress and anti-inflammatory effects of n-3 PUFA and their metabolites may be highly beneficial in the prevention of such diseases( Reference Delgado-Lista, Perez-Martinez and Lopez-Miranda 51 , Reference Stables and Gilroy 52 ). Nevertheless, even under acute stress conditions, a short-term supplementation with n-3 PUFA can show positive effects via changing plasma PUFA patterns that may help diminishing cortisol concentrations and maintaining homoeostasis. Therefore, in addition to the well-known positive long-term effects of dietary n-3 PUFA supplementation and lowered dietary n-6:n-3 ratios regarding disease prevention( Reference Simopoulos 53 ), even short-term supplementations and effects should be considered, especially as the HPA axis seemingly responds very fast to changes in dietary PUFA intakes.
Acknowledgements
The authors would like to thank Alexandra Christian, responsible for animal maintenance, Elisabeth Pschernig for help in hormone analyses, and Daniel Toferer, Yvonne Millner and Tanja Eberhart for help in plasma fatty acid analyses.
This research received no specific grant from any funding agency, commercial or not-for-profit sectors.
M. N. and B. W. conceived and designed the experiments. M. N. performed the experiments. M. N. analysed the data. E. M., K. H. W. and B. W. contributed reagents, materials and analysis tools. All authors participated in the writing of the manuscript and approved the final version.
The authors declare that there are no conflicts of interest.


