In mammals, development of the thymus starts in the early phase of gestation when thymocyte progenitors travel from the bone marrow via the blood stream to colonise the thymic anlage(Reference Palmer1,Reference Kan, Razzaghian and Lavoie2) . As it is particularly sensitive to its environment(Reference Savino3,Reference Savino, Dardenne and Velloso4) , early-life nutrition is a major determinant in the development of the thymus(Reference Prentice5,Reference Prescott6) . In humans, fetal malnutrition is associated with altered development and premature involution of the thymus(Reference McDade, Beck and Kuzawa7,Reference Moore8) . Consequently, immune function can be permanently impaired later in life(Reference McDade, Beck and Kuzawa9,Reference Moore, Collinson and Tamba N’Gom10) . Animal studies have demonstrated that malnutrition during development induces an involution of the thymus due to massive cell apoptosis in the thymic cortex during the early stages of thymopoiesis(Reference Contreras, Yu and Hale11–Reference Qu, Ma and Yan15). The lymphotoxin β receptor controls early thymic colonisation by blood-borne thymocyte progenitors from bone marrow and allows terminal differentiation of medullary thymic epithelial cells involved in the acquisition of self-tolerance(Reference Lucas, James and Cosway16,Reference White, Nakamura and Jenkinson17) . In the thymic cortex, a predominant positive selection process leads thymocytes to differentiate from the double-negative CD4–CD8– stage to the double-positive (DP) CD4+CD8+ stage. Double-positive thymocytes enter the thymic medulla to undergo a negative selection process(Reference Kondo, Ohigashi and Takahama18). At this stage, medullary thymic epithelial cells orchestrate the presentation of antigens from virtually all organs to maturing thymocytes via MHC type II molecules expressed on thymic dendritic cells(Reference Anderson, Venanzi and Klein19). This process called promiscuous gene expression is highly regulated by the autoimmune regulator (AIRE), an intra-nuclear regulating factor of gene expression highly active in medullary thymic epithelial cells(Reference Passos, Speck-Hernandez and Assis20,Reference Speck-Hernandez, Assis and Felicio21) . This process leads to the acquisition of self-tolerance by the negative selection of CD4+CD8+ thymocyte subsets that are potentially autoreactive against self-antigens(Reference Passos, Mendes-da-Cruz and Oliveira22). Human genetic congenital gene defects such as autoimmune polyendocrine syndrome type 1, also called autoimmune polyendocrinopathy-candidiasis-ectodermal dystrophy, and knock-down murine models demonstrate the crucial role of AIRE in the prevention of autoimmunity(Reference Conteduca, Indiveri and Filaci23,Reference Klein24) . In rats, a CD4+CD8+ DP lymphocyte subpopulation is usual in the blood stream(Reference Kenny, Mason and Pombo25). These cells will undergo final maturation in peripheral lymphoid organs(Reference Jimenez, Sacedon and Vicente26). While early malnutrition in postnatal life impairs thymic development and immune function at young ages(Reference Contreras, Yu and Hale11,Reference Heppolette, Chen and Carr12,Reference Badr and Mohany27–Reference Tarry-Adkins, Aiken and Ashmore29) , few animal studies report the consequences of intra-uterine growth restriction (IUGR) induced by fetal malnutrition on thymic structure and function at adulthood. The purpose of the present study is to describe the consequences of maternal malnutrition during gestation on thymic growth, thymic structure and the proportions of thymocyte and lymphocyte subpopulations in adult rat offspring.
Materials and methods
Animal model
The ethics committee for animal research at the University of Lausanne approved the experimental protocol presented below and the Cantonal Veterinary authority registered it under reference VD3050. Male and female Sprague–Dawley rats (Charles River) were individually housed. Rats had free access to tap water and were kept on standard laboratory rat chow in a room with a 12 h light–12 h dark cycle, maintained at a controlled temperature of 22°C and constant humidity. One week after acclimatisation, females were mated overnight with males. The day on which sperm was seen in a vaginal smear was designated as day 1 of gestation. Pregnant rats were then randomly allocated to either a control diet (CTRL, 23 % casein (Scientific Animal Food & Engineering (SAFE) U-8959, version 1) or to an isoenergetic low-protein diet (9 % casein (SAFE U-8959, version 40)(Reference Grandvuillemin, Buffat and Boubred30). These diets were proposed ad libitum, from the day of conception until delivery. All the litters from which the sample animals originated comprised between ten and twelve pups at birth. The mean birth body weight of pups was not significantly different between litters that were exposed to control or maternal low-protein diet (mLPD) prenatally. At birth, the litters were then equalised to ten pups in both groups to ensure a standardised nutrient supply. In the postnatal period, sample animals were randomly selected within litters for both groups. Every sample animal originated from a separate litter. Body weight was measured along a weekly pattern using the same scale for all sample animals (mLPD: n 8; CTRL: n 7). Sample animals of both groups accessed a standard ad libitum chow diet. The food intake was individually measured throughout a 10-d period and standardised to individual body weight at postnatal day 180 (PND180). Throughout the study period, we took care to avoid suffering and to ensure animal welfare, for example, improving the cage environment. We did not observe signs of pain, suffering or evidence for individual or collective infection among animals. No animal died or became moribund so that earlier kill was necessary within the study period. At PND180, the animals were euthanised by an intraperitoneal injection of pentobarbital (Esconarkon, Streuli Pharma AG, at a dose of 150 mg/kg of body weight) followed by exsanguination.
Morphological and histological study
The thymic index was calculated as the ratio between the thymic weight and the body weight (mLPD: n 10; CTRL: n 8). Freshly collected thymuses were fixed in formol (4 %) and then paraffin embedded. Equatorial cross-sectional slices (5 μm) were obtained with a microtome and then stained with haematoxylin–eosin for gross histological evaluation. Total thymic area and thymic medullar area were assessed using a Nikon Eclipse Ti2 microscope with dedicated optical assistance imaging software (NIS-Elements Viewer version 4.5). Slices were randomly and blindly assessed by a single examiner (J.-B. A.). The cortico-medullar ratio (CMR) was calculated as following: ((total thymic area – thymic medullar area)/medullar area). For each sample animal, the CMR value represents the mean obtained from two to six measurements for each slice (mLPD: n 5; CTRL: n 4).
Assessment of protein expression of thymic functional markers
Thymic proteins were extracted (mLPD: n 4; CTRL: n 5) using 200 μl of radioimmunoprecipitation assay buffer (HEPES pH 7·9; 1·5-mm MgCl2; 10-mm KCl; 1-mm EDTA; 10 % glycerol; 1 % NP-40) (Sigma-Aldrich). Prior to tissue homogenisation, a mini protease inhibitor tablet (Roche Diagnostics) was added to the lysis buffer. Immediately after protein solubilisation, sonication was applied to protein solutions. The sonication protocol comprised application of 20-kHz ultrasonic wave during 10 s at 130 W (Sonics Vibra-Cell V130; Merck). The homogenate was then centrifuged at 17 530 g for 25 min at 4°C, and the supernatant was retained for protein quantification (Pierce BCA Protein Assay Kit; Thermo Scientific) before Western blot analysis. Denatured (10 min at 70°C) thymic proteins (20 μg) from both groups were separated on the same gradient gel (NuPAGE 4–12 % Bis-TRIS gel; Thermo Scientific) and transferred overnight at 4°C to Whatman nitrocellulose membranes (Thermo Scientific). Ponceau staining (Thermo Scientific) confirmed the presence of proteins on the membranes. All primary antibody incubations were performed in blocking buffer (Tris-buffered saline (TBS)-Tween 2 %-bovine serum albumin 3 %) overnight at 4°C. Antibodies against AIRE (goat, 1/1000; Abcam), LtβR (goat, 1/1000; Sigma Aldrich), Forkhead Box P3 (FoxP3) (rabbit, 1/1000; NovusBio), actin (rabbit, 1/1000; Cell Signaling) were used. Incubations with anti-goat (1/4000; Santacruz) or anti-rabbit secondary antibodies (1/2000; Cell Signaling) were performed for 1 h at room temperature in blocking buffer (TBS-Tween 2 %-bovine serum albumin 3 %). The antibodies were visualised using enhanced chemiluminescence Western blotting substrate (Thermo Scientific). A G-BOX Imaging System (GeneSys, Syngene) was used to detect specific bands, and the optical density of each band was measured using the GeneTools software (Syngene) for all blots.
Thymic cell suspension preparation
Freshly collected thymuses were processed by gently passing whole organs through a fine mesh sieve to produce a single-cell suspension in Dulbecco’s modified Eagle’s medium/3 % fetal calf serum. Subcellular debris was removed by centrifugation at 550 g for 15 min at 4°C. Cell aggregates were removed by filtering through a 40-μm mesh filter cap. A normalised count of thymic viable cells (thymic cellularity/thymic weight) was performed by trypan blue exclusion using a Neubauer’s cell counter for sample thymuses of both groups (mLPD: n 6; CTRL: n 3).
Blood sample preparation
Blood was sampled by total blood exsanguination (needle puncture and syringe aspiration through abdominal aorta) immediately after lethal anaesthesia and then stored on ice at 4°C until processing. Peripheral blood mononuclear cells were isolated from whole blood sample isolated using Ficoll’s gradient method (centrifugation at 500 g for 30 min at 4°C).
Flow cytometry protocol
The staining protocol included a panel of fluorescent anti-rat antibodies against the following surface markers: CD3 (clone 1F4; allophycocyanin (APC) conjugate, BD Biosciences; phycoerythrin (PE)-Vio770 conjugate, Miltenyi), CD4 (clone OX35; PerCP-Fluor 710 conjugate, ThermoFisher), CD8 (clone OX8; APC Vio 770, Miltenyi; PerCP conjugate, BD Biosciences), CD25 (clone OX39; PE conjugate, BD Biosciences), CD31 (clone TLD-3A12; BB515 conjugate, BD Horizon; PE conjugate, BD Biosciences) and CD44 (Alexa Fluor 488 conjugate, R&D Systems). All antibodies against surface markers were used at 1/100. Intra-nuclear staining protocol for FoxP3 was performed according to the manufacturer’s guidelines (clone 150D; Alexa 647 conjugate; Bio Legend). After cell surface staining, cells were washed twice with fluorescent activated cell sorting (FACS) buffer and centrifuged at 250 g for 5 min at 4°C. The supernatant was discarded, and the cell pellet re-suspended in 1 ml of 1× BD fixation/permeabilisation buffer (BD Bioscience). Each tube was vortexed and incubated at 4°C in the dark for 20 min. After incubation, the cells were pelleted and washed twice with 1× BD Perm/Wash buffer and centrifuged at 250 g for 5 min at 4°C. After centrifugation, the cell pellet was re-suspended in 50 μl of 1× BD Perm/Wash buffer. Alexa 647 conjugated FoxP3 antibody (Clone 150D; Bio Legend) was added to each sample tube and incubated in the dark for 30 min at 4°C. Thereafter, the cells were washed twice with FACS buffer and centrifuged at 250 g for 5 min at 4°C. The supernatant was discarded, and the cell pellet re-suspended in 100 μl of FACS buffer. Cells were analysed immediately on a LSR-II (Becton Dickinson) flow cytometer. Stained cell samples were analysed on a Gallios© (Beckman Coulter) or LSR-II (Becton Dickinson) flow cytometer. The gating strategy was performed as follows: thymic cells were first gated to isolate lymphocytes based on their forward and side scatter profile (side scatter area v. forward scatter area) and then successively gated on the expression of CD4 and CD8 to quantify DP, double-negative and single-positive subsets cells among thymic cells (mLPD: n 8; CTRL: n 4). Lymphocytes were selected within peripheral blood mononuclear cells based on their forward and side scatter profile. CD3+ T-cells were than selected and gated based on their CD4 and CD8 expression. CD4+ T-cells were analysed for the expression of FoxP3+, and CD4 and CD8 single-positive subsets were gated for CD31 expression to isolate recent thymic emigrants (mLPD: n 8; CTRL: n 8). Results are reported as proportions (%) of selected cell subsets among the number of gated events (total cell count in sample) or selected surface markers. Flow cytometry data were analysed using the FlowJo, LLC software (Becton Dickinson).
Statistical analysis
We assessed homogeneity of variance between groups for each continuous variable using Fischer’s exact test. Mean values with their standard errors were compared between mLPD and CTRL groups using parametric Student’s t test or non-parametric Mann–Whitney U test according to sample size (t test if n ≥ 5 and U test if n < 5 in at least one group). Percentages and standard deviations were compared between groups. The statistical significance threshold of P-value was set at 0·05. Data were collected using Excel software (Office 365; Microsoft Inc.). Statistical tests were performed using GraphPad Prism software (version 7).
Results
Effects of maternal low-protein diet on body weight at birth and at adulthood
At birth, newborn male rat offspring exposed to mLPD during gestation presented a mean body weight significantly lower than that of newborn male rat offspring in the CTRL group (mLPD v. CTRL; mean values with their standard errors (g); 5·35 (sem 0·22) v. 8·14 (sem 0·41); P < 0·001). At PND180, the mean body weight of adult male rat offspring exposed to mLPD was significantly lower compared with CTRL (mLPD v. CTRL; mean values with their standard errors (g); 707·6 (sem 30·1) v. 604·1 (sem 17·6); P < 0·05). These findings were observed despite a normal postnatal diet up to PND180 and absence of significant difference in normalised food intake between mLPD and CTRL groups (mLPD v. CTRL; mean values with their standard errors (g of chow diet/d per g of animal body weight); 28·60 (sem 4·68) v. 29·69 (sem 3·88); P = 0·89).
Effects of maternal low-protein diet on thymic morphology and histological structure
The mean thymic index in male rat offspring exposed to mLPD was lower compared with control group (mLPD v. CTRL; mean values with their standard errors; 0·40 (sem 0·04) v. 0·56 (sem 0·06); P < 0·05). The thymic ultrastructure was disorganised in mLPD group compared with CTRL: (1) the thymic cortex was thinner and (2) the cortico-medullar demarcation was less visible compared with the control group. The mean CMR was significantly lower in mLPD group relatively to control group (mLPD v. CTRL; mean values with their standard errors; 2·21 v. 2·82; P < 0·05) (Fig. 1).

Fig. 1. Thymic microscopy at adulthood. (a) Representative views of thymic slices stained with haematoxylin–eosin at magnification ×4. ‘C’ stands for cortex and ‘M’ for medulla. (b) Comparison of mean thymic cortico-medullar ratio with their standard errors between maternal low-protein diet (mLPD) and control (CTRL) groups (mLPD: n 5; CTRL: n 4; * P < 0·05).
Effects of maternal low-protein diet on thymic protein expression
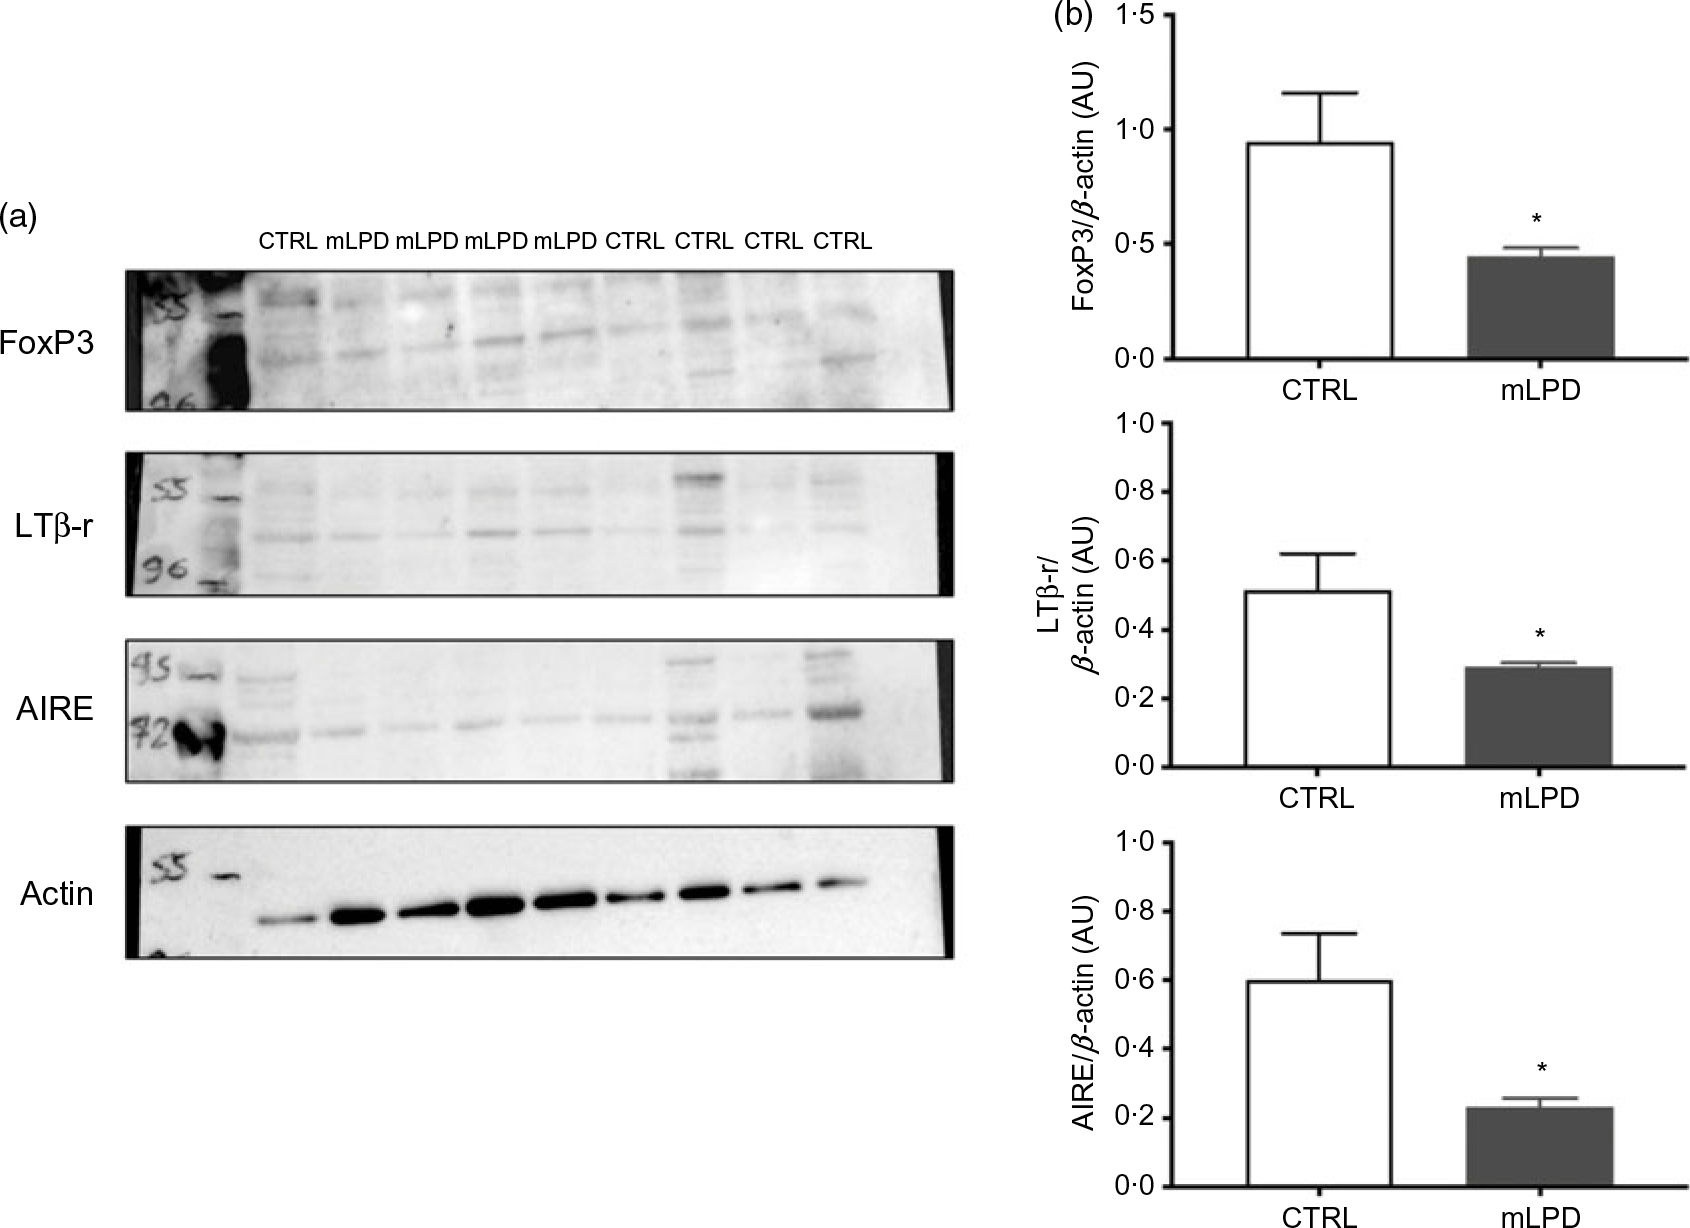
The intrathymic protein expression of lymphotoxin β receptor was significantly decreased in mLPD group compared with control group (mLPD v. CTRL; mean values with their standard errors (arbitrary units, AU); 0·22 (sem 0·01) v. 0·47 (sem 0·07); P = 0·01). The intrathymic protein expression was also decreased in mLPD compared with CTRL regarding AIRE (mLPD v. CTRL; mean values with their standard errors (AU); 0·25 (sem 0·04) v. 0·77 (sem 0·15); P = 0·02) and FoxP3 (mLPD v. CTRL; mean values with their standard errors (AU); 0·46 (sem 0·05) v. 1·15 (sem 0·20); P = 0·01) (Fig. 2).

Fig. 2. Intrathymic protein expression of selected functional markers. (a) Quantification of protein expression of lymphotoxin β receptor (LTβ-r), autoimmune regulator (AIRE) and Forkhead Box P3 (FoxP3) in Western blot using actin expression as reference. (b) Comparison of mean protein expression of respective markers of thymic function between maternal low-protein diet (mLPD) and control (CTRL) groups (mLPD: n 4; CTRL: n 5; * P < 0·05). AU, arbitrary units.
Effects of maternal low-protein diet on thymic cell maturation process
At PND180, the thymic cellularity was significantly lower in mLPD (mLPD v. CTRL; mean values with their standard errors (million cells/ml); 12·1 (sem 7·4) v. 52·3 (sem 5·8); P = 0·02). The proportion of DP CD4+CD8+ thymocyte subpopulation was not significantly different between mLPD and control groups (mLPD v. CTRL; 80·1 (sem 3·5) % v. 82·5 (sem 1·9) %; P = 0·27). Neither was the proportion of double-negative CD4–CD8– thymocyte subpopulation (mLPD v. CTRL; 2·56 (sem 0·9) % v. 2·75 (sem 1) %; P = 0·73). As a result, the ratio between respective proportions of DP and double-negative thymocyte subpopulations was not significantly different between groups (mLPD v. CTRL; 32·9 v. 33·9; P = 0·87). The ratio between respective CD4+ and CD8+ single-positive thymocyte subpopulations was significantly increased in mLPD compared with control group (mLPD v. CTRL; 3·43 v. 2·07; P = 0·05) (Fig. 3).

Fig. 3. Comparison of thymocyte subpopulations. (a) Example of gating strategy used to identify thymocytes in a whole thymus cell suspension. (b) Comparison of mean proportions (percentages with their standard errors) of thymocyte subpopulations between mLPD and CTRL groups. CD4+CD8+: DP thymocyte subpopulation; CD4–CD8–: DN thymocyte subpopulation; DP:DN: ratio between DP and DN thymocyte subpopulations; CD4+:CD8+: ratio between single-positive CD4+ and single-positive CD8+ thymocyte subpopulations (mLPD: n 8; CTRL: n 4; * P < 0·05). DAPI, 4′,6-diamidino-2-phenylindole; FSC-A, forward scatter area; SSC-A, side scatter area; APC, allophycocyanin; DN, double negative; DP, double positive; CTRL, control diet; mLPD, maternal low-protein diet.
Effects of maternal low-protein diet on thymic output
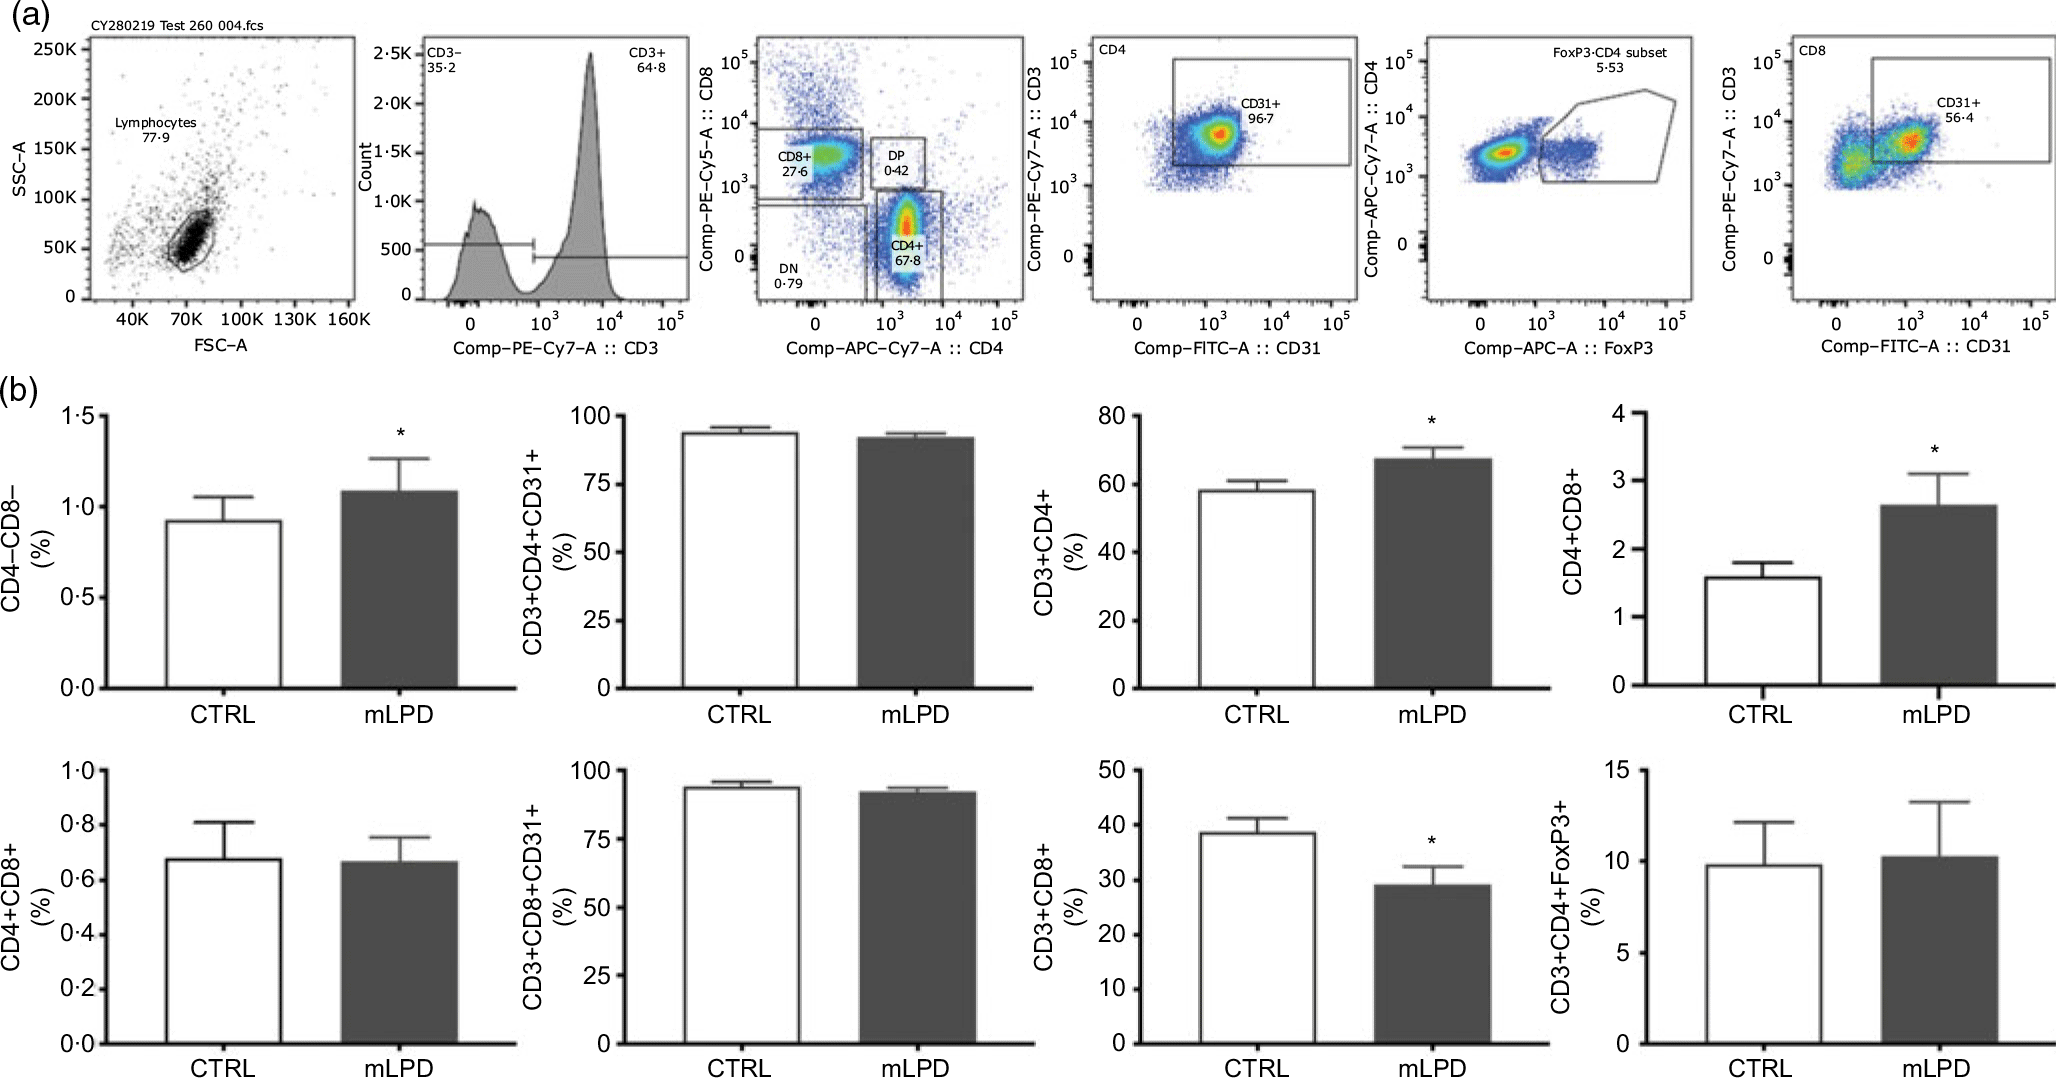
The normalised thymic viable cell count was lower in mLPD group (mLPD v. CTRL; mean values with their standard errors (million cells/ml per g of thymus); 84·8 (sem 19·9) v. 144·7 v. 10·1; P = 0·01). The proportion of CD4+ lymphocyte subpopulation circulating in peripheral blood was higher in mLPD group compared with control (mLPD v. CTRL; 67·7 (sem 8·9) % v. 58·4 (sem 7·4) %; P = 0·04). In contrast, the proportion of CD8+ lymphocyte subpopulation was significantly lower in mLPD group compared with control (mLPD v. CTRL; 29·2 (sem 9) % v. 38·8 (sem 7) %; P = 0·02). Consequently, the ratio between the respective proportions of CD4+ and CD8+ lymphocyte subpopulations was higher in mLPD group compared with control (mLPD v. CTRL; 2·65 v. 1·60; P = 0·05). The proportion of CD31+ lymphocyte subpopulation (recent thymic emigrants) was not significantly different between mLPD and control groups (mLPD v. CTRL; 92·2 v. 94·2 %; P = 0·35). The proportions of DP CD4+CD8+ lymphocyte subpopulation and CD3+CD4+FoxP3+ lymphocyte subpopulation were not different between mLPD and control groups (Fig. 4).

Fig. 4. Comparison of lymphocyte subpopulations. (a) Example of gating strategy used to identify CD4+ and CD8+ lymphocyte subpopulations in a whole blood sample. (b) Recent thymic emigrants (CD31+ lymphocytes) were secondarily identified among single-positive CD4+ and CD8+ lymphocyte subpopulations. Regulatory T lymphocytes (FoxP3+) were secondarily identified among CD3+CD4+ lymphocyte subpopulation (mLPD: n 8; CTRL: n 8; * P < 0·05). SSC-A, side scatter area; FSC-A, forward scatter area; PE, phycoerythrin; DN, double negative; DP, double positive; APC, allophycocyanin; FoxP3, Forkhead Box P3; FITC-A, fluorescein isothiocyanate-A; CTRL, control diet; mLPD, maternal low-protein diet.
Discussion
Low birth weight is known as a reliable surrogate marker of IUGR(Reference Palmer1). The exposure to mLPD during gestation is a definite condition for generating IUGR in rat offspring(Reference Swanson and David31). In the present study, we observed a lower birth weight in newborns exposed to mLPD confirming this effect as shown in a previous study(Reference Grandvuillemin, Buffat and Boubred30). In addition, a normalised consumption of chow diet similar to the control group in the postnatal period did not allow a ‘catch-up’ growth in animals exposed to mLPD, as demonstrated by a persistent lower mean body weight in the mLPD group at adulthood. This finding correlates with seminal work by Widdowson et al. who showed that early-life undernutrition has a sustained effect on long-term weight gain(Reference Widdowson and McCance32). Maternal low-protein diet permanently altered the development of thymic anatomy and histological structure as shown by the lower thymic index and lower CMR observed in mLPD group. Previous studies reported interesting findings in rat models of early malnutrition(Reference Heppolette, Chen and Carr12,Reference Chen, Tarry-Adkins and Heppolette33,Reference Baptista, Mayer and Fontes34) . Tarry-Adkins et al. reported comparable findings in a similar rat model exposed to mLPD. The decrease of thymic index and CMR was not observed in 3-month-old rat offspring but was present at 12 months of life(Reference Tarry-Adkins, Aiken and Ashmore29). Interestingly, Liu et al. reported similar findings in an ovine model of IUGR(Reference Liu, He and Zhang13). Here, we demonstrated that mLPD-induced IUGR induces morphological and histological alterations in the thymus observed as early as PND180.
We observed that mLPD altered the thymic protein machinery thanks to decreased expression of various checkpoint proteins: lymphotoxin β receptor regulating the colonisation of the thymus by early thymocyte progenitors(Reference Lucas, James and Cosway16), AIRE promoting acquisition of self-tolerance(Reference Perniola35) and FoxP3+ transforming CD4+ thymocytes into future regulatory T-cells(Reference Shevach36). To our knowledge, no previous study reported similar observations on these checkpoint markers of thymic function.
The thymus ensures that the selection and maturation of thymocytes aimed at becoming lymphocytes circulating in blood stream and in peripheral lymphoid organs(Reference Takaba and Takayanagi37). We observed an increased CD4:CD8 single-positive thymocyte subpopulation ratio in adult male rat offspring exposed to mLPD. In a model of postnatal malnutrition induced by maternal protein deprivation during lactation period, the CD4:CD8 thymocyte subpopulation ratio was increased at PND30(Reference da Silva, Salama and Renovato-Martins38). Liu et al. also reported an increased CD4:CD8 thymocyte subpopulation ratio in an ovine model of IUGR(Reference Liu, He and Zhang13). Contreras et al., using a rat model of IUGR induced by uterine artery ligature, reported a decreased thymocyte cell count at 3 weeks of life(Reference Contreras, Yu and Hale11). In these reports, the proportions of thymocyte subpopulations were assessed at earlier time points than PND180. Interestingly, Ortiz et al. observed a decreased CD4:CD8 thymocyte subpopulation ratio in a rat model of postnatal malnutrition, but the time point of thymocyte subpopulation assessment was not specified(Reference Ortiz, Cortes and Cortes14). Liu et al. reported interesting results on similarly altered thymocyte proportions in their ovine model of IUGR(Reference Liu, He and Zhang13). To our knowledge, no animal study has assessed the proportions of thymocyte subpopulations in adult rats exposed to mLPD-induced IUGR.
The CD31+ lymphocyte subpopulation (recent thymic emigrants) is a reliable marker of the thymic cell output(Reference Kohler and Thiel39). Surprisingly, we observed no difference between proportions of recent thymic emigrants between groups despite a dramatically decreased absolute thymic cellularity. We observed an increased proportion of CD4+ lymphocytes and a decreased proportion of CD8+ lymphocytes in mLPD group predicting the inversion of the CD4:CD8 lymphocyte subpopulations ratio. Most animal studies using a prenatal malnutrition model have described the assessment of lymphocyte subpopulations at earlier time points than PND180. In a similar model of fetal malnutrition, Badr et al. reported an increased CD4:CD8 lymphocyte subpopulations ratio in adult male rats without testing the statistical significance of this observation(Reference Badr and Mohany27). Lin et al. described an increased CD4:CD8 lymphocyte subpopulation ratio in newborn rats assessed during the gestational period; of note, the IUGR was an observational condition and not experimentally controlled(Reference Lin, Wang and Wang40). This finding is also reported in a study using an ovine model of IUGR(Reference Liu, He and Zhang13). The meaning of an increased CD4:CD8 lymphocyte subpopulation ratio is unclear in rats exposed to mLPD-induced IUGR. Human studies, in a context of undernutrition, provide data regarding a decreased CD4:CD8 lymphocyte ratio that is associated with higher susceptibility to severe viral infections(Reference Savino, Dardenne and Velloso4,Reference McBride and Striker41) . Moreover, the antibody response to routine immunisations was altered in adolescents exposed to early-life environmental stress including maternal malnutrition(Reference McDade, Beck and Kuzawa9,Reference Moore, Jalil and Szu42) . However, animal data are scarce. Phenotyping thymocyte subpopulations was considered relevant to provide markers of early alterations in the thymic cell selection process in a context of mLPD-induced IUGR. In a model combining fetal undernutrition and accelerated postnatal growth, Tarry-Adkins et al. reported an accelerated replicative senescence in thymocytes of adult rat thymuses, although the proportions of thymocyte and lymphocyte subpopulations were not assessed(Reference Tarry-Adkins, Aiken and Ashmore29). We report original and prolonged alterations in the proportions of the CD4 and CD8 subpopulations of thymocytes and lymphocytes in adult male rats exposed to mLPD-induced IUGR.
The proportion of DP CD4+CD8+ lymphocyte subpopulations was not different between groups. This subpopulation is normally observed in rats before undergoing final maturation in the periphery. The decreased protein expression of AIRE and FoxP3 seems not to have influenced the thymic output of this subpopulation. These data do not allow to conclude on an altered process of acquisition of self-tolerance(Reference Jimenez, Sacedon and Vicente26).
The understanding of early programming of thymocyte and lymphocyte development is emerging(Reference Takaba and Takayanagi37,Reference Paparo, di Costanzo and di Scala43) . Further investigation is needed to better understand the underlying regulating mechanisms explaining the developmental vulnerability of the thymus in the context of early malnutrition.
Limits and perspectives
Functional tests on circulating lymphocytes or immune challenge by injection of microbes or toxins would have helped to reveal the relevance of the thymic changes observed. Apoptotic mechanisms seem particularly enhanced in thymic cell maturation process in the context of malnutrition(Reference Ortiz, Cortes and Cortes14,Reference Qu, Ma and Yan15,Reference da Silva, Salama and Renovato-Martins38) . Yet, the present study was not designed to explore the related underlying mechanisms, especially enhanced apoptotic features in early cortical stages of thymocyte maturation(Reference Ortiz, Cortes and Cortes14,Reference Qu, Ma and Yan15) . Although the developing thymus is particularly sensitive to malnutrition, little is known about the underlying mechanisms altering the cell selection process in a thymus exposed to early malnutrition(Reference Savino3,Reference Prentice44) . As males are known to be particularly sensitive to early programming effects, a similar study including sample animals from both sex would help to decipher the sexual dimorphism often observed in immune dysfunction(Reference Palmer1,Reference Amarasekera, Prescott and Palmer45–Reference Radulescu, Ferechide and Popa47) .
Conclusion
We demonstrate that mLPD-induced IUGR leads to long-term alterations of thymic structure and thymic cell maturation process in adult male rat offspring. The investigation of developmental programming of the thymus must integrate physiological developmental plasticity that also shapes the immune system in the early life.
Acknowledgements
The Swiss Association for Information and Research on Rare Genetic Kidney Diseases and the University of Lausanne/Centre Hospitalier Universitaire Vaudois (ref. 30034) supported the development of the model designed for this multi-organ animal study on the long-term effects programmed by the IUGR.
J. B. A. designed the study, participated in animal sacrifices, harvested the thymuses, performed the histological assessment on thymic slices, prepared thymic cell suspensions and participated in cell staining protocol for flow cytometry analysis, supported the statistical analysis for all data and prepared the manuscript (MD student). Z. D. participated in the assessment of thymic macroscopy and protein expression (Master’s student). D. L. participated in thymocytes and lymphocytes preparation and staining for flow cytometry analyses and performed statistical analyses of flow cytometry data (PhD student). C. F. participated in thymic cell preparation and staining protocol for flow cytometry analyses. A. W. gave expertise and support in flow cytometry analysis. F. C. was the expert supervisor of the study. C. Y. participated in animal euthanising, performed the assessment of thymic macroscopy and protein expression, performed all statistical analyses except for flow cytometry data. U. S. was the principal investigator of the study.
The authors declare that there are no conflicts of interest.