


I. INTRODUCTION
Over the last 15 years, confocal microwave imaging (CMI) has emerged as a promising diagnostic method for breast cancer detection. CMI has the potential to provide a safe, non-ionizing, and comfortable method for breast cancer screening [Reference Fear, Bourqui, Curtis, Mew, Docktor and Romano1–Reference Preece, Craddock, Shere, Jones and Winton3]. An early-stage study looked at the variability in measurements with repeated scans of healthy volunteers over a 2–8 month period, confirming that the scan was comfortable and identifying some areas of variability between scans [Reference Porter, Coates and Popovic2]. Another study considered nine patients, with breasts both with and without disease, with many of the reconstructed images being consistent with the clinical history of the patient [Reference Fear, Bourqui, Curtis, Mew, Docktor and Romano1]. A larger, more recent study with 86 patients has shown a sensitivity of 74% comparing well with radiological results on the same sample. Considering only the dense breasts, sensitivity was 86%, which is better than the radiological results for the same subset of patients [Reference Preece, Craddock, Shere, Jones and Winton3]. These studies have also highlighted the requirement for good estimates of the patient-specific dielectric properties in order to create a sharp and focused image of the breast. Consequently, a number of these groups have begun to examine new methods to estimate the patient-specific average dielectric properties, as part of the breast imaging process [Reference Garrett and Fear4–Reference Winters, Bond, Van Veen and Hagness9]. In this paper, a new method to estimate the average dielectric properties is presented and evaluated.
The physical basis for CMI is the dielectric contrast between healthy and cancerous breast tissue [Reference Lavoie, Okoniewski and Fear6] and the ability to identify the source of reflected microwave energy from within the breast. The source of the reflected energy is a significant dielectric scatterer, and its precise location can be established using an estimate of the average dielectric properties of the breast. The average dielectric properties of the breast are used by the CMI beamformer to calculate the speed of propagation within the breast, and ultimately reconstruct an image of the breast [Reference Hagness, Taove and Bridges10]. An incorrect estimate of the average dielectric properties reduces coherent addition at dielectric scatterer locations, which in turn reduces the magnitude of the image at these locations and increases the clutter in the image. This can make tumor detection more difficult or in some cases impossible.
In light of the importance of the average dielectric properties as an imaging parameter, several methods to estimate the patient-specific average dielectric properties have been developed. These include methods to estimate the average dielectric properties from time-of-flight signals in the original patient scan [Reference Sarafianou8, Reference Winters, Bond, Van Veen and Hagness9] as well as average dielectric properties estimation from a separate scan with additional hardware [Reference Garrett and Fear4, Reference Garrett and Fear5, Reference Bourqui and Fear11, Reference Bourqui and Fear12]. A simplified inverse scattering problem was used in [Reference Winters, Bond, Van Veen and Hagness9] to estimate the average dielectric properties from the original backscattered signals. Time-of-flight measurements were used to estimate interior properties in numerical studies [Reference Sarafianou8], while promising multipath propagation measurements were used in some experimental studies [Reference Garrett and Fear4, Reference Garrett and Fear5, Reference Bourqui and Fear11, Reference Bourqui and Fear12].
In summary, these methods are reliant on transmitted signals through the breast.
Although most prototype microwave breast imaging prototypes do collect multistatic signals, these methods are still susceptible to interference from multipath propagation, which can distort the properties estimate. Furthermore, the effective average dielectric properties of any given propagation path are not necessarily the same as the effective average dielectric properties of the imaging volume.
An ideal method is independent of acquisition hardware (monostatic or multistatic) and can estimate the effective dielectric properties of the imaging volume. Parameter search methods measure properties of the image to determine the effective dielectric properties. By measuring features of the reconstructed images and not the backscattered signals, parameter search methods are independent of the acquisition hardware and imaging algorithm.
Recently, parameter searches have been applied to beamforming, both for stroke and breast cancer detection [Reference Lavoie, Okoniewski and Fear6, Reference Lavoie, Okoniewski and Fear7, Reference Guo and Abbosh13, Reference Mohammed, Bialkowski and Abbosh14]. The metrics developed for stroke detection, [Reference Guo and Abbosh13, Reference Mohammed, Bialkowski and Abbosh14], require estimating the effective dielectric properties for multiple entry points to the imaging domain. This method is difficult for breast cancer detection due to the number of antenna positions required, so many more variables would be needed. A custom metric was developed in [Reference Lavoie, Okoniewski and Fear6, Reference Lavoie, Okoniewski and Fear7] to reward images containing one bright response with fewer other large responses in the image (a high signal-to-clutter ratio). It also weights responses by their distance from the skin, taking into account that artifacts from skin removal are likely to occur there. When applied to simulated, experimental and clinical data in [Reference Lavoie, Okoniewski and Fear6], this has shown promising preliminary results.
This paper proposes focal quality metrics (FQMs) as suitable fitness functions in a parameter search. FQMs are algorithms that estimate the degree of focus of a whole image, or locally in the neighborhood of a given pixel of the image. Many families of FQMs have been developed and both theoretically and experimentally verified for over forty years [Reference Brenner, Dew, Horton, King, Neurath and Selles15, Reference Pertuz, Puig and Garcia16]. The wide variety of algorithms that have been developed provides opportunities to use multiple FQMs measuring different aspects of the image together to increase the robustness of the parameter search. Previous work has indicated that the properties of a good CMI image are similar to those of a clear and focused image [Reference O'Loughlin, Glavin, Jones and O'Halloran17, Reference O'Loughlin, Krewer, Glavin, Jones and O'Halloran18]. This paper investigates this correlation in more detail and proposes FQMs as a suitable fitness function for a parameter search to estimate the effective average dielectric properties of the breast.
The FQMs presented in this paper (summarized in Section II) are analyzed to see if image quality is correlated with a well-focused image. If good correlation is established, then there is potential to use the FQM as a method to fine-tune the average dielectric properties estimate, and consequently to optimize a microwave breast image.
The remainder of the paper is structured as follows: Section III describes how the chosen FQMs are evaluated in terms of fitness and the images on which they are analyzed; Section IV describes the results and Section V concludes the paper.
II. FOCAL QUALITY METRICS
This paper analyses FQMs to investigate they correlate with the qualities of a good image. In an optical system, a defocused image is blurred in comparison to a focused image, which is commonly modeled as convolution with a point-spread function [Reference Groen, Young and Ligthart19–Reference Subbarao, Choi and Nikzad21]. Similarly, an incorrect estimate of the effective average dielectric properties means that the backscattered signals are out of phase after synthetic focusing. This means that rather than coherent addition at the locations of dielectric scatterers, this energy is instead spread around the site of the dielectric scatterer, an effect similar to convolution with a point spread function. This indicates that FQMs may be suitable for assessing image quality without a priori knowledge of the imaging domain.
A well-focused image contains a large number of sharp edges and thus a lot of high-frequency spatial content. A defocused image or blurred image, on the other hand, contains less high-frequency spatial content. Therefore, the majority of FQMs estimate the frequency content of images and can be broadly classified based on their method of action for frequency content estimation. In this paper, five FQMs were described and compared. One metric from each of the families of algorithms identified in a recent review of FQMs were chosen in this paper [Reference Pertuz, Puig and Garcia16].
FQMs are often used for auto-focus, which is where the FQMs are used in a parameter search to find the optimal focal length, such as in microscopy [Reference Brenner, Dew, Horton, King, Neurath and Selles15, Reference Jarvis22, Reference Linge, Zimmer and Neuhoff23] and telescopy [Reference Buffington, Crawford, Pollaine, Orth and Muller24, Reference Muller and Buffington25] where the properties of the optimal image are well defined and the type of image does not vary. Additionally, FQMs have been used in more challenging situations such as digital still cameras [Reference Subbarao, Choi and Nikzad21, Reference Chern, Neow and Ang26, Reference Lee, Kim, Nam, Lee, Kwon and Kim27]; and digital video [Reference Baïna and Dublet28] where the types of images vary from case to case (landscape, interior, portraits) and there are strict performance criteria in video in particular.
As well as auto-focus, FQMs have been used in:
-
• shape from focus (also known as depth from focus or range from focus), which is where depth information about a scene is inferred from the focal quality of various regions of the image [Reference Helmli and Scherer29–Reference Nayar and Nakagawa31];
-
• multi-focus, an application where multiple images of a scene taken at different focal lengths are fused to form one image with all objects in focus [Reference Huang and Jing32].
This paper analyzes FQMs for the novel application of effective average dielectric property estimation for CMI.
A) Gradient-based FQM (Φ G )
High-pass filtering is analogous to differentiation. Thus, the spatial derivative of the image can be used as a FQM, as this rewards the higher frequency content in the image and is correlated with quality. Approximations to the first derivative or gradient of the image have been widely used as FQMs [Reference Brenner, Dew, Horton, King, Neurath and Selles15, Reference Pertuz, Puig and Garcia16, Reference Subbarao, Choi and Nikzad21, Reference Huang and Jing32–Reference Sun, Duthaler and Nelson35]. The first-order difference is a computationally efficient method to estimate the spatial derivative and is used in this work. In this case, a FQM based on the maximum value of the absolute value of the gradient for each dimension of the image is considered.
 $$\Phi _G = \displaystyle{1 \over {XY}}\sum\limits_x^X \sum\limits_y^Y \mathop {\max} \limits_{D \in \{ X,Y\}} \left \vert {I_D (x,y)} \right \vert, $$
where X and Y are the dimensions of the image and I X and I Y are the first-order differences along the X and Y dimensions, respectively.
B) Laplacian-based FQMs (Φ L )
Although Φ G uses first-order differentiation to estimate image quality, second order differentiation has also been applied in the Laplacian-based methods. The energy of the Laplacian is a commonly used FQM [Reference Pertuz, Puig and Garcia16, Reference Schlag, Sanderson, Neuman and Wimberly20, Reference Muller and Buffington25, Reference Erteza36] and can be approximated as:
 $$\Phi _L = \displaystyle{1 \over {XY}}\sum\limits_x^X \sum\limits_y^Y (L^*I)$$
using the discrete approximation of the Laplacian, L, defined as:
 $$L = \displaystyle{1 \over 6}\left( {\matrix{ 1 & \,4 & 1 \cr 4 & { - 20} & 4 \cr 1 & \,4 & 1 \cr}} \right).$$
C) Wavelet-based FQM (Φ W )
The discrete wavelet transform (DWT) measures the frequency content of an image and hence the image quality. The high-frequency sub-bands of the DWT have been used as FQMs [Reference Pertuz, Puig and Garcia16, Reference Huang, Shen, Phoong and Chen37–Reference Yang and Nelson39]. Using a first-level DWT and a db6 filter (Daubechies filter with six vanishing moments), the absolute sum of the resulting three detail sub-bands is used in this work:
 $$\Phi _W = \displaystyle{1 \over {XY}}\sum\limits_x^X \sum\limits_y^Y \left \vert {I_{LH} (x,y)} \right \vert + \left \vert {I_{HL} (x,y)} \right \vert + \! \big\vert {I_{HH} (x,y)} \big \vert, $$
where the first-level detail sub-bands are given as I LH , I HL , and I HH .
D) Fourier-based FQM (Φ D )
The discrete cosine transform is a Fourier-based transform that directly measures the frequency content of an image to infer the image quality, which has been used in FQMs [Reference Pertuz, Puig and Garcia16, Reference Baïna and Dublet28, Reference Lee, Yoo, Kumar and Kim40, Reference Shen and Chen41]. In particular, comparing the ratio of the AC and DC energy has been used:
 $$\Phi _D = \displaystyle{1 \over {XY}}\sum\limits_x^X \sum\limits_y^Y \displaystyle{{\sum\nolimits_{(n,m) \ne (0,0)}^{} {F_{x,y} (n,m)^2}} \over {F_{x,y} (0,0)^2}}, $$
where F x, y is the DCT of the N × M sub-block centered at (x, y). M = N = 8 is used in this work.
E) Statistics-based FQM (Φ S )
FQMs have also been constructed by analyzing the grey-level luminance of the image. The variance of the gray-level luminance is a commonly used statistic and is analyzed in this paper [Reference Pertuz, Puig and Garcia16, Reference Subbarao, Choi and Nikzad21, Reference Chern, Neow and Ang26, Reference Huang and Jing32–Reference Sun, Duthaler and Nelson35]:
 $$\Phi _S = \displaystyle{1 \over {XY}}\sum\limits_x^X \sum\limits_y^Y (I(x,y) - \bar I)^2, $$
where $\bar I$
is the mean of the image.
$\bar I$
is the mean of the image.
III. EVALUATION OF FQMS
Traditionally, CMI systems are evaluated using signal-to-mean and signal-to-clutter metrics [Reference Byrne, O'Halloran, Glavin and Jones42]. These metrics compare the energy of the tumor to the background energy in the image, however, do not provide much information about how the quality changes as the effective average dielectric properties used in image reconstruction change. Section IIIA considers the metrics that are traditionally used to evaluate FQMs, and how these can be used in the context of CMI to evaluate the suitability of the FQMs for estimating the average dielectric properties.
A) Characteristics of an effective FQM
Commonly identified characteristics currently used to evaluate FQMs in other applications are:
-
• Accuracy: that the extremum of the curve lies at the correct value [Reference Groen, Young and Ligthart19, Reference Firestone, Cook, Culp, Talsania and Preston33, Reference Sun, Duthaler and Nelson35];
-
• Reproducibility: that the extremum lies at the top of a narrow peak [Reference Groen, Young and Ligthart19, Reference Huang and Jing32, Reference Firestone, Cook, Culp, Talsania and Preston33, Reference Sun, Duthaler and Nelson35];
-
• Broad range: that the extremum lies at the top of a peak with broad tails in either direction [Reference Groen, Young and Ligthart19];
-
• Generalizability: that the FQM is appropriate for many different types of images, objects and textures and can be used with different imaging settings [Reference Groen, Young and Ligthart19, Reference Huang and Jing32];
-
• Monotonicity with respect to blur [Reference Huang and Jing32].
These characteristics have been evaluated in different ways in different contexts. Some commonly evaluated qualities of the FQM curve are: range of peak [Reference Firestone, Cook, Culp, Talsania and Preston33–Reference Sun, Duthaler and Nelson35, Reference Lee, Yoo, Kumar and Kim40]; width of peak [Reference Firestone, Cook, Culp, Talsania and Preston33–Reference Sun, Duthaler and Nelson35, Reference Lee, Yoo, Kumar and Kim40]; number of false extrema [Reference Firestone, Cook, Culp, Talsania and Preston33–Reference Sun, Duthaler and Nelson35, Reference Lee, Yoo, Kumar and Kim40]; accuracy of peak [Reference Firestone, Cook, Culp, Talsania and Preston33–Reference Sun, Duthaler and Nelson35]; and noise level [Reference Sun, Duthaler and Nelson35].
Not all evaluation criteria are directly applicable to CMI as it is assumed by these metrics that the FQM should decay monotonically in either direction from a single global extremum. Instead, the FQM curve is compared to the similarity of the images to the best-case image. The best-case image is formed at the true average value of dielectric properties measured at the center frequency of the excitation pulse.
The similarity of the images is calculated using Structural Similarity (SSIM) index [Reference Wang, Bovik, Sheikh and Simoncelli43]. The two curves (the FQM curve and the similarity curve) are then compared using the Spearman Rank Correlation coefficient, ρ, which measures how well the correlation between two variables can be approximated by a monotonic function. This addresses the characteristics of reproducibility, range and monotonicity.
The accuracy is evaluated by comparing the average dielectric properties predicted by the FQM to the best-case average dielectric properties measured at the center frequency of the excitation pulse.
The generalizability of each FQM is estimated by testing in a variety of scenarios: in numerical models and experimental phantoms, with tumors of different shapes and sizes in different locations.
The FQMs are then ranked according to each evaluation criterion (correlation and accuracy), first within each FQM family and then globally. A global rank for each FQM is then computed by adding the ranks of the individual criteria [Reference Firestone, Cook, Culp, Talsania and Preston33].
B) Experimental evaluation
The finite-difference time-domain simulations of the breast used for the evaluation of the FQMs are described in this section. Homogeneous and heterogeneous breast models were used to evaluate the FQMs.
The homogeneous breast interior has dielectric properties of ε r = 3.74 which is the same as the matching medium in which the breast is immersed which is in the range of adipose tissues identified in [Reference Lazebnik44, Reference Lazebnik45]. A realistically-shaped skin layer with dielectric properties ε r = 35.14 was used while tumors have dielectric properties of ε r = 60.33. Spherical tumors with various radii ranging from 3 mm to 5 mm were randomly placed within the breast, resulting in twenty different models. One sample model is illustrated in Fig. 1(a).
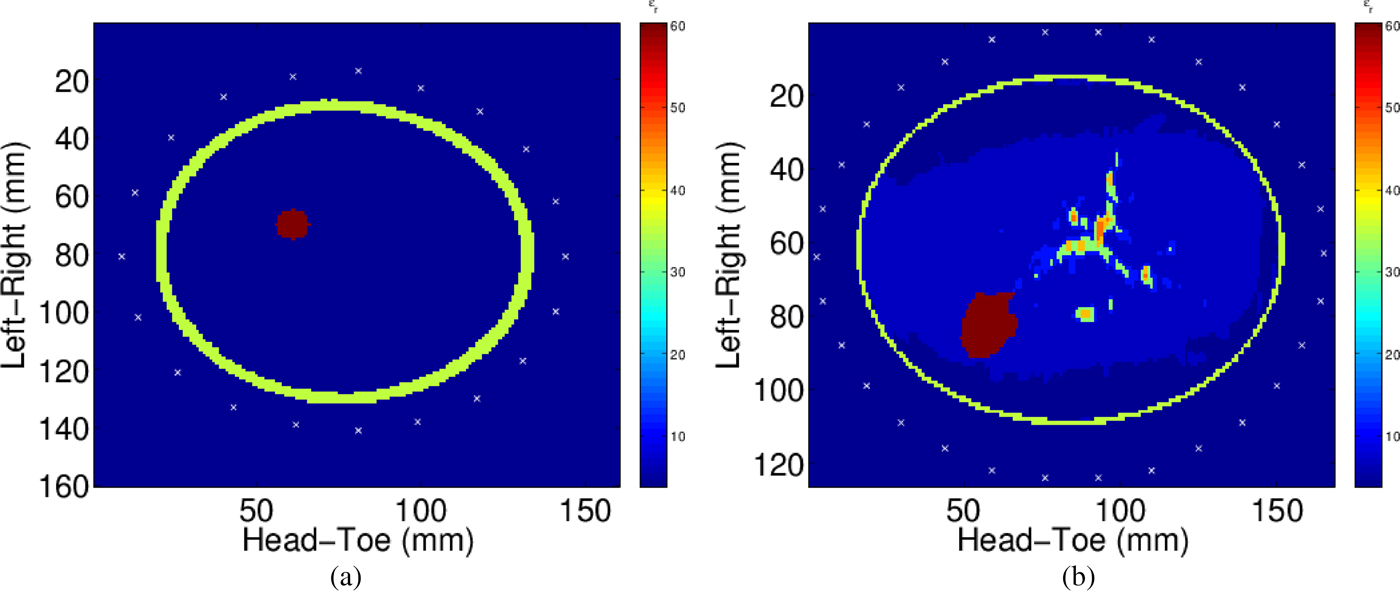
Fig. 1. Cross-sections of a homogeneous (a) and a heterogeneous (b) breast model used in this study. Antenna positions are indicated in white.
The heterogeneous breast interior was taken from the MRI-derived three-dimensional breast models from the University of Wisconsin–Madison (ID: 071904) [Reference Zastrow, Davis, Lazebnik, Kelcz, Veen and Hagness46]. Eight different heterogeneous models were simulated, consisting of a realistic tumor generated as described in [Reference Oliveira, O'Halloran, Conceicao, Glavin and Jones47] with an approximate radius of 12 mm. The tumors were positioned in one of eight positions within the breast, where positions were chosen in accordance with locations with high tumor incidence [Reference Oliveira, O'Halloran, Conceicao, Glavin and Jones47]. Dielectric properties for fibroglandular tissues were also chosen in accordance with [Reference Lazebnik44, Reference Lazebnik45], ranging from 32.7 to 46.8. A sample tumor position and heterogeneous model is shown in Fig. 1(b). All relative permittivity values are reported for the center frequency of the excitation pulse.
A single-cycle sine wave modulated by a Gaussian pulse with a center frequency of 6 GHz and bandwidth of 6 GHz was used to excite the breast model. A cylindrical array of equally-spaced antennas was simulated, which illuminated the breast model sequentially, as shown in Fig. 1. The tumor response was isolated by using ideal skin subtraction, which allows for the image quality to be assessed without artifacts from skin subtraction algorithms.
Images were generated using a monostatic Delay-and-Sum beamformer [Reference Hagness, Taove and Bridges10]:
 $$I({\bf r}) = \sum\limits_0^T \left( {\sum\limits_c^{N_c} S_c \left( {t - \tau _c ({\bf r})} \right)} \right)^2 $$
where S c is the response of each multistatic channel in the time-domain sampled at 80 GHz, N c = 190 is the number of multistatic channels for twenty antennas. T, the window-length, is 330 ps, the length of the excitation pulse in the time-domain.
The propagation delay for each channel, $\tau _c ({\bf r})$
, is estimated based on the average dielectric properties, specifically the average relative permittivity:
$\tau _c ({\bf r})$
, is estimated based on the average dielectric properties, specifically the average relative permittivity:
 $$\tau _c ({\bf r}) = \displaystyle{d \over c} = \displaystyle{d \over {c_0}} \sqrt {\varepsilon _r}. $$
Two hundred and one images, ranging from ε
r
= 3 to ε
r
= 23 were reconstructed ( ${{\rm \cal I}}$
) and the best-case image was selected using the metrics described in Section II.
${{\rm \cal I}}$
) and the best-case image was selected using the metrics described in Section II.
The proposed algorithms are independent of the type of beamformer used as the algorithm analyses properties of the generated images and not of the signals.
IV RESULTS
This section details the results of evaluating the FQMs listed in Section II by the method explained in Section III.
The results are presented in three parts:
-
(1) Firstly, the effect of an incorrect estimate of the average dielectric properties is demonstrated by examining the images generated at varying values of assumed average dielectric properties, as shown in Fig. 2. Figure 2(a) to 2(h) shows the coronal cross-section of the breast image at the tumor location, generated using average dielectric properties of ε r = 3, 4, 5, 5.2, 6, 7, 8, 9 respectively;
-
(2) Secondly, the FQMs are evaluated quantitatively by measuring the accuracy of the estimated average dielectric properties and calculating the correlation of the FQM curve to the ideal in Section IVA;
-
(3) Thirdly, the FQMs are evaluated qualitatively by comparing the shapes of the ideal and FQM curves in Section IVB.
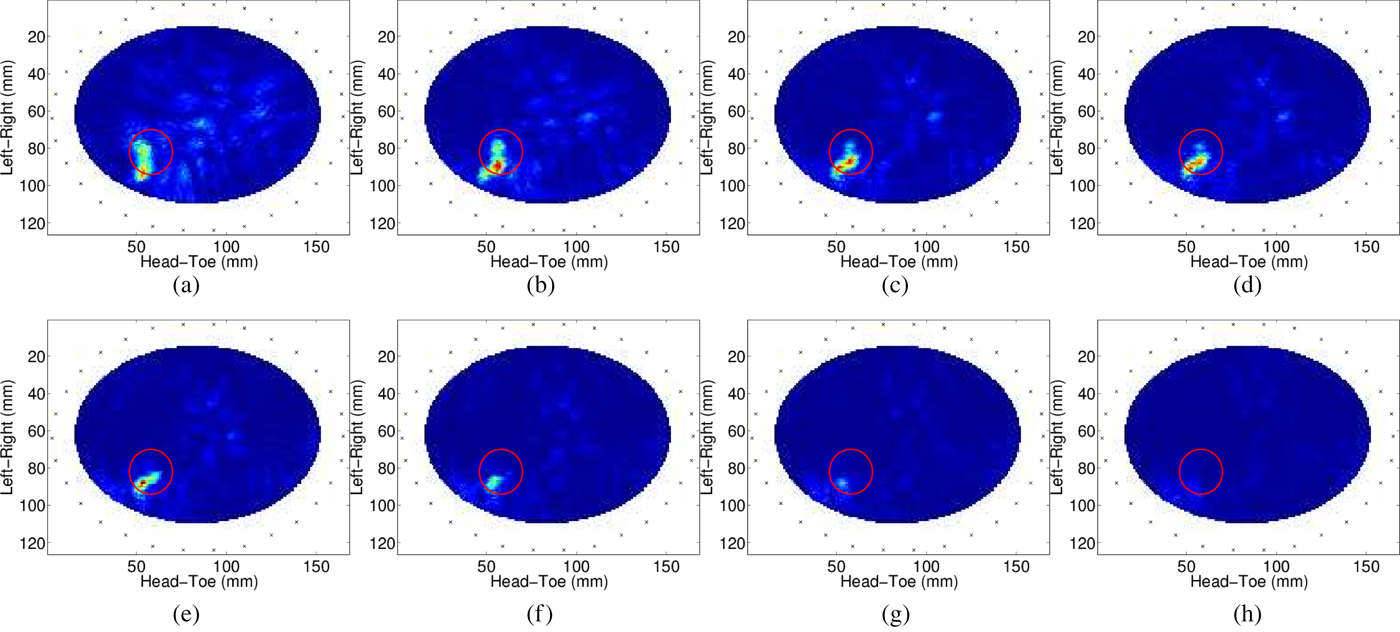
Fig. 2. Panels (a)–(h) show images reconstructed with permittivities, ε r ∈ {3, 4, 5, 5.2, 6, 7, 8, 9} respectively from the heterogeneous model in Fig. 1(b). Panels (c)–(e) show the best localization and least clutter as it closest to the best average relative permittivity, while other images are successively poorer.
A) Quantitative evaluation
Using the homogeneous models described in Section III, the accuracy and monotonicity of each of the five FQMs described in Section II are listed in Table 1. The average, μ, and the standard deviation, σ for each criterion is shown. For all models, the best-case average dielectric properties is ε r = 5.2. Φ L , Φ S , Φ G and Φ W all accurately predict the best-case average relative permittivity to within Δε r = 0.2. Φ W is the most accurate in these test cases on average. Φ G has the highest value of ρ, with the smallest standard deviation. Φ D does not estimate the average dielectric properties well in these cases and is poorly correlated with the ideal curves. Φ D estimates average dielectric properties of ε r = 3 for nearly every test-case, which is the lowest value in the analyzed range.
Table 1. Accuracy and correlation to the similarity curve results using homogeneous models.

Best-case average relative permittivity, ε r = 5.2.
Similarly, the heterogeneous results are described in Table 2. Four metrics perform similarly in the more realistic scenarios, Φ G , Φ S , Φ W , and Φ L have similar values for accuracy. These four metrics estimate a value of ε r ≈ 5.7 which is 10% higher than the true value of ε r = 5.2. However, as shown in Figs 2(c) and 2(e), reconstructed images within the range ε r = [5, 6] do correctly identify the tumor location. For all metrics, the correlations with the ideal curve are worse than in the homogeneous case. This is due to the increased number of scatterers in the models. Reconstruction at certain values of average dielectric properties can cause coherent addition at other points within the breast due to reflections from fibroglandular tissues. These images can then be rewarded resulting in the poorer correlation with expected curve.
Table 2. Accuracy and correlation to the similarity curve results using heterogeneous models.

Best-case average relative permittivity, ε r = 5.2.
Images reconstructed with underestimated average dielectric properties have a lot of clutter. Fourier-based metrics (Φ D ) directly measure the spatial frequency content of the image and can reward this structured clutter, resulting in the consistent underestimation of the average dielectric properties seen in both homogeneous and heterogeneous models as shown in Fig. 4.
B) FQM curves
The FQM curves for all five FQMs described in this paper over the given average dielectric properties range are shown in Fig. 3. Additionally, the ideal curve as described in Section IVA is also shown. By comparing the curves visually, Φ L , Φ S , Φ G , and Φ W all identify ε r = 6.3 as the average in this case. Although this is greater than the mean properties as can be seen in Fig. 2, an image reconstructed with this estimate does show the tumor in the correct location.
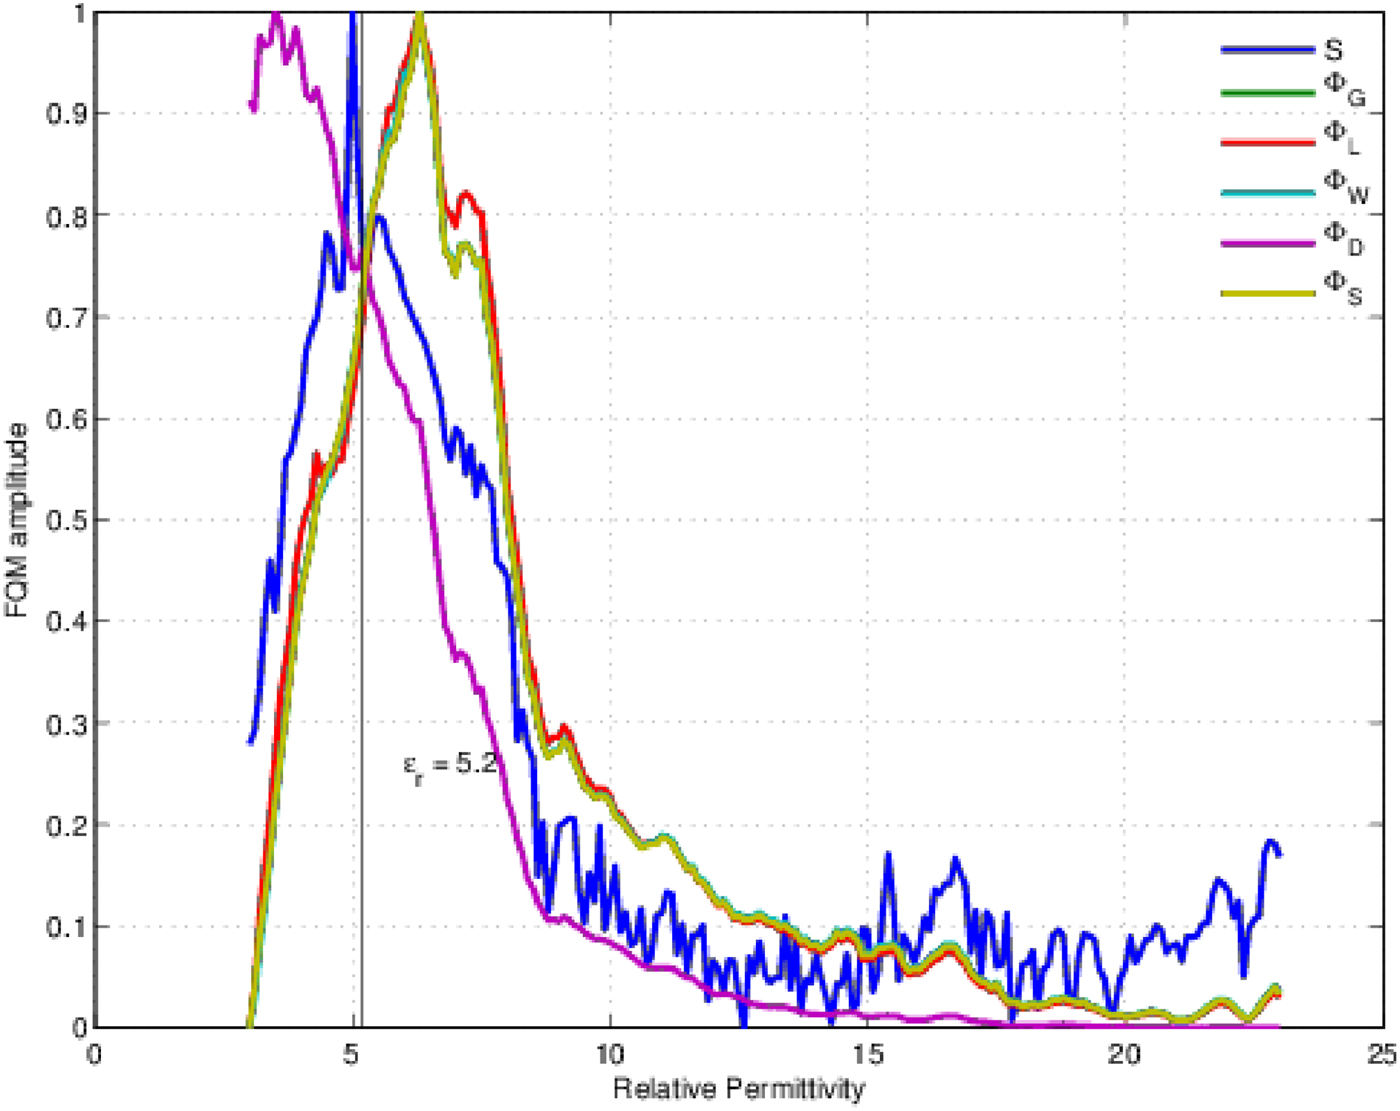
Fig. 3. This figure compares the FQM curves. For the given model (cross-section as shown in Fig. 1(b)), the normalized value of each FQM is shown. For comparison, the similarity curve is also shown (denoted S). This is calculated by comparing each image to the best-case image using SSIM. The best-case image is chosen by using the exact average relative permittivity of the imaging volume. All but Φ D follow the same trend as the similarity curve. In this scenario, the curves overestimate as e r = 6.3, higher than the average dielectric properties.
Matching the quantitative analysis, Φ D does not identify the average dielectric properties and neither is the shape of the curve correct as the value of Φ D is too large at the lower end of the average dielectric properties range. Figure 4 shows the values of Φ D for the images in Fig. 2. The images in Figs 2(a)–2(d) are of similar maximum magnitude; however, the images further away from the correct average dielectric properties (Figs 2(a) and 2(b)) have more clutter in the image. This clutter is rewarded by Φ D as seen in Figs 4(a) and 4(b). This makes it difficult to distinguish images near the best-case (Fig. 4(d)) from images with similar maximum magnitude but lower signal-to-mean ratio (Fig. 4(a)).

Fig. 4. Panels (a)–(h) show the metric Φ D for the images in Fig. 2. Images in (f)–(h) are of very low magnitude, due to the small magnitude of the original images; however, images in (c)–(e) are of lower mean magnitude than (a) and (b); making it difficult to distinguish the best-case images from other images using this metric.
V. CONCLUSIONS
Although preliminary, these data indicate that properties of clear and focused images are similar to the properties of a good CMI image. This correlation indicates that FQMs could potentially be used in a parameter search algorithm to estimate the average dielectric properties of the breast in CMI. A correct estimate of the average dielectric properties is important in realistic screening scenarios when this value changes from patient-to-patient and is difficult to estimate in advance. These FQMs could be used to help select the appropriate average dielectric properties and reconstruct a clear and focused image for the clinician.
Further work in this area will focus on considering the optimal FQM or optimal combinations of FQM for CMI applications in experimental and clinical scenarios.
ACKNOWLEDGEMENTS
This work was supported by the Irish Research Council (Grant no. RCS1326), Science Foundation Ireland (Grant no. 12/IP/1523 and 1 l/SIRG/I2120), and the MiMED COST Action (TD1301).
 Declan O'Loughlin received his B.E. degree in Electronic and Computer Engineering from the National University of Ireland Galway in 2014. He is currently a Hardiman Scholar and also awarded the Government of Ireland Postgraduate Research Scholarship to study for a Ph.D. His research interests include biomedical signal processing and medical device development.
 Dr. Finn Krewer received his Ph.D. in Electrical and Electronic Engineering at the National University of Ireland Galway in 2017 for work in the field of reprogrammable digital hardware and ultrawideband radar imaging. His research deals with the implementation of neural network classifiers and algorithms in digital hardware and the simulation of radar propagation in biological tissues.
 Martin Glavin received the B.E.(Hons.) degree in electronic engineering and the Ph.D. degree in advanced equalization techniques for high-speed digital communications from National University of Ireland, Galway, Ireland, in 1997, and 2004, respectively. Since 1999, he has been a Lecturer with the Department of Electrical and Electronic Engineering, NUI Galway. His research interests include image processing and embedded systems in the areas of automotive systems and biomedical signal processing.
 Edward Jones received the B.E. and Ph.D. degrees in Electronic Engineering from National University of Ireland, Galway, Ireland. He was previously with Toucan Technology Ltd., Galway, Ireland, and PMC-Sierra, Inc., developing digital signal processing (DSP) algorithms for digital-subscriber-line modems. From 2001 to 2002, he was a Senior DSP Architect with Innovada Ltd., developing software for embedded voice-band modem technology. From 2002 to 2003, he was with Duolog Technologies Ltd., where he developed DSP algorithms for wireless networking systems. He is currently a faculty member in Electrical and Electronic Engineering at NUI Galway. His research interests include development of DSP algorithm and machine learning systems for applications in biomedical engineering, image processing, and speech processing.
 Dr. Martin O'Halloran is a Euoprean Research Council (ERC) and Science Foundation Ireland (SFI) Investigator at the National University of Ireland Galway. Reflecting the interdisciplinary nature of his research, he holds a joint affiliation with the College of Engineering and Informatics; and the College of Medicine, Nursing & Health Sciences, and leads the Translational Medical Device Laboratory at NUI Galway. He is also an Associate Director of BioInnovate, an affiliate of the Stanford's BioDesign Programme. His research interests are focused on needs-led medical device development.


