Introduction
Nanodiamonds are found in primitive meteorites by dissolving the host material in acid and conducting size separations on the residue [Reference Lewis1]. The nanodiamonds account for only about half of the carbon in the residue [Reference Bernatowicz2], and the remainder is a disordered carbon phase with primarily sp2 bonding, probably glassy carbon [Reference Stroud3]. These nanodiamond acid residues also contain an anomalous mixture of xenon isotopes, Xe-HL, enriched in heavy and light isotopes, believed to be produced only in Type II (core collapse) supernova explosions [Reference Lewis1]. These data suggest that at least some of the acid residue material is composed of presolar grains—particles that condensed around supernovae and late-type stars and survived the formation of the sun and solar system to be incorporated into primitive solar system material such as chondrites, which are stony meteorites that have not experienced significant alteration by melting or icing and contain chondrules, that is, round grains of different minerals [Reference Zinner4]. However, the ratios of stable carbon and nitrogen isotopes in bulk nanodiamond acid residues are consistent with terrestrial values [Reference Russell5], a puzzling observation since the Xe appears to be of supernova origin. The ratio of stable isotopes is the best indicator of whether material is presolar, as any material formed from solar gas will have a 12C/13C ratio within a small range of values near 90/1, whereas presolar materials, including material from different supernovae, have 12C/13C ratios with ranging orders of magnitude from 1/1 to 1000/1, depending on the source. Transmission electron microscopy studies of the nanodiamonds show that they are on average less than 3 nm across, each containing around 2000 atoms [Reference Daulton6]. Detailed studies of various types of presolar grains, which correlate with the observation and modeling of late-type stars, supernovae, and the interstellar medium, have yielded new information about these environments. However, meteoritic nanodiamonds and fragments of disordered carbon are so small that understanding their formation and alteration histories is limited by technical capabilities. Prior studies of the nanodiamond acid residues have measured millions or billions of nanodiamonds at a time.
It is possible that a subset of the acid residue is presolar, and the rest formed in the solar system with the terrestrial carbon and nitrogen from the solar material diluting anomalous signals from the presolar fraction to such a degree that it goes undetected in bulk measurements of millions of nanodiamonds. In this article we use atom probe tomography (APT) to measure the 12C/13C ratio of smaller fractions of acid residue than previously characterized [Reference Heck7–Reference Lewis9]. We cannot study Xe with this approach because its concentration is too low for us to expect detection of even a single meteoritic Xe atom in samples of our size. An important advance in this research would be the discovery of a method to distinguish carbon isotopes of diamond from those of amorphous carbon in order to determine if diamonds, disordered carbon, or both contain a presolar fraction. The development of such a method is the topic of this article.
Materials and Methods
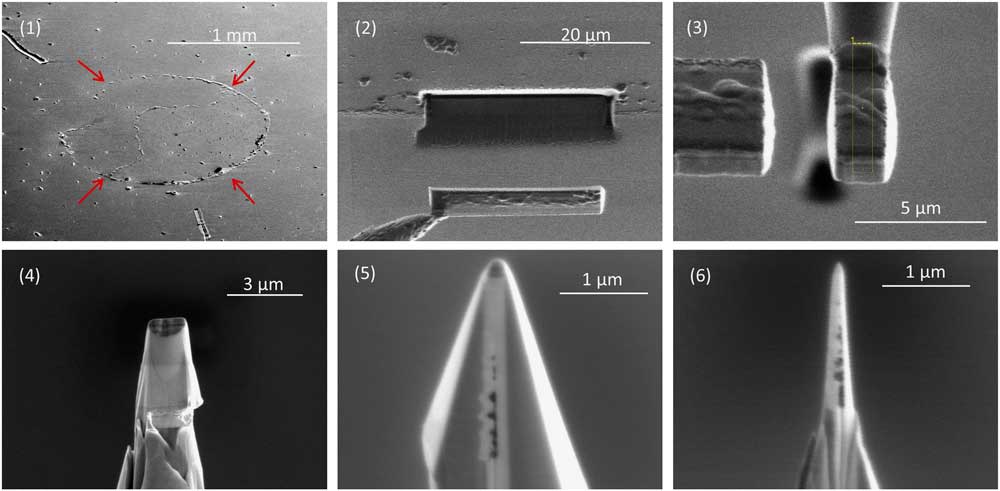
To prepare nanotips for APT we embedded a layer of acid residue between two layers of ion-beam sputter-deposited platinum and used focused ion beam (FIB) milling to create small radius (<100 nm) nanotips of the multilayer, with the plane of the acid residue running along the long axis through the nanotip (Figure 1). The nanotip shape is required so that high voltage in the atom probe will generate a high enough electric field to evaporate ions from the apex of the nanotip.

Figure 1 Sample preparation for APT. (1) A multilayer containing a circular deposit of acid residue (arrows), which presses up the covering Pt layer. The residue contains nanodiamonds and disordered carbon separated from the carbonaceous chondrite Allende by acid dissolution and size and density separations. A small droplet of water with suspended acid residue is placed on a Pt-coated substrate to make the deposit, which is then covered in a second layer of sputter-deposited Pt. (2) A FIB liftout of a 25 μm long, 5 μm wide undercut region of the multilayer. (3) A slice of the rotated multilayer attached to a 2 μm diameter micropost using Pt deposition. (4) Annular milling by FIB produces a conical shape. (5) Additional FIB milling from four different angles produces a pyramid shape while preserving the Pt patch between the slice of multilayer and the micropost. (6) Final annular milling produces a nanotip with an apex of well under 100 nm in radius.
We used a LEAP 4000x straight-flight-path atom probe to collect time-of-flight spectra from the samples. Including data sets reported earlier [Reference Heck7, Reference Lewis9], we analyzed a total of 36 data sets from samples of acid residue from the Allende chondrite meteorite and 26 standard data sets from detonation nanodiamonds [Reference Greiner10]. We detected in the acid residue clusters high in carbon—namely C1, C2, C3, and PtOC—as well as O and N, in charge states 1+ and 2+, and used the recorded concentrations of carbon in various molecules to distinguish between diamond-dominated and disordered-carbon-dominated regions of acid residue.
We hypothesized that a higher fraction of the disordered carbon would field evaporate as PtOC molecules rather than pure C molecules, compared to the nanodiamonds because the disordered carbon is more porous than nanodiamond with more exposed surface area where the Pt could bond. Thus, we investigated variations in the concentration of carbon in PtOC versus carbon in C1, C2, and C3 (using the sum C1+2×C2+3×C3) as a potentially useful discriminator between the two carbonaceous fractions. The species Na and NaO, presumably from the acid dissolution process, are co-located with the carbon clusters, so we included the concentrations of these molecules in our study. We also investigated O and N concentrations. Scanning transmission electron microscopy with energy-dispersive X-ray spectrometry (STEM/EDXS) showed that in the acid residue O is located primarily in the disordered C, and the N is primarily in the diamond [Reference Stroud3]. Trace amounts of O and N were detected by APT, although some of this signal is from the Pt matrix in which the acid residue is embedded for APT analysis.
To calculate concentrations, we divided counts of the atoms and molecules of interest by the sum of the counts of all the ions detected in the acid residue regions of interest in the APT reconstructions, including C, Na, Cl, F, N, and O. We tested the resulting data to ascertain whether the concentrations of these atoms and molecules could be used to distinguish disordered carbon from diamond. Finally, we conducted two analyses to see if there was any correlation between these concentrations and the 12C/13C ratios of the samples.
Results
Isolated regions of carbonaceous material a few nm in size are typically dominated by C, whereas lower density, larger, and less-ordered regions of acid residue material are dominated by PtOC and laboratory contaminants, such as Na and NaO, along with acid dissolution products Cl and F. In many cases, high concentrations of C ions are surrounded by PtOC, Na, and NaO (Figure 2). Atom-probe reconstructions of the acid residues with higher N concentration tend to have higher concentrations of C1+C2+C3. However, these are not consistent or strong trends. The highest concentrations of C1+2×C2+3×C3 correspond to the highest N/O ratios (Figure 3). For C1+2×C2+3×C3 concentrations over 0.6, the minimum N/O ratio increases steadily from < 0.01 to 0.05. One out of seven nanotips, or ~14% of data sets with C1+2×C2+3×C3 concentration < 0.4, had a N/O ratio > 0.05, but ~31% (9/29) with C1+2×C2+3×C3 concentration > 0.4 had a N/O ratio > 0.05. There was also a loose trend of lower N/O for higher PtOC+Na+NaO concentration: ~13% (1/8) of data sets with PtOC+Na+NaO concentration > 0.45 had N/O > 0.05, whereas ~32% (9/28) with PtOC+Na+NaO concentration < 0.45 had N/O > 0.05.
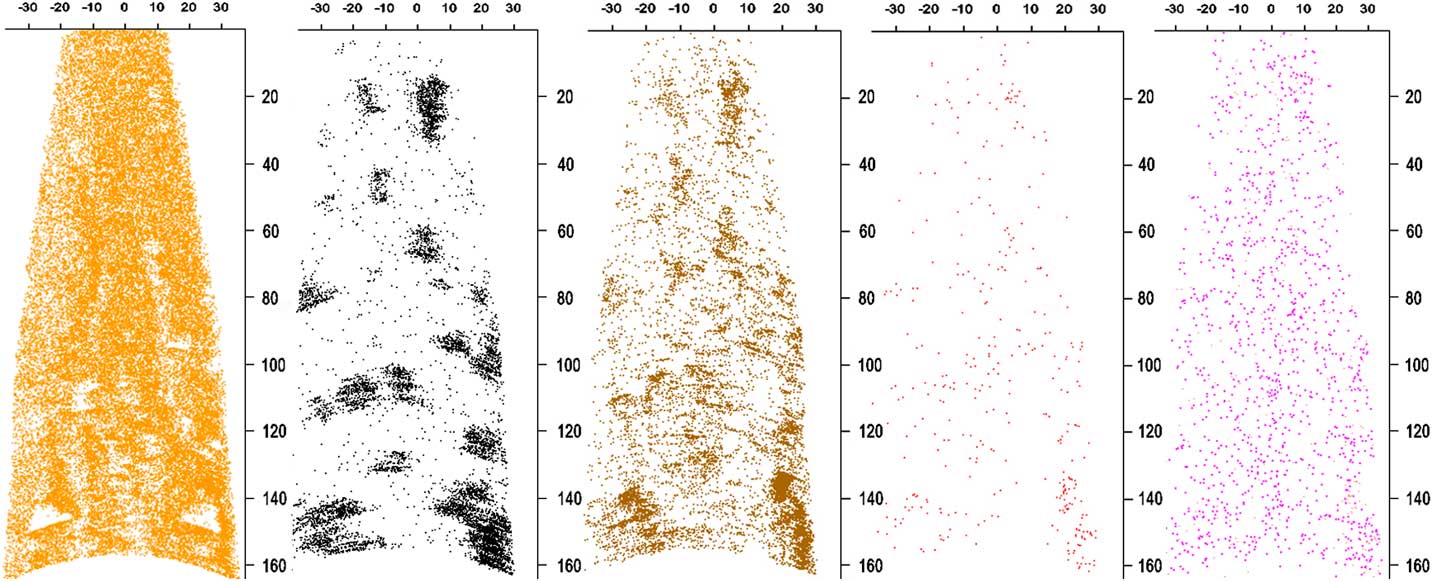
Figure 2 Longitudinal sections of reconstructed APT data set ADM R06 18430. The Pt reconstruction (orange ions) is 5 nm thick to reveal holes. Only a small percentage of the Pt ions are shown to improve visibility. The remaining maps are of a 20 nm thick section. C atoms are in black, PtOC in brown, Na/NaO in red, and N in pink. All the ions except Pt and N represent material from the meteoritic acid residue embedded in the sample. The PtOC and NaO concentration is higher on the edges of C clusters, suggesting that they are from disordered C surrounding or adjacent to nanodiamonds. Concentrations of these ions align with holes in the thin cross section of Pt. The concentration of N in the Pt is too high to distinguish it from N in the acid residue. Scale bars are in nm.
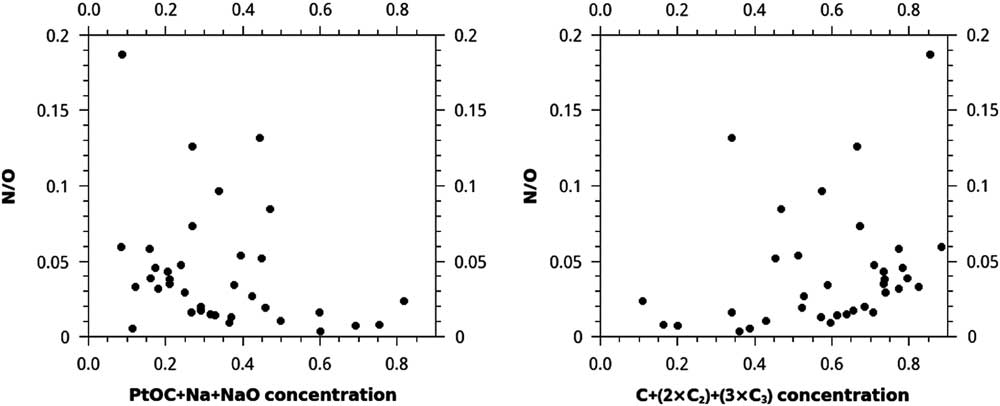
Figure 3 Plots of N/O vs. the concentrations of two different sets of ions in each of 36 APT reconstructed acid residue samples. Concentrations are normalized to the sum of the counts of all ions of interest, including C, Na, Cl, F, N, and O. The very loose trend of higher concentrations of C+(2×C2)+(3×C3) for higher N/O, and the opposite trend of lower concentrations of PtOC+Na+NaO for higher N/O, may be explained as a mixture of two phases in the meteoritic material, such as disordered C and nanodiamonds.
These data suggest that these two ratios record information about a mixture of two phases, such that data sets with extreme values in one of these ratios contain acid residue composed primarily either of disordered C, with O and PtOC+Na+NaO, or of diamond, with N and C1+2×C2+3×C3. Some of the correlation for PtOC+Na+NaO with N/O is due to the fact that O is present in PtOC and NaO, both of which are also included in the ion count used to calculate concentration, but, taken along with the lack of N and higher O for lower C1+2×C2+3×C3 concentration; these concentrations can be used as a qualitative proxy for the fraction of the acid residue that is nanodiamond versus disordered carbon. This trend is not easily discernable when N or O are plotted separately instead of N/O.
Instead of using concentration, we could divide the counts of PtOC by the counts of C1+2×C2+3×C3, and the counts of N by O. Since deviation from solar ratios of stable isotopes is the best indicator of whether material is presolar, these values were plotted versus the 12C/13C ratios of the microtips. The results of this analytical method are null; no trends are apparent (Figure 4).
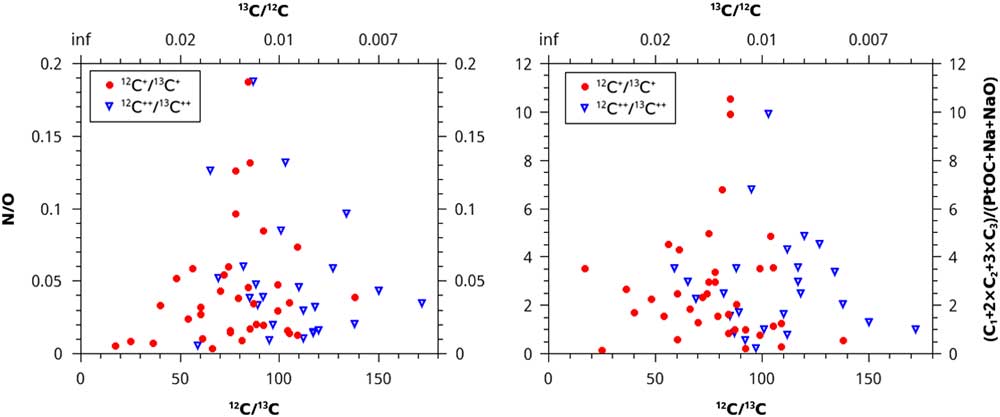
Figure 4 N/O ratio and (C1+2×C2+3×C3)/(PtOC+Na+NaO) ratios plotted vs. the normalized 12C/13C isotopic ratios. No trends are present, giving no evidence that more than one isotopic reservoir contributed material to the samples.
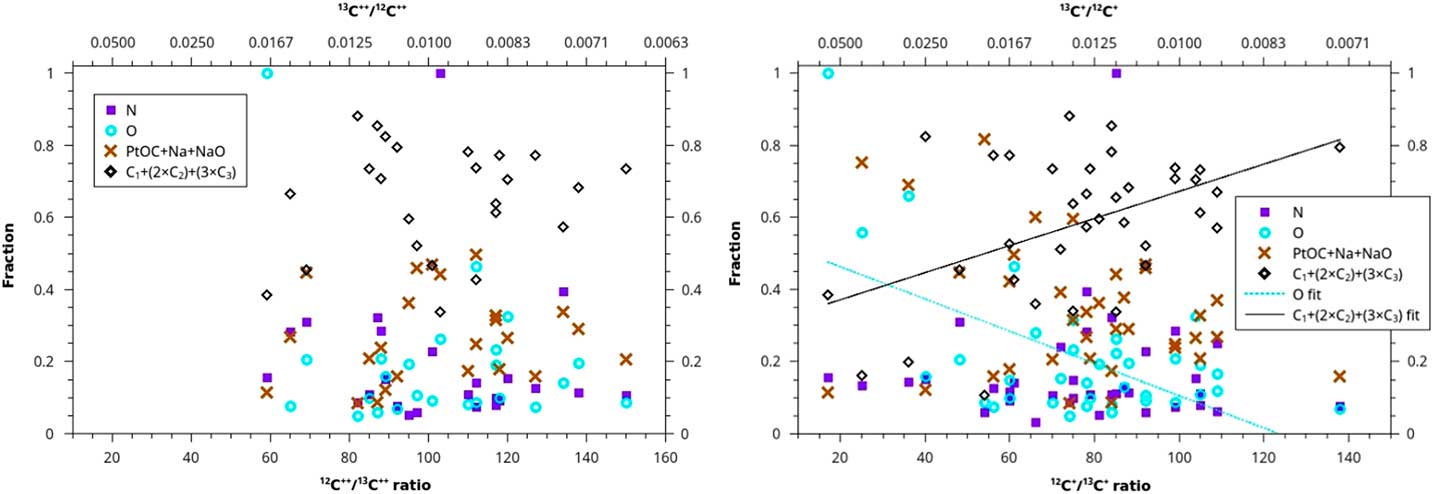
Another analytical method uses the concentrations of each of the four sets of ions that we have reason to believe may distinguish between disordered and diamond forms of carbon. We plot these concentrations versus the 12C/13C ratio for both doubly and singly charged carbon ions (Figure 5). For the 2+ ratios, all of the adjusted R2 values for the four fits are less than 0.1, and the slopes have very large uncertainties (fit lines not shown). For the 1+ ratios, the adjusted R2 is slightly negative for N and 0.04 for PtOC+Na+NaO (fit lines not shown). However, C does increase for the 1+ ratios, with a slope of 0.004±0.001 in units of (C1+2×C2+3×C3 concentration)/(12C/13C), albeit with an adjusted R2 of only 0.18. The O species decreases slightly with 12C+/13C+ ratios, with a slope of -0.004±0.001 in units of (O concentration)/(12C/13C), with an adjusted R2 of 0.30.

Figure 5 Ion fraction detected in the atom-probe as a function of C isotopic ratio for four sets of ions: N, O, PtOC+Na+NaO, and C+(2×C2)+(3×C3). The left graph is plotted against a ratio of C isotopes with a charge of 2+, and the right graph is plotted against a ratio of C isotopes with 1+ charge. None of the sets show any linear trend, except for O and C ions for the ratio of 1+ charge state C isotopes, which do exhibit weak linear trends. These two trends may suggest that contaminant-rich material in the acid residue, (disordered C) and material rich in uncontaminated C (nanodiamonds) form from two different stellar sources with different C isotopic ratios. However, these data may be exhibiting hydride interference (see text).
Discussion
We have detected two weak trends in trace element concentration with increasing 12C+/13C+ isotopic ratio: C increases, and O decreases. There are several possible interpretations. The low R2 fits to these trends means that it is possible that this is just the result of random scatter. It is also possible, based on these trends, that nanodiamonds have higher isotopic ratios than the disordered C and that these two phases formed from two different isotopic reservoirs. However, we note that the trends were only apparent for the 1+ ratios. This suggests that rather than inherent isotopic anomalies, these trends are due to an instrumental artifact that affects 1+ ratios more than 2+, for example, a 12CH+ hydride interference. This explanation would imply that contamination of the mass spectrum with hydrides, formed from residual gas in the atom-probe analysis vacuum chamber, goes up with increasing fraction of disordered C (more O) and decreasing fraction of diamond (less C). Such contamination would cause lower measured C+ ratios due to misindentification of 12CH+ hydride at 13 amu in the mass spectrum as 13C+, but not lower C2+ ratios, since 12CH2+ forms much less readily than 12CH+.
Future TEM work will be carried out in order to confirm this finding by distinguishing disordered carbon from diamonds in the Pt nanotips, using electron energy loss spectrometry (EELS), prior to APT. The TEM/EELS analysis can also distinguish between different types of bonding in disordered C, allowing us to comment on how specific types of disordered C behave under atom-probe analysis conditions.
Conclusion
We have identified an approach that allows us for the first time to distinguish qualitatively between APT reconstructions of acid residue that are dominated either by nanodiamonds or disordered carbon. This analysis is based on previous findings that nitrogen is more likely to form in nanodiamonds.
An initial comparison with the 12C/13C ratios of the microtips suggests that disordered, probably glassy carbon, has similar 12C/13C ratios to the nanodiamonds, indicating they may have formed from the same isotopic reservoir. Small differences between the isotopes in the two phases appear to be indicative of hydride formation proceeding more readily on disordered C than on nanodiamonds.
We expect that complementary or correlated studies by transmission electron microscopy, while potentially more conclusive in its identification of phases, may not always be necessary to distinguish between different material phases in the APT. Contaminant ions, which are more likely to form in each phase, may be used to distinguish phases.
Acknowledgments
This work is supported by NASA grants NNX14AP15H (J.B.L.) and NNX16AD26G (C.F.). The Cameca LEAP atom probe tomograph at the Northwestern University Center for Atom Probe Tomography (NUCAPT) was acquired and upgraded with NSF DMR-0420532 and ONR-DURIP N00014-0400798, N00014-0610539, N00014-0910781 equipment grants. NUCAPT received support from the MRSEC program (NSF DMR-1121262) at the Materials Research Center, the SHyNE Resource (NSF NNCI-1542205), and the Initiative for Sustainability and Energy at Northwestern (ISEN)).