


Archaeological research begins with the act of discovery,Footnote 1 and although archaeological discovery is often unsystematic or unintentional, it is something that is valued and celebrated by the field, the press, and the public (Bahn Reference Bahn1995; Fagan Reference Fagan1999). Ultimately, however, the discovery of any class of archaeological find must one day come to an end because the archaeological record is finite. Discovery as a whole will continue because the archaeological record is constantly being replenished with recent material remains, but what is being added is very different from what is being discovered in and lost from the archaeological record. There are, for instance, no more Upper Paleolithic sites, pharaonic tombs, or Hopewell mounds being created. Therefore, it is possible to conceive of a time when all of these things have been found, and our ability to learn about those aspects of the human past will be limited to the known sample. For some archaeologists working today, it may be difficult to imagine an end to archaeological discovery because experience tells us that there are millions of sites, artifacts, and other resources around the world that have yet to be discovered or professionally documented. Likewise, some regions have been only lightly sampled, North Korea and Burma being obvious examples. Yet, for some segments of the archaeological record, it is clear that discovery rates are declining.
In “Going, Going, Gone: Underwater Cultural Resources in Decline,” Keith and Carrell (Reference Keith, Carrell, Majewski and Gaimster2009:105) examine the archaeological record of shipwrecks and ask “How much of the resource have we used up and how much is left?” They view the problem as analogous to peak oil, or trying to estimate when global oil production will be maximized. They argue that “If . . . the rate at which sites are being discovered continues at the present pace, the world will ‘run out’ of significant shipwrecks in about four decades” (Keith and Carrell Reference Keith, Carrell, Majewski and Gaimster2009:117). In a study of discovery rates of major Paleoindian sites on the North America Great Plains, Seebach (Reference Seebach2006) shows that site discovery peaked in the 1930s and again in the 1950s, something he attributes to drought and increased rates of site exposure at those times. Discovery rates have largely been in decline over the ensuing decades. He notes that “we may not be able to make significant additions to the Paleoindian database until the Plains are subjected to another episode of drought” (Seebach Reference Seebach2006:85). Consider that there has not been a major find of a well-preserved Neandertal in nearly 20 years (Akazawa et al. Reference Akazawa, Muhesen, Ishida, Konod and Griggo1999), despite 50 having been found before that date. Likewise, nearly 20 years passed between the discoveries of the most recent Classic-period Maya monumental sites (Ponciano Reference Ponciano, Laporte and Escobedo1995; Šprajc Reference Šprajc2015). From these examples, it seems apparent that discovery rates of archaeological resources are in decline for many classes of finds.
Here we explore trends in discovery for seven diverse segments of the archaeological record and show that, for all, discovery rates have likely already peaked and are in decline (Supplemental Tables 1–7). Each dataset was compiled specifically for this study or taken from published literature: (1) all sites from the state of Wyoming, USA; (2) high-altitude archaeological sites from the state of Colorado, USA; (3) mostly complete Neandertal crania; (4) monumental sites of the Maya Classic period; (5) proboscidean kill/scavenge sites globally; (6) Upper Paleolithic sites from Europe; and (7) a compilation of shipwreck discoveries. These datasets were chosen because they incorporate a wide variety of site and discovery types and span a wide geographic area. While we do not intend to generalize from this sample to the entirety of the archaeological record, these datasets are sufficiently diverse to allow examination of broad trends in archaeological discovery.
Modeling Archaeological Discovery
Archaeological discovery is a complicated process that is undoubtedly affected by many things, such as the visibility of sites, economic growth and development, growth in the field of archaeology, cultural resource policy, changing rates of erosion, and political and intellectual history, and it is a subject that has rarely received formal study (Bocquet-Appel et al. Reference Bocquet-Appel, Noiret and Dobrowsky2005; Keith and Carrell Reference Keith, Carrell, Majewski and Gaimster2009; Seebach Reference Seebach2006). As a first attempt to describe discovery trends and allow discovery forecasting, we created a simple formal model, which intentionally does not incorporate most of these factors. Rather, we see this model as a useful baseline for exploring broad trends. We assume that archaeological discovery is a probabilistic process governed by the number of archaeologistsFootnote 2 (at ) searching at time (t), the total number of archaeological resources in existence (n0 ), and the per capita annual probability of site discovery (p). The per capita annual probability of site discovery is the annual likelihood that a given archaeological resource will be discovered by a single researcher. We further assume that the population of archaeologists grows logistically from a founding population of (a0 =1) to a carrying capacity (k) with a maximum growth rate of r:
 $$\begin{equation}
{a_t} = \frac{k}{{1 + \left( {\frac{{k - {a_0}}}{{{a_0}}}} \right){e^{ - rt}}}}
\end{equation}$$
$$\begin{equation}
{a_t} = \frac{k}{{1 + \left( {\frac{{k - {a_0}}}{{{a_0}}}} \right){e^{ - rt}}}}
\end{equation}$$
To justify this part of the model and to describe growth in the field of archaeology, we compiled data on the total membership of the Society for American Archaeology (SAA) from 1934 to 2015. Through the late 1980s, these data were taken from the journal American Antiquity, where membership statistics were regularly published. More recent data were provided by the SAA. A strong fit is observed between the model and data (Figure 1), suggesting that the field, at least in the United States, has grown logistically at a maximum rate of approximately seven percent/yr, and the SAA is approaching a “carrying capacity” of approximately 8,000 members. This result does not guide further analyses, but only serves to illustrate that this model does, to some extent, describe historical growth trends in the field.
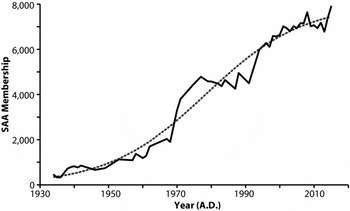
Figure 1. Growth of the field of archaeology in the United States as measured by the total membership of the Society for American Archaeology from A.D. 1934 to 2015. Gray dashed line indicates best fit of a logistic growth model, where t0 = 1,934 (a0 = 340, r = .07, k = 8,002).
Following from this demographic model, our model of site discovery through time estimates the cumulative number (nt ) of sites discovered at time t as:
 $$\begin{equation}
\frac{{dn}}{{dt}} = - pa\left( t \right)n\quad a\left( t \right) = \frac{k}{{1 + B{e^{ - rt}}}}
\end{equation}$$
$$\begin{equation}
\frac{{dn}}{{dt}} = - pa\left( t \right)n\quad a\left( t \right) = \frac{k}{{1 + B{e^{ - rt}}}}
\end{equation}$$
where B is:
 $$\begin{equation}
B = \frac{{k - {a_0}}}{{{a_0}}}
\end{equation}$$
$$\begin{equation}
B = \frac{{k - {a_0}}}{{{a_0}}}
\end{equation}$$
The solution of the integral is:
 $$\begin{equation}
{n_t} = {n_0}{e^{ - pk\left[ {t + \frac{1}{r}ln\left( {\frac{{1 + B{e^{ - rt}}}}{{1 + B}}} \right)} \right]}}
\end{equation}$$
$$\begin{equation}
{n_t} = {n_0}{e^{ - pk\left[ {t + \frac{1}{r}ln\left( {\frac{{1 + B{e^{ - rt}}}}{{1 + B}}} \right)} \right]}}
\end{equation}$$
In Figure 2, we illustrate the predicted number of sites discovered by decade (nt+10-nt ) while varying p, or the annual per capita probability of site discovery. We varied this value from p = 10−2 to p = 10−6 to illustrate the expected discovery trends for archaeological phenomena that have relatively high discovery probabilities (e.g., large surface sites) to those with relatively low probabilities (e.g., small buried sites).

Figure 2. Modeled discovery trends as a function of time while varying p, the per capita annual probability of site discovery, where t0 is the initial year of archaeological discovery. Y-axis is the number of finds per decade. For all curves, k = 1,000, r = .06, and n0 = 100,000.
In general, the model predicts that rates of archaeological discovery should ramp up logistically, tracking the growth of the field until reaching a peak. Discovery rates are then expected to decline as the record becomes depleted. The shape of the curve, both the time until peak discovery occurs and the length of the right tail, or the time to depletion of the record, is largely dependent upon discovery probability, or the likelihood of a particular segment of the record being discovered. Portions of the record that are easily discovered (p > 10−3) are expected to quickly peak and be depleted, possibly within a century of searching by archaeologists. In cases of very low probabilities of discovery (p ≤ 10−6), however, the right tail is extended greatly, and discovery can persist at a relatively constant rate with very slow declines that can continue for centuries (Figure 2).
Datasets
To compare the model to archaeological reality, we compiled seven diverse datasets (Supplemental Tables 1–7) intended to represent very different segments of the archaeological record, both geographically and with respect to discovery probability.
All Recorded Sites in Wyoming
This dataset includes 59,455 archaeological sites recorded in Wyoming from A.D. 1930 to 2009. These data were provided in decadal intervals by the Wyoming State Historic Preservation Office. The great majority of sites in this dataset are surface scatters of chipped stone discovered in the context of cultural research management (CRM) projects. Discovery date is defined as the year in which the site was initially recorded.
All Recorded High-Altitude Sites in Colorado
This dataset was derived from the Colorado Office of Archaeology and Historic Preservation, and discovery date is defined as the year of recordation. It differs from the Wyoming dataset in two important ways: (1) it is limited to sites above 3,000 m in elevation, and (2) high-elevation archaeology is primarily a research domain, not one of CRM. It includes 2,224 sites with discovery dates ranging from A.D. 1932 to 2011.
Neandertal Crania
This dataset includes all complete or nearly complete Neandertal crania (n = 51) from Europe and Asia. It spans the years A.D. 1829 to 1997. Discovery date is defined as the initial year of discovery.
Classic Maya Monumental Centers
This dataset covers large Maya sites, primarily mound complexes, whose occupations are generally attributed to the Classic period (A.D. 250–900). Here, discovery date is defined as the year of first publication within the archaeological literature. The dataset includes 36 sites. First publication ranges from A.D. 1822 to 1995.
European Upper Paleolithic Sites
This dataset was produced by digitization of Figure 2 from Bocquet-Appel et al. (Reference Bocquet-Appel, Noiret and Dobrowsky2005) and includes 979 Upper Paleolithic archaeological sites from France, the European part of the former Soviet Union, and the rest of Europe with discovery dates binned in 20-year intervals. Discovery dates span A.D. 1810 to 1990. We summed the three datasets, all of which show similar discovery trends through time.
Proboscidean Kill/Scavenge Sites
This dataset is global and includes sites where one to several proboscideans are spatially associated with artifacts (n = 45). These are sites where humans or hominins hunted or scavenged proboscidean and range in age from the Lower Paleolithic to the Later Stone Age and Paleoindian periods. The bulk of the dataset is derived from Surovell et al. (Reference Surovell, Waguespack and Brantingham2005) but includes three sites published after that date. Discovery date is defined as the first date of professional publication and spans the years A.D. 1889 to 2008.
Shipwrecks
This dataset was taken from Keith and Carrell (Reference Keith, Carrell, Majewski and Gaimster2009), who present discovery trends for three databases of shipwrecks, those from Florida, County of Sussex, England, and sailing ships of the East India Companies. This is our only underwater dataset, and it was created by digitization of Figures 7, 8, and 9 from Keith and Carrell (Reference Keith, Carrell, Majewski and Gaimster2009). It includes 488 shipwrecks with discovery dates spanning the years A.D. 1960 to 1993.
Methods
To compare observed discovery trends to our discovery model, we fit the model to the (x, y) cumulative frequency distributions of unbinned data when availableFootnote 3 by varying the parameters of interest (k, p, r, and n0 ) in order to maximize a Gaussian likelihood function (or rather to minimize the log of that function):
 $$\begin{eqnarray}
&&\ln p\left( {y{\rm{|}}x,k,p,r,{n_0}} \right)\nonumber\\
&&\quad = - \frac{1}{2}\mathop \sum \limits_n \left[ {\frac{{{{\left( {{y_n} - y'} \right)}^2}}}{{\sigma _n^2}} + {\rm{ln}}\left( {2\pi \sigma _n^2} \right)} \right]\nonumber\\
\end{eqnarray}$$
$$\begin{eqnarray}
&&\ln p\left( {y{\rm{|}}x,k,p,r,{n_0}} \right)\nonumber\\
&&\quad = - \frac{1}{2}\mathop \sum \limits_n \left[ {\frac{{{{\left( {{y_n} - y'} \right)}^2}}}{{\sigma _n^2}} + {\rm{ln}}\left( {2\pi \sigma _n^2} \right)} \right]\nonumber\\
\end{eqnarray}$$
Here, y’ is our model for site discovery (Equation 4) and σn is the error on datum yn . We adopt Poisson errors for σn . We fit over parameter ranges that ensure that the returned confidence limits lie well within the searched parameter space (typically, 0 < k < 1000000, 10−8 < p < 10−0.7, 0 < r < .5 and 0 < n0 < 5000000). We combine the likelihood function with uninformative (“flat”) priors, such that the likelihood function is multiplied by 1 in the parameter space of interest and 0 outside of the parameter space of interest.
Through Bayes Theorem, each combination of the parameters of interest then produces a probability of the model conditioned on the data. Thus, as we sample the parameters of interest, we build up a density of probabilities, with the highest probability representing the best model. We determine confidence limits as the parameter values that correspond to 68 percent of the density in probability (from 16 percent to 84 percent of the density) around the probability of the best-fitting combination of parameters. We typically use 100,000 samples to derive such confidence limits. Our use of a Gaussian likelihood and flat priors means that our fitting procedure resembles the typically familiar chi-squared minimization process. To rapidly sample the probability space, we use the affine-invariant Markov chain Monte Carlo sampler of Goodman and Weare (Reference Goodman and Weare2010) as implemented in the emcee Python package (Foreman-Mackey et al. Reference Foreman-Mackey, Hogg, Lang and Goodman2013).
By doing so, we are able to examine the degree to which the model fits observed discovery trends, estimate values of model parameters, and forecast future trends in discovery. Forecasting is somewhat problematic for two reasons. First, many of our datasets are fairly small and somewhat noisy (e.g., Neandertals, proboscideans, and Maya), and, therefore, our model fits may not be a particularly strong reflection of reality. Consider the Wyoming dataset. It includes a huge number of sites, but those are reduced to only nine decadal data points from which a trend is inferred. In other words, we may still be too early in the process of discovery to adequately describe long-term trends. Second, extrapolation of any trend beyond its empirical limits is potentially problematic because a uniformitarian assumption is required, namely that future trends will be a continuation of those observed in the past. In this specific case, there are reasons to believe that our uniformitarian assumption might not hold true, such as the exploration of new regions for cultural resources, changes in rates of growth or decline of the field of archaeology, and advances in technology that could improve the probability of discovery of certain parts of the archaeological record (e.g., Foley and Mindell Reference Foley and Mindel2002; Garrison et al. Reference Garrison, Chapman, Houston, Román and López2011; Lasaponara and Masini Reference Lasaponara and Masini2012; McHugh et al. Reference McHugh, Breed, Schaber, McCauley and Szabo1988; Myers Reference Myers2010).
Results
Generally speaking, trends in archaeological discovery over time match the form predicted by our model (Figure 3). Also, for all of our datasets, with the exception of Wyoming, rates of archaeological discovery appear to have peaked at some point in the past. Discoveries of Neandertal crania peaked in the A.D. 1920s and 1930s, and discovery of Classic-period Maya centers peaked a decade earlier.Footnote 4 Discovery of other portions of the record peaked later in the twentieth century, including shipwrecks (A.D. 1970s), high-altitude sites in Colorado (A.D. 1980s),Footnote 5 and Upper Paleolithic sites in Europe (A.D. 1960s). Rates of discovery of proboscidean kill/scavenge sites globally reached the level of approximately seven per decade from 1950 through 1970 and have remained relatively constant since that time. It should be noted that our best-fit model predicts that discovery of these sites will actually peak around 130 years from now at a rate of roughly two per year. The discovery of archaeological sites in Wyoming shows its peak in the most recent bin, the A.D. 2000s, but our best-fit model predicts that it peaked in that decade and will begin a slow decline moving forward. In other words, for all of our datasets, whether comprised of surface or buried sites, terrestrial or marine resources, or archaeological finds in the Old World and New World, rates of archaeological discovery appear to be on the decline and, if not declining, very close to the point of peak discovery.

Figure 3. Actual and modeled discovery trends for all datasets plotted as year of discovery vs. the number of finds per year. Gray bars indicate actual numbers of discoveries binned in 5-, 10-, or 20-year intervals. Black lines are best-fit models, and gray buffers around those lines show error ranges for the final 100,000 iterations of model fitting. Modeled trends are forecasted through the year A.D. 2100.
That said, best-fit models predict different patterns of decline for different segments of the record. Neandertal crania, large Classic Maya sites, and East Indiamen, Florida, and County of Sussex shipwrecks are predicted to be near the point of depletion. In other words, within a decade or two, there will be little left to find. It should be noted that there is a large error range on our Maya trend due to a small sample and two peaks in discovery separated widely in time. Pessimistically, no more Classic Maya centers remain to be found, but, optimistically, there may be as many as 50 more awaiting discovery with the record reaching depletion around A.D. 2300. We tend toward the pessimistic side of things because large monumental sites should be characterized by relatively high discovery probabilities, even with heavy forest cover in much of the Maya region. High-altitude sites in Colorado and all sites in Wyoming are predicted to be characterized by similar discovery trends with declining rates of discovery continuing over the next several decades, reaching depletion sometime in the late twenty-first to the twenty-eighth centuries. Upper Paleolithic sites and proboscidean kill/scavenge sites are predicted to show a different pattern with relatively constant but slowly declining rates of discovery for centuries to come. Regarding these two datasets, whether those forecasts bear true is unclear and, again, they may be artifacts of fitting our model to fairly small datasets over short periods of archaeological history. Given the long history and intensity of Paleolithic research in Europe, we would not be surprised if our forecast for Upper Paleolithic site discovery in Europe is overly optimistic, a hypothesis that could be in part tested with the addition of two more decades of data to that dataset, but that is beyond the scope of this paper.
By creating best-fit models for each dataset, we are able to estimate values of model parameters (Table 1). It should be noted that a very wide range of model parameters can produce reasonable fits, and some parameters are more constrained than others. In Figure 4a, we show the estimated annual per capita discovery probability for each type of archaeological resource, and our estimates are, for the most part, intuitively satisfying. Proboscidean kill/scavenge sites and Upper Paleolithic sites are generally characterized by very low discovery probabilities (p ≈ 10−8 to 10−7). These are typically buried sites with little surface manifestation, and the former are most commonly discovered accidentally due to erosion or the operation of heavy machinery. Of course, many Upper Paleolithic sites occur in caves, which can be easily discoverable and may explain why the model predicts that they have a slightly higher chance of discovery. The large surface records of archaeological sites in Wyoming and Colorado are also characterized by low discovery probabilities (p ≈ 10−8 to 10−6). These are records with an abundance of sites spread across large areas. Those sites on average do not have strong surface manifestations, in comparison to sites with monumental architecture, for example. Classic Maya centers and shipwrecks are estimated to have the highest discovery probabilities (p ≈ 10−3). This should be of no surprise regarding large Maya sites, but it is interesting that shipwrecks are predicted to be equally “discoverable” because they are submerged. It may be, however, that a small number of individuals searching for shipwrecks in a region can discover the majority of them fairly quickly (Keith and Carrell Reference Keith, Carrell, Majewski and Gaimster2009). One somewhat unexpected result is that Neandertal crania, or well-preserved Neandertal burials, have relatively high discovery probabilities (p ≈ 10−3) because they are a fairly rare resource that occurs in buried contexts. If true, this may imply something about the kinds of sites where Neandertals tended to bury their dead, which are typically large caves (Ahern et al. Reference Ahern, Janoković, Voisin, Smith, Smith and Ahern2013; Franciscus and Holliday Reference Franciscus, Holliday, Smith and Ahern2013; Pettitt Reference Pettitt2002; Riel-Salvatore and Clark Reference Riel-Salvatore and Clarke2001; Stringer et al. Reference Stringer, Hublin, Vandermeersch, Smith and Spencer1984), and those may also be the sites that are the first to attract excavation by archaeologists. In other words, this decline may be more about a decline in the discovery of large caves in the Neandertal range than Neandertal burials themselves.
Table 1. Minimum and Maximum Model Fitting Parameter Values.

Note: Final 100,000 model iterations; n0 = number of sites; p = discovery probability; k = archaeological carrying capacity; r = archaeologists growth rate.

Figure 4. (a) Per capita annual probability of discovery for each dataset plotted as mean ± s for the final 100,000 iterations of model fitting. (b) Estimated degree of depletion of the archaeological record for each dataset using the minimum and maximum values of n0 for the final 100,000 iterations of model fitting relative to the known number of sites discovered at the chronological endpoint of each dataset.
We are also able to estimate the proportion of the record that remains undiscovered (Figure 4b). According to our best-fit models, shipwrecks are the most depleted resource, at least in this sample, with only as much as around three percent of the record remaining, and it is perhaps not coincidental that the depletion of this archaeological resource has already been noted among shipwreck researchers (Keith and Carrell Reference Keith, Carrell, Majewski and Gaimster2009). According to our model, on the optimistic end, only 6 percent of well-preserved Neandertal crania remain undiscovered. Our model for Classic Maya centers is hugely variable suggesting that anywhere from 0 to 59 percent of the record remains undiscovered, but, again, we suspect that the truth is closer to zero. Our model predicts that 20 to 50 percent of high-altitude sites in Colorado have yet to be documented, compared to 44 to 69 percent of sites in Wyoming. Finally, if our model fit is correct, we have barely scratched the surface of European Upper Paleolithic and global proboscidean kill/scavenge sites, with more than 99 percent of sites remaining undiscovered. We suspect that this may be true of the latter but not necessarily of the former. The predicted long right tail of the proboscidean and Upper Paleolithic datasets in comparison to the Wyoming dataset derives in large part from a much higher estimated rate of growth of the field of archaeology for Wyoming (22 to 25 percent per year over the time span of the dataset) compared to the other two (~ 4 to 10 percent per year), which is likely the result of the Wyoming dataset being largely derived from CRM, while the other two are primarily in the research realm.
Estimated maximum annual growth rates for the field are generally reasonable (Table 1), although they vary considerably, mostly depending upon the age depth of the dataset. For example, Classical Maya archaeology is estimated to have grown slowly (.4 to 2 percent per year) in comparison to shipwreck, Wyoming, and high-altitude Colorado archaeology (~20 to 43 percent per year), whose first discoveries, at least in our datasets, occur more than 200 years later. Our model-fitting algorithm struggles to produce reasonable estimates for carrying capacities of archaeologists (Table 1), with carrying capacity again referring to the maximum number of archaeologists that can be supported within a particular subfield. Either the best-fit models are unable to constrain this variable within a small range, as in the case of the Neandertal, Classic Maya, and shipwreck datasets, where estimates span five orders of magnitude, or the estimates are likely too small (Upper Paleolithic and Proboscideans) or clearly too large (Wyoming and Colorado). For the Wyoming and Colorado datasets, the model struggles to accommodate the slow growth of the field from the 1930s through 1960s, followed by very high growth rates, undoubtedly a result of the passage of the National Historical Preservation Act in 1966. By sacrificing the simplicity of our model, a more complex and realistic model might allow for variable growth rates in the field, which could no doubt accommodate these datasets without having to assume the field growing to untenable sizes.
Discussion
While this exercise suggests that discovery rates of archaeological sites are in decline, our results should not be interpreted too literally. As mentioned above, extrapolation of past trends into the future is potentially problematic. It is not difficult to imagine, for example, the discovery of additional Middle Paleolithic sites, whether caves, especially caves that are now underwater or have collapsed/buried entrances, or open-air localities, that yield additional Neandertal burials, particularly in areas that have received relatively little attention by professional archaeologists (e.g., outside of Western Europe). Likewise, there are undoubtedly parts of the underwater world that have been barely explored for significant shipwrecks. In other words, there are still geographic frontiers of archaeological exploration. In fact, it is our impression that one research priority of archaeology has always been the exploration of archaeologically untouched or lightly sampled regions, the increasing interest in high-altitude regions of the world being one obvious example (e.g., Aldenderfer Reference Aldenderfer2011; LaBelle and Pelton Reference LaBelle and Pelton2013; Morgan et al. Reference Morgan, Losey and Adams2014; Rademaker et al. Reference Rademaker, Hodgins, Moore, Zarrillo, Miller, Bromley, Leach, Reid, Álvarez and Sandweiss2014) and deep water exploration being another (e.g., Søreide Reference Søreide2011).
Technological improvements in site survey and reconnaissance could theoretically usher in a new era of site discovery. Airborne or space-based technologies, like satellite imagery (Lasaponara and Masini Reference Lasaponara and Masini2012; Myers Reference Myers2010; Parcak Reference Parcak2009) and radar (Garrison et al. Reference Garrison, Chapman, Houston, Román and López2011; McHugh et al. Reference McHugh, Breed, Schaber, McCauley and Szabo1988), have already proven their value. It should be noted, however, that technological advancement might cause a temporary uptick in site discovery rates, but it will serve only to accelerate the demise of discovery.
On the technological front, what is sorely needed are means of seeing beneath the ground surface, and while the traditional remote sensing methods of ground penetrating radar, resistivity, and magnetometry have proven to be useful tools after site discovery, the field is still reliant on the traditional “nonremote sensing” implements of test pits, shovel tests, backhoes, cores, and auger probes for discovering things buried at depth. Seebach (Reference Seebach2006:85) notes that, if we are to break the trend of declining rates of site discovery, the new frontier of archaeological discovery will have to involve exploration of deeply buried sedimentary contexts where archaeological sites have no surface exposure. Our proboscidean kill/scavenge site dataset (and perhaps the Upper Paleolithic dataset) suggests that this record is far from depleted; it is possible that the new archaeological frontier may not be the exploration of undeveloped nations and hard-to-get-to places but instead could be in places where surface survey has occurred but deep testing has not.
We expect that discovery-driven research will become increasingly costly, both in terms of time and money, as greater efforts will be required to locate new sites. Consider the feats of spelunking that were required in the context of a sparse record of South African hominins for the discovery of Dinaledi Chamber in Rising Star Cave, where Homo naledi was found (Dirks et al. Reference Dirks, Berger, Roberts, Kramers, Hawks, Randolph-Quinney, Elliott, Musiba, Churchill, de Ruiter, Schmid, Backwell, Belyanin, Boshoff, Hunter, Feuerriegel, Gurtov, Harrison, Hunter, Kruger, Morris, Makhubela, Peixotto and Tucker2015), or the cost per artifact of recovering cultural remains from deep-water contexts (e.g., Fedje and Josenhans Reference Fedje and Josenhans2000). With rising costs, we anticipate greater emphasis on work with museum and repository collections as well as big data approaches to archaeological research. This may also affect funding priorities in archaeology where money may be better spent on collections research rather than discovery-based projects where the scientific yield per dollar spent is likely to be higher, or at least associated with less risk. We also raise the issue of whether the field as a whole should be more cognizant of the need to conserve nonrenewable archaeological sites and other resources.
This discussion brings to mind the implications of our results for compliance archaeology. Except for our Wyoming dataset, our findings mostly concern archaeological resources that are typically discovered in the research domain. Our Wyoming dataset, which was largely generated in the context of cultural resource management, suggests that those resources that form the bread and butter of contract archaeology, surface and near-surface finds, remain undiscovered in abundance and that depletion is not expected to occur until one to several centuries have passed, reinforcing the continuing value of discovery in the context of compliance archaeology. Perhaps more important is the idea that, as a whole, historic archaeological resources are growing in number and discovery of such resources can continue ad infinitum.
Finally, it is important to note that discovery represents only the start of the archaeological research endeavor, and although we have placed high value on discovery, it is probably the least interesting and least important part of what we do. By pondering the end of archaeological discovery, we are not in any way implying that this equates to the end of archaeology. Archaeological sites are rarely excavated in their entirety, and the great majority of sites that have been discovered are still available for additional field research. Although we have not studied the question directly, it is our impression that many more excavations happening today are reinvestigations of sites first examined long ago, in comparison to four or more decades ago, when the ground was being broken for the first time on many sites. Paleoindian archaeology provides numerous examples of renewed investigations of classic sites (Boldurian Reference Boldurian and Cotter1999; Frison and Stanford Reference Frison and Stanford1982; Frison and Todd Reference Frison and Todd1987; Gingerich Reference Gingerich2007; Haynes and Haury Reference Haynes and Haury1982; Haynes et al. Reference Haynes, Kornfeld and Frison2004; Johnson Reference Johnson1987; Larson et al. Reference Larson, Kornfeld and Frison2009; Meltzer Reference Meltzer2006; Todd and Rapson Reference Todd, Rapson, Brugal, David, Enloe and Jaubert1999; Waters et al. Reference Waters, Pevny and Carlson2011).
Conclusions
For many portions of the archaeological record, if not the majority of it, rates of discovery are in decline, and some segments of the record are already reaching depletion. Within a few decades, it may be that there are no more Classic Maya monumental sites or shallow-water shipwrecks in Florida to be found. Well-preserved Neandertal burials also appear to be in short supply. In general, those parts of the record that are easily discovered, such as sites with obvious surface manifestations, are especially depleted, while small surface and buried sites still remain undiscovered in abundance. There is much room for improvement in our model of archaeological discovery, but it seems to capture general trends well. The extent to which our forecasts are accurate will require decades of additional work. Even so, we suspect that these trends will have important impacts on the field as we move forward, including more research in underexplored parts of the world and greater interest in investigating deep sedimentary contexts that may preserve archaeological sites, particularly where no evidence of cultural presence is manifested on or near the surface. It seems clear that the next generations of archaeologists may find themselves working in a very different environment than those of a generation ago, where the use of existing collections and the reinvestigation of known sites will become increasingly common in comparison to putting boots on the ground in the quest for new discoveries. In fact, those trends are likely already underway.
Acknowledgments
We are grateful to Tobi Brimsek, the Executive Director of the Society for American Archaeology, for providing recent SAA membership data. Ross Hilman at the Wyoming State Preservation Office provided site discovery data for Wyoming. Our Colorado dataset was provided by the Colorado Office of Archaeology and Historic Preservation. Maria Fernanda Boza Cuadros translated our abstract to Spanish.
Data Availability Statement
All data used in this study are available in supplemental online companion files.
Supplemental Materials
Supplemental materials are linked to the online version of the paper, accessible via the SAA member login at https://doi.org/10.1017/aaq.2016.33:
Supplemental Table 1. Large Classic Maya Center Dataset.
Supplemental Table 2. Proboscidean Kill/Scavenge Site Dataset.
Supplemental Table 3. Neandertal Dataset.
Supplemental Table 4. High-Altitude Colorado Sites.
Supplemental Table 5. Shipwrecks.
Supplemental Table 6. Wyoming, All Sites.
Supplemental Table 7. European Upper Paleolithic Sites.


