


Ethanol co-products such as distillers grains (wet, modified or dry) and condensed distillers solubles are economical feedstuffs and are readily available in the Midwestern USA; however, sulphate often limits their inclusion in Midwestern cattle diets. The excess sulphate in ethanol co-products is a by-product of sulphuric acid used for fermentor pH control and as a cleaning agent in the ethanol production process. Dissimilatory reduction of sulphate by sulphate-reducing bacteria (SRB) in the rumen produces sulphide( Reference Campbell and Postgate 1 ), which can lead to a build-up of the toxic gas hydrogen sulphide (H2S) in the rumen. Increased dietary sulphate may decrease feed intake by cattle, leading to decreased gain and reduced carcass quality( Reference Richter, Drewnoski and Hansen 2 , Reference Schoonmaker, Beitz and Makkar 3 ). The production of large amounts of ruminal H2S can also result in the neurological disorder polioencephalomalacia (PEM)( Reference Gould 4 ).
A potential method of decreasing the negative effects of high dietary sulphate and decreasing the incidence of sulphate-induced PEM is to include a compound in the diet that would decrease the amount of sulphide produced by inhibiting SRB in the rumen and/or by binding sulphide in the rumen fluid before it is converted to H2S. Previous in vitro data have suggested that experimental compounds such as 9,10-anthraquinone or high concentrations of Mo or Mn may decrease H2S concentrations( Reference Schoonmaker, Beitz and Makkar 3 , Reference Kung, Bracht and Tavares 5 ). In other anaerobic environments, such as marine sediments and aquifers, dissimilatory ferric Fe reduction has been shown to competitively inhibit sulphate reduction( Reference Lovley and Phillips 6 , Reference Chapelle and Lovley 7 ). In the present study, we hypothesised that adding ferric citrate to the diets of cattle would decrease ruminal sulphate reduction. To address this hypothesis, we designed three experiments to determine the effects of two different sources of ferric citrate on in vitro H2S concentrations, in vitro DM digestibility and in vivo feed intake and ruminal H2S concentrations in steers fed a finishing diet. The objectives of the present study were to determine the effects of ferric citrate on ruminal fermentation, ruminal H2S concentrations and the feed intake of cattle.
Materials and methods
Procedures and use of animals for the experiments were approved by the Iowa State University Animal Care and Use Committee.
Expt 1
A ruminally cannulated Angus-type steer was adapted to a high-concentrate, high-sulphate diet (0·51 % S; Table 1) for a minimum of 14 d before the first collection of ruminal fluid. The steer was limit fed at a rate of 2 % body weight each morning. Ruminal fluid was collected in the morning before feeding via a suction strainer and transported to the laboratory in a pre-warmed thermos, strained through four layers of cheesecloth and mixed with an equal volume of warm (39°C) mineral buffer solution (McDougall's buffer( Reference McDougall 8 ), without the reducing solution). In brief, 60 ml of the rumen fluid/buffer solution (pH 6·91) were added to each 125 ml serum bottle that contained 400 mg (as-fed) of substrate and either no additional compounds (control) or the appropriate amount of compounds, based on the molecular weight (22·8 and 19·9 % Fe for ferric citrate and ferric ammonium citrate, respectively) of ferric citrate monohydrate (C6H5FeO7·H2O; Sigma-Aldrich) or ferric ammonium citrate (green form; C6H8O7· x Fe3+· y NH3; Fisher Chemical) to achieve the added concentrations of Fe in the fluid of 25, 50, 100, 150 or 200 mg/l. The diet being fed to the steer was ground through a 1 mm sieve (Retsch) and used as a substrate for in vitro fermentation. There were six replicate bottles per treatment. The bottles were then purged with CO2 for 10 s and sealed with a butyl rubber stopper and crimp seal. Serum bottles were incubated in an orbital-shaking water-bath set at 39°C and 80 rpm for 24 h.
Table 1 Composition of the diet* fed to steers used for in vitro inoculum and the substrate added to in vitro bottles (Expts 1 and 2)
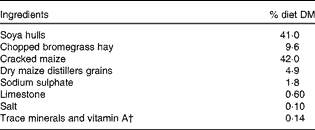
* Diet was 0·51 % sulphate on a DM basis.
† Provided per kg diet DM: 0·1 mg Co, 10 mg Cu, 0·5 mg I, 20 mg Mn, 0·1 mg Se, 30 mg Zn and 4400 IU vitamin A (1320 μg retinol).
At the end of the 24 h period, gas production was measured using an inverted burette( Reference Kung, Bracht and Tavares 5 ). After gas production was measured, 5 ml of the gas were extracted from the headspace of the fermentation bottle and used to determine H2S concentration. Each bottle was then opened and fluid pH determined using a portable pH probe (Oakton pH 11 Series; Eutech). The bottle was then placed on crushed ice to stop fermentation and a 30 ml subsample of the fluid was frozen at − 20°C until preparation for analysis of volatile fatty acids (VFA). H2S concentration of the gas was measured using a modification of the method described by Kung et al. ( Reference Kung, Bracht and Tavares 5 ). Sodium hydroxide (5 m) was added to the distilled water until a pH of 12 was reached. Then, the water with pH 12 was deaerated by bubbling N2 through the water for 30 min. Thereafter, 5 ml of the deaerated water with pH 12 were injected into a 10 ml vacutainer tube (Becton Dickinson). Immediately after 5 ml of the gas were collected from the in vitro bottle, it was bubbled through the 5 ml of the deaerated water with pH 12 in the vacutainer tube to convert H2S to the hydrosulphide ion (HS−). The vacutainer tube was then shaken vigorously, and the methylene blue method( Reference Siegal 9 ) was used to measure the sulphide content of the water. Radiello Methylene Blue Calibration Standard, RAD 171 (Supelco) was used to create a standard line for sulphide measurement.
Before VFA analysis, rumen fluid samples were thawed and mixed, and a 5 ml subsample was then centrifuged at 2400 g for 30 min at 4°C. Following centrifugation, a 5 ml subsample of the centrifuged rumen fluid was thoroughly mixed with 1 ml of 25 % metaphosphoric acid (w/v), and refrozen at − 20°C before the final analysis. The mixture was thawed, centrifuged at 790 g for 10 min and 1 ml of the clarified supernatant combined in a vial with 100 μl of 0·4 % 2-ethylbutyric acid (v/v) as an internal standard. Concentrations of acetate, propionate and butyrate were determined in the ruminal fluid using a Varion 3900 gas chromatograph (Varian Chromatography Systems) with a DB-FFAP column (30 m; 0·25 mm inner diameter; Agilent)( Reference Drewnoski, Richter and Hansen 10 ).
Expt 2
Ruminal fluid collection and preparation were the same as in Expt 1. In brief, 80 ml of the rumen fluid/buffer solution (pH 7·06) were added to each 100 ml jar containing either no additional compounds (control) or the appropriate amount of ferric citrate or ferric ammonium citrate to achieve the added concentrations of Fe in the fluid of 25, 50, 100, 150 or 200 mg/l. Dacron bags (4 × 5 cm; 25 μm pore size; Ankom) containing 0·25 g (as-fed) of substrate were placed inside the jar. The jars were then purged with CO2 for 10 s and sealed with a cap containing a one-way pressure release valve. The jars were incubated in a water-bath set at 39°C for 24 h. There were six replicate jars per treatment. At the end of the 24 h period, the bags were removed from the jars and were placed in ice water and then rinsed until the water was clear. The bags were then dried at 70°C for 48 h and then weighed to determine DM disappearance.
Fe concentration of the two sources was measured after Expts 1 and 2 were conducted and were found to be lower than calculated (19·7 and 14·9 % Fe for ferric citrate and ferric ammonium citrate, respectively). The concentration of the two compounds and the actual concentration of Fe for each of the targeted Fe concentrations are shown in Table 2.
Table 2 Concentrations of added iron and compound in fluid after in vitro incubations (Expts 1 and 2) for the two iron sources tested
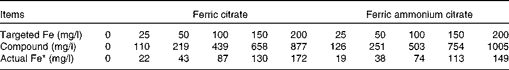
* Based on the analysis of concentrations of Fe in the two sources and the amount of the compound added.
Expt 3
A total of eight Angus-type ruminally fistulated cattle (543 (sem 12) kg) were used in a replicated Latin square design with four periods and four treatments. Before the start of the trial, all steers were adapted to a finishing diet using three step-up diets in which the amount of maize was increased and the amount of hay was decreased over approximately 3 weeks (Table 3). The Latin square had 11 d periods and consisted of a 3 d washout period where all cattle were fed the control diet, and an 8 d period in which steers were fed their experimental diet, of which intake was determined during the last 4 d. The treatments fed to the cattle included: (1) a high-sulphate control diet (0·46 % S; control); (2) the control diet plus ferric ammonium citrate at a concentration of 200 mg Fe/kg (Fe200); (3) the control diet plus ferric ammonium citrate at a concentration of 300 mg Fe/kg (Fe300); (4) the control diet plus ferric ammonium citrate at a concentration of 400 mg Fe/kg (Fe400). These concentrations of added ferric iron were expected to achieve added concentrations of Fe in the rumen fluid of 40, 60 and 80 mg/l (based on an estimated DM intake of 2·2 % body weight, a rumen liquid volume of 50 litres and a passage rate that resulted in a 24 h mean retention time).
Table 3 Composition of the in vivo steer diet* (Expt 3)
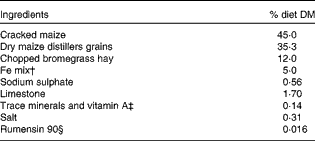
* Control diet was 0·46 % sulphate and contained 128 mg Fe/kg DM.
† Ferric ammonium citrate mixed into dry distillers grains at 0·02, 0·03 or 0·04 % of the mix and provided 216, 291 or 366 mg Fe/kg diet DM, respectively.
‡ Provided per kg diet DM: 0·1 mg Co, 10 mg Cu, 0·5 mg I, 20 mg Mn, 0·1 mg Se, 30 mg Zn and 4400 IU vitamin A (1320 μg retinol).
§ Provided 32 mg monensin/kg diet DM.
Steers were individually fed using slick bunk management. Feeding was managed to have trace amounts to 0·5 kg of feed left in the bunk before the next morning feeding. When no feed was left in the bunk for two consecutive days, the amount fed to the steer was increased by 0·2 kg and when over 1 kg of feed was left in the bunk at morning feeding for two consecutive days, the feeding rate was reduced by 0·5 kg. Any orts were weighed and collected in the morning before feeding at the end of the washout period (day 4), after adaptation to the experimental diet (day 8) and at the end of the experimental diet period (day 12). Samples of individual diet components and orts were dried at 70°C to determine DM, and then ground through a 2 mm screen. Dried and ground samples were then acid digested (CEM MARSXpress) with trace mineral-grade HNO3, diluted to 10 % HNO3 with deionised water and analysed for sulphate and Fe concentrations by inductively coupled plasma atomic emission spectrometry (Optima 7000; Perkin Elmer). Fe concentrations of diets were measured to be 128, 344, 419, 494 mg/kg DM for the control, Fe200, Fe300 and Fe400 treatments, respectively. Therefore, supplemental Fe concentrations added to the diets from ferric ammonium citrate were 216, 291 and 366 mg/kg DM for the Fe200, Fe300 and Fe400 treatments, respectively.
H2S concentration in the rumen gas was measured 6 h after feeding on the last day of each period using commercial gas detector tubes (Kitagawa)( Reference Drewnoski, Ensley and Beitz 11 ). In each period, rumen fluid was collected from the cannulated steers using a suction strainer, on day 4 (before feeding and at the end of the washout period) and on day 11 (6 h post-feeding and 8 d on the experimental diet) after H2S concentration of the ruminal gas was measured. Rumen fluid was strained through four layers of cheesecloth, and 1 ml of the strained fluid was acid digested with 9 ml of trace mineral-grade HNO3, diluted to 10 % HNO3 with deionised water and analysed for Fe concentrations by inductively coupled plasma atomic emission spectrometry. Rumen fluid collected on day 11 of each period was also analysed for VFA concentrations using the same procedure as described for Expt 1.
A ruminal data logger (Dascor LRCpH Loggers) was inserted at the beginning of the trial and used to measure rumen pH, temperature and redox potential (E h) every 15 min. Data from the last 4 d of each period were averaged over 2 h intervals. E h measures the ability of a solution to accept or donate electrons and corresponds to the potential difference (mV) between a platinum electrode and a standard hydrogen electrode. Since an Ag–AgCl reference electrode was used, measured values were corrected for the difference in potential between the Ag–AgCl reference electrode and the platinum electrode compared with the hydrogen electrode and the platinum electrode by adding 199 mV to the measured E h. Absolute reducing power (r H) was calculated by integrating both pH and E h values in Nernst's equation (r H= E h/30+2pH)( Reference Marounek, Roubal and Bartos 12 ).
Statistical analysis
Expts 1 and 2
Data were analysed using the Mixed procedure of SAS (SAS Institute, Inc.). Bottle was considered the experimental unit (n 6). Single df contrasts were used to test for linear, quadratic and cubic effects of Fe addition within the Fe source. To better compare the effects of the two sources of ferric Fe in their ability to decrease H2S, the change in H2S was fitted using the NLIN (non-linear regression) procedure of SAS to three non-linear curves (Michaelis–Menten, negative exponential and quadratic). The negative exponential model was found to have the smallest corrected Akaike's information criterion, and thus was determined to be the best fit for the data and was used to predict and compare the predicted percentage change in H2S from each source over a range of added Fe concentrations from 0 to 200 mg/l.
Expt 3
Data were analysed using the Mixed procedure of SAS (version 9.2; SAS Institute, Inc.) and the effects of period, animal and square were considered random for all models. The models for measures of intake, ruminal H2S and ruminal VFA included the fixed effect of treatment (n 8). Analysis of pH, E h and r H included the fixed effects of treatment, day, hour and their interactions, with hour as the repeated statement. The first-order antedependence structure (ante(1)) was selected as the covariance structure for the repeated model based on the lowest corrected Akaike's information criterion. The ruminal data logger for one steer malfunctioned and therefore data (pH, E h and r H) were not analysed (n 7). Single df contrasts were used to test for linear, quadratic and cubic effects of Fe addition. For all experiments, significance was declared at P< 0·05, with P≤ 0·10 considered a tendency.
Results
Expts 1 and 2
The addition of both ferric citrate and ferric ammonium citrate (Table 4) decreased (P< 0·01) the H2S concentration (Fig. 1) in the headspace of in vitro fermentation without affecting gas production (P= 0·38), fluid pH (P= 0·80), or DM disappearance (P= 0·38). When the negative exponential model was used to predict and compare the percentage change in H2S due to each source of Fe over the range of added Fe concentrations from 0 to 200 mg/l, the effect of the two sources did not differ (P>0·10) until added Fe concentration was 67 mg/l or greater. For added ferric Fe concentration greater than 66 mg/l, the decrease in H2S due to ferric ammonium citrate addition tended to be less (P< 0·10) than that of ferric citrate addition. At concentrations greater than 70 mg/l, the decrease in H2S was less (P< 0·05) for ferric ammonium citrate addition than for ferric citrate addition.
Table 4 Effects of ferric citrate or ferric ammonium citrate at various concentrations on the in vitro production of hydrogen sulphide (H2S, Expt 1) and in vitro DM digestibility (IVDMD), fluid pH and volatile fatty acid (VFA) concentrations (Expt 2) after 24 h incubation
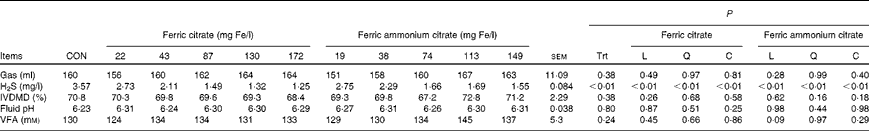
CON, control; Trt, treatment; L, linear effect; Q, quadratic effect; C, cubic effect.

Fig. 1 Observed (●, ferric citrate; ![]() , ferric ammonium citrate) and predicted (
, ferric ammonium citrate) and predicted (![]() , ferric citrate;
, ferric citrate; ![]() , ferric ammonium citrate) decrease in hydrogen sulphide (H2S) concentrations relative to the control treatment when ferric citrate (●) or ferric ammonium citrate (
, ferric ammonium citrate) decrease in hydrogen sulphide (H2S) concentrations relative to the control treatment when ferric citrate (●) or ferric ammonium citrate (![]() ) was added to in vitro incubations of buffered rumen fluid in Expt 1. Values are percentage changes, with their standard errors represented by vertical bars. The percentage change in H2S was predicted using negative exponential models for ferric citrate (Y= 67·6 ± 1·54 (1 − exp( − 0·021 ± 0·0014)x)) and ferric ammonium citrate (Y= 57·4 ± 2·04 (1 − exp( − 0·028 ± 0·0032)x)). The standard deviation of predicted change was 1·3 %.
) was added to in vitro incubations of buffered rumen fluid in Expt 1. Values are percentage changes, with their standard errors represented by vertical bars. The percentage change in H2S was predicted using negative exponential models for ferric citrate (Y= 67·6 ± 1·54 (1 − exp( − 0·021 ± 0·0014)x)) and ferric ammonium citrate (Y= 57·4 ± 2·04 (1 − exp( − 0·028 ± 0·0032)x)). The standard deviation of predicted change was 1·3 %.
The total VFA concentration was not affected by ferric Fe in vitro (P= 0·24; Table 5). However, the VFA profile was affected (P< 0·01) by these additives. The addition of ferric Fe from either source caused a linear increase in the proportion of acetate and a linear decrease in the proportion of propionate and butyrate (Fig. 2). Even at the highest inclusion concentrations, these changes in the VFA profile were less than 2 % (on a molar basis) different from the control.
Table 5 Effects of ferric iron* addition at varying concentrations to high sulphate feedlot diets on intake and ruminal parameters (Expt 3)
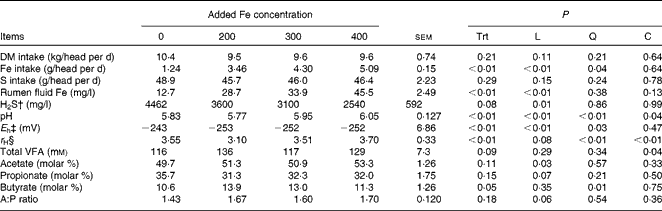
Trt, treatment; L, linear effect; Q, quadratic effect; C, cubic effect; VFA, volatile fatty acid; H2S, hydrogen sulphide; A:P, acetate:propionate.
* From ferric ammonium citrate.
† H2S in the gas cap of the rumen.
‡ Ruminal redox potential.
§ Hydrogen reducing power (Clark's exponent).
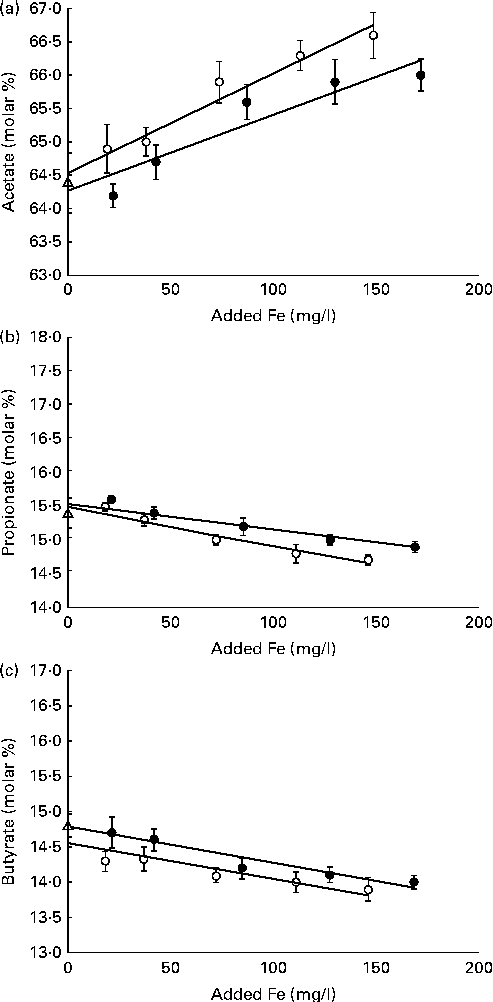
Fig. 2 Molar proportions of (a) acetate, (b) propionate and (c) butyrate in buffered rumen fluid after 24 h in vitro incubation with differing concentrations of added Fe from either ferric citrate (●) or ferric ammonium citrate (○), R 3= 0·34, Y= ( − 0·005 ± 0·0012), x= − 14·6 ± 0·10) in Expt 2. No added ferric iron (control; △). Values are molar percentages, with their standard errors represented by vertical bars. Ferric citrate: (a) linear (P< 0·01), R 3= 0·52, Y= (0·017 ± 0·0097), x= 64·8 ± 0·19; (b) linear (P< 0·01), R 3= 0·39, Y= ( − 0·004 ± 0·0008), x= − 15·6 ± 0·08; (c) linear (P< 0·01), R 3= 0·40, Y= ( − 0·005 ± 0·0001), x= − 14·8 ± 0·10. Ferric ammonium citrate: (a) linear (P< 0·01), R 3= 0·53, Y= (0·015 ± 0·0024), x= 64·8 ± 0·19; (b) linear (P< 0·01), R 3= 0·54, Y= ( − 0·006 ± 0·0008), x= − 15·5 ± 0·08; (c) linear (P< 0·01).
Expt 3
The inclusion of ferric ammonium citrate in the diet of steers did not affect DM intake (P= 0·21) or S intake (P= 0·29), but, per the experimental design, linearly (P< 0·01) increased Fe intake (Table 5). Initial rumen fluid Fe concentrations did not differ (P= 0·51) among the treatments (13·2 (sem 2·48) mg Fe/l), but Fe concentrations in rumen fluid taken on day 11 were linearly (P< 0·01) increased by increasing the inclusion of ferric ammonium citrate in the diet (Table 5).
For ruminal pH (P= 0·05), E h (P= 0·01) and r H (P= 0·06), there were interactions of Fe concentration × time (Fig. 3). These interactions were caused by the Fe200 treatment having a pH that was lower before feeding, but which did not drop to the same degree after feeding as the other treatments and a delay in the increase in E h (less redox) after feeding. Relative hydrogen reducing power is calculated from pH and E h and yields a hydrogen proton-unbiased measure of absolute reducing potential (eliminating the effects due to pH). The r H of the Fe200 treatment was lower (more reducing power; P< 0·05) than the other treatments during most of the day, but did not differ (P>0·10) from the Fe300 treatment between 14.00 and 18.00 hours (6–10 h post-feeding).

Fig. 3 Effects of Fe concentration and time of day on ruminal pH (P= 0·05; sem 0·133), redox potential (E
h; P= 0·01; sem 7·40) and relative hydrogen reducing power (r
H; P= 0·06; sem 0·338) of steers fed a high sulphate feedlot diet with 0 (![]() ), 200 (
), 200 (![]() ), 300 (
), 300 (![]() ) or 400 (
) or 400 (![]() ) mg/kg of iron from ferric ammonium citrate in Expt 3. Steers were fed at 08.00 hours.
) mg/kg of iron from ferric ammonium citrate in Expt 3. Steers were fed at 08.00 hours.
Overall, there was a cubic response (P= 0·04) for pH due to Fe concentration (Table 5) with the pH of the control and the Fe200 treatment not differing (P= 0·23), but the pH of the Fe300 and Fe400 treatments being greater (P< 0·01) than both the control and Fe200 treatments. The mean pH of the Fe400 treatment tended to be greater (P= 0·06) than the Fe300 treatment. There was also an effect (P< 0·01) of time of day on ruminal pH. For all the treatments, the ruminal pH was greatest (6·35) just before feeding at 08.00 hours and lowest (5·53) between 14.00 and 18.00 hours (6–10 h post-feeding). There was a significant quadratic effect of Fe concentration (P< 0·03) on E h. The control treatment had a greater E h (less redox potential; P< 0·01) than those treatments in which ferric iron was added (Fe200, Fe300 and Fe400). The level of ferric iron addition did not affect E h (P>0·20). There was an effect (P< 0·01) of time of day on E h. The redox potential peaked ( − 272) just before feeding (08.00 hours) and reached its nadir ( − 232) between 12.00 and 14.00 hours (4 and 6 h post-feeding). There was a cubic effect of Fe concentration (P< 0·01) on r H, with the Fe200 treatment being less (more reducing power; P< 0·01) than the control, Fe300 and Fe400 treatments. The r H of the control treatment did not differ (P≥ 0·11) from that of the Fe300 or Fe400 treatments; however, the r H of the Fe400 treatment was greater (less reducing power; P= 0·05) than that of the Fe300 treatment.
Concentrations of H2S in the ruminal gas cap were measured at 14.00 hours during the period of time in which ruminal fluid pH was low and conversion of sulphide to H2S should be high. There was a linear (P< 0·01) decrease in the concentration of H2S in the rumen gas as ferric Fe addition increased in vivo.
For total ruminal VFA concentrations, there was a cubic (P= 0·04) effect of the addition of ferric ammonium citrate (Table 5), where control and Fe300 are similar and Fe200 and Fe400 are similar but greater than control and Fe300. There was no significant difference (P≥ 0·14) in VFA concentrations among the treatments. The total VFA concentration of the Fe200 treatment was greater (P≤ 0·05) than the control and Fe300 treatments, but did not differ (P= 0·18) from the Fe400 treatment. Similar to the in vitro experiment, the proportion of acetate linearly increased (P= 0·03) and that of propionate tended (P= 0·07) to decrease with ferric Fe addition. However, for the proportion of butyrate, there was a quadratic (P= 0·01) response to increased inclusion of ferric ammonium citrate with butyrate being increased in the Fe200 treatment while the Fe300 treatment tended to be greater (P= 0·06) and the Fe400 treatment did not differ (P= 0·51) from the control.
Discussion
The expansion of the ethanol industry in the USA has increased the availability of co-products such as distillers grains (wet, modified or dry) and condensed distillers solubles for livestock feed, and has offered the cattle industry a tremendous opportunity to reduce feed costs without sacrificing performance. However, due to the potential for sulphate-induced PEM, the increased sulphate content has limited the inclusion of co-products in feedlot diets( Reference Erickson, Klopfenstein, Watson and Makkar 13 ).
Interspecies H2 transfer is a critical interaction among rumen microbes and links fermentative and dissimilatory metabolism. The fermentative microbes produce H2 and the dissimilatory reducers such as SRB and methanogens utilise H2. The removal of H2 promotes efficient fermentation, increasing feed digestion and microbial growth, all of which are beneficial to the ruminant. However, dissimilatory reduction of sulphate produces sulphide, which can lead to a build-up of the toxic H2S in the rumen. This H2S can then be eructated and inhaled, which can lead to sulphate-induced PEM( Reference Dougherty and Cook 14 , Reference Beauchamp, Bus and Popp 15 ).
Whereas sulphate undergoes microbial dissimilation to sulphide, which can become toxic H2S in the rumen, ferric Fe undergoes microbial dissimilation to its ferrous form, which is generally non-toxic. We hypothesised that addition of a soluble form of ferric Fe to the diet would decrease ruminal sulphate reduction by competing for the same electron donors and potentially transferring the activity of some ruminal SRB from sulphate reduction to Fe reduction. Although this was not tested directly, we did find that H2S concentrations of 24 h in vitro fermentation and in the rumen gas cap measured at 6 h post-feeding were decreased by the addition of ferric ammonium citrate. The formation of H2S from S2 − is a pH-dependent process, with pKa for ion dissociation of 11·96 and 7·04( Reference Beauchamp, Bus and Popp 15 ). At the concentrations of ferric Fe tested, pH was not affected by ferric Fe inclusion in vitro. Therefore, the proportion of sulphide present as H2S would have been similar across all treatments. In the in vivo study, the pH at the time of H2S sampling was 5·49, 5·51, 5·63 and 5·70 (SEM 0·128) for the control, Fe200, Fe300 and Fe400 treatments, respectively. This would have resulted in between 95 % for the control treatment and 93 % for the Fe400 treatment of the sulphide produced being reduced to H2S at the time of sampling (6 h post-feeding). Therefore, the difference in pH between the control and Fe400 treatments would have accounted for less than a 100 parts per million difference in H2S, so it seems unlikely that minor pH differences among the treatments contributed substantially to the large decrease in H2S observed with increasing ferric Fe inclusion. Therefore, we hypothesise that the decrease in ruminal H2S concentrations may have been because of a change in ruminal SRB metabolism (less reduction of sulphate to sulphide).
It has been suggested that electron acceptors with a greater redox potential will be reduced first( Reference Rasmussen, Anderson, Garland and Barr 16 ), and that micro-organisms that use the electron acceptor with the greatest redox potential will outcompete others that use the same electron donors and will deplete electron donors to lower threshold concentrations( Reference Lovley and Phillips 6 ). In anaerobic environments, such as marine sediments, aquifers and sewers, ferric Fe reduction has been shown to competitively inhibit sulphate reduction( Reference Lovley and Phillips 6 , Reference Chapelle and Lovley 7 ). In addition, diversion of electron flow to ferric Fe reduction by sulphate reducers has been suggested to be an important contributing factor in the inhibition of sulphate reduction in the presence of ferric Fe in sediments( Reference Coleman, Hedrick and Lovely 17 ). Studies have suggested that some Desulfovibrio spp. can carry out ferric Fe reduction( Reference Lovely 18 ), and this genera is thought to be the main sulphate reducer in the rumen( Reference Cummings, Caldwell and Gould 19 ).
Ferric Fe is a relatively high-energy electron acceptor, but its reduction is restricted by its solubility. The form of ferric Fe has been shown to be important for the ability of ferric Fe reduction to compete with sulphate reduction( Reference Lovley and Phillips 6 ). Most forms of ferric Fe are relatively insoluble; however, chelation to citrate dramatically increases its solubility. In other studies from our laboratory, addition of ferric oxide (a very insoluble form of ferric Fe) and ferric sulphate (Fe2(SO4)3·H2O; only slightly soluble in water) had no effect on H2S in vitro. However, ferric chloride (FeCl3·6H2O; considered to be highly soluble) was found to decrease H2S at both 50 and 150 mg/l of Fe in vitro, though it was not as effective as ferric citrate (ME Drewnoski, P Doane and SL Hansen, unpublished results). It is also important to note than when sodium citrate (Na3C6H5O7·2H2O) was tested, it had no effect on H2S concentrations, suggesting that the difference between ferric chloride and ferric citrate was not due to citrate (ME Drewnoski, P Doane and SL Hansen, unpublished results).
The product of ferric Fe reduction may have also played a role in the observed decreased in ruminal H2S concentrations. Once reduced, the ferric Fe would be in the ferrous form, possibly providing the additional benefit of binding with some of the sulphide that was produced by sulphate reduction, thus further decreasing the amount of sulphide in the rumen fluid that would be available for conversion to H 2 S. Although sulphide concentrations in rumen fluid were not measured in the present study, it was evident that some ferrous sulphide was being formed, as the fluid of in vitro bottles with added ferric Fe were black after 24 h incubation with ferric Fe and the manure of the steers fed the treatments with added ferric Fe had blackened manure. Interestingly, in vitro incubations of ferrous chloride did not cause the colour of the fluid to change and was much less effective at decreasing H2S concentrations (ME Drewnoski, P Doane and SL Hansen, unpublished results) than ferric chloride.
When the effect of ferric citrate and ferric ammonium citrate were compared in their ability to decrease H2S in vitro, it was found that at concentrations of Fe in the fluid above 70 mg/l, ferric ammonium citrate was less effective than ferric citrate. This may have been because of the light-sensitive nature of ferric ammonium citrate. Ferric ammonium citrate can be reduced to a ferrous salt by light. Even though ferric citrate was more effective than ferric ammonium citrate in vitro, we chose to use ferric ammonium citrate in the in vivo trial because it was already accepted as a ‘generally recognized as safe’ chemical by the American Food and Drug Administration.
The idea of using a compound to reduce the incidence of sulphate-induced PEM by decreasing the amount of sulphide produced by SRB in the rumen is not a new one. Mo has been shown to inhibit SRB in many environments, including rumen fluid( Reference Kung, Bracht and Tavares 5 , Reference Gawthorne and Nader 20 ). Kung et al. ( Reference Kung, Bracht and Tavares 5 ) showed that the addition of 10 mg/l of Mo to the rumen fluid decreased H2S by 11 % and 25 mg/l decreased H2S by 77 %. However, 10 mg/l of Mo in the rumen fluid would require a Mo concentration in the diet of approximately 45 mg/kg (assuming a 550 kg steer, 45 litres of rumen liquid and an intake at 2 % of body weight). Mo can bind to Cu in the rumen causing the formation of an insoluble complex, thereby reducing the availability of Cu to the animal, and thus causing the potential for Cu deficiency. Researchers who attempt to experimentally induce Cu deficiency in ruminants often supplement between 2 and 5 mg/kg of Mo in the diet. Thus, the maximum tolerable concentration of Mo in Cu-adequate cattle has been suggested to be 5–10 mg Mo/kg diet( 21 ), values far below the needed 45 mg/kg diet to achieve significant decreases in rumen H2S.
Kung et al. ( Reference Kung, Bracht and Tavares 5 ) found that the experimental compound, 9,10–anthraquinone, was an inhibitor of sulphide production. The addition of anthraquinone at 10 mg/l (in the rumen fluid) inhibited sulphate reduction by 71 %. It is thought that 9,10-anthraquinone inhibited sulphide production by uncoupling the electron transport chain, thus decreasing concentrations of ATP resulting in insufficient energy for the activation of sulphate needed for sulphate reduction( Reference Cooling, Maloney and Nagel 22 ). However, to the authors' knowledge, follow-up studies to test the effects in vivo were not conducted. This is probably due to the availability and cost of the compound, as it would require inclusion of 9,10-anthraquinone at approximately 41 mg/kg in the diet (assuming a 550 kg steer, 45 litres of rumen liquid and an intake at 2 % of body weight) to achieve 10 mg/l of 9,10-anthraquinone in the rumen fluid.
In the present study, addition of ferric citrate or ferric ammonium citrate in vitro did not affect DM digestibility or total VFA concentration (although VFA concentrations were numerically higher when ferric ammonium citrate was added). When tested in vivo, inclusion of ferric ammonium citrate at a concentration of 200 mg Fe/kg increased total VFA concentrations, but had no effect at the concentrations of 300 and 400 mg/kg of Fe. However, increasing concentrations of ferric Fe increased the molar proportion of acetate and decreased the proportion of propionate both in vitro and in vivo. From a cattle efficiency standpoint, an increase in the acetate:propionate ratio would be considered negative. However, it should be noted that decreases in the acetate:propionate ratio have been observed when dietary sulphate is increased( Reference Drewnoski, Richter and Hansen 10 , Reference Thompson, Wise and Harvey 23 , Reference Zinn, Alvarez and Mendez 24 ). Thus, the change in the acetate:propionate ratio that was caused by ferric Fe inclusion may be a reversing of the effects of increased sulphate in the diet.
Fe can have negative effects on the absorption of other trace minerals such as Cu, Mn and Zn. The maximum tolerable concentration of dietary Fe in cattle has been suggested to be 500 mg/kg( 21 ). This concentration has been recommended because this concentration of Fe has been shown to negatively affect the Cu status of animals( Reference Bremner, Humphries and Phillippo 25 , Reference Phillippo, Humphries and Garthwaite 26 ). Studies have shown that ferric citrate appears to have less negative effects on trace mineral status than other sources of Fe( Reference Koong, Wise and Barrick 27 , Reference Standish and Ammerman 28 ). Koong et al. ( Reference Koong, Wise and Barrick 27 ) also found that growth of calves fed ferric citrate in low-sulphate diets did not decrease when added at a concentration of 1000 mg Fe/kg. Although all diets in this study contained 500 mg/kg of total Fe or less, longer-term studies are needed to determine the impact of feeding 300–400 mg/kg of ferric Fe in high-sulphate diets on trace mineral status.
In conclusion, inclusion of ferric citrate in high-sulphate feedlot cattle diets appears to be an effective way to decrease ruminal concentrations of H2S, and thus could reduce the potential for sulphate toxicosis. Therefore, longer-term studies on the effect of feeding ferric Fe in high-sulphate diets on mineral status, feed efficiency and the growth of cattle are warranted.
Acknowledgements
The authors are grateful to Philip Dixon, Professor of Statistics at Iowa State University (Ames, IA, USA) for his assistance with statistical modelling of the data.
Funding for the present study was provided by ADM Alliance Nutrition (Quincy, IL, USA). ADM also provided input during the experiment planning process and through P. Doane assisted in the editing of the manuscript.
The authors' contributions are as follows: all authors contributed to the experimental design and editing of the manuscript; M. E. D. conducted the experiments, analysed the data and wrote the manuscript; S. L. H. assisted with the experiments, analysis of the data and writing of the manuscript.
M. E. D. and S. L. H. declare no conflict of interest. P. D. works for ADM Research.


