


Introduction
In Colombia, South America, demographic, economic and epidemiological transitions have been accompanied by two other simultaneous transitions(Reference Flórez1): (1) nutritional, where overweight is more prevalent than obesity(Reference Kasper, Herrán and Villamor2), and (2) alimentary(Reference Herrán, Patiño and DelCastillo3), where the traditional dietary pattern may be a protective factor against developing overweight and obesity, which are mediators of cardiovascular disease and cancer(Reference Herrán, Patiño and DelCastillo3–Reference Herrán, Álvarez and Quintero-Lesmes5).
Given the limited or non-existent scientific evidence at the local level in Colombia, public policies on food insecurity, nutritional deficiencies and nutritional and dietary status have followed approaches used in other cultural and socio-economic contexts. In the general population, individual dietary practices stem from a combination of various aspects that involve the context in which people live, such as personal or individual factors, as well as external factors in the food environment, including physical, economic, sociocultural and political(Reference Turner, Kalamatianou and Drewnowski6). The explanations of these practices have lacked epidemiological thought, for example, multicausality.
Overweight in Colombian adults rose from 45⋅9 % in 2005 to 51⋅2 % in 2010 and 56⋅5 % in 2015, while obesity increased from 13⋅7 to 16⋅5 % and 18⋅7 % over the same period(7). Nevertheless, adherence to physical activity recommendations also increased, from 19⋅9 % in 2010 to 23⋅5 % in 2015(7), while the frequency of snack consumption decreased 9⋅9 % for children and 13⋅3 % for adults between 2010 and 2015(Reference Herrán, Villamor and Quintero-Lesmes8).
Food and nutrition policies impact the environment, the economy and other public policies; one example is a recommendation to update the Dietary Guidelines for Americans(Reference Blackstone, El-Abbadi and McCabe9). Both the amount and quality of protein consumption have been of interest due to their association with serum iron levels, cholesterol, saturated fat, the development of chronic illness, and more recently, with the carbon footprint. The impact that diet has on different environments (economic, social, cultural, industrial and technological, among others) is a complex issue and a new field of formal research. The United States Department of Agriculture proposes six categories that have an environmental impact and political importance: (1) global warming potential, (2) land use, (3) water depletion, (4) marine eutrophication, (5) availability of potable water and (6) respiratory particulate or organic material(Reference Blackstone, El-Abbadi and McCabe9).
In terms of the Americas, 24-h dietary recall questionnaires (24HR) have been used to estimate dietary intake in Canada (2004), Colombia (2005, 2015), Argentina (2005), Peru (2006), Mexico (2006, 2012) and the United States (1999–2016). While no significant changes in energy and protein intake were found between survey years in Mexico(Reference Gaona-Pineda, Mejía-Rodríguez and Cuevas-Nasu10,Reference De la Cruz-Góngora, Martínez-Tapia and Cuevas-Nasu11) , an increase was found in the U.S(Reference Shan, Rehm and Rogers12).
In Colombia, the 2005 ENSIN(13) and the Energy and Nutrients Intake Recommendations (RIEN in Spanish)(14) indicate a deficiency of 36–50⋅1 % in usual protein intake. Colombia updated the RIEN in 2016 based on the epidemiological and nutritional profile of the Colombia population. This guideline sets an acceptable macronutrient distribution range (AMDR) of 10–20 % for protein for the different population groups and suggests a minimum of 15 % in order to meet the average estimated micronutrient requirement(14).
The present study was aimed at determining (1) the differences between current weight v. ideal weight, (2) total energy intake and comparing it with required energy (Rkeer), (3) absolute protein intake in g/kg per d and g/1000 calories, (4) how energy and protein intake relate to the nutritional status of the subjects in terms of overall overweight (OEW) [overweight + obesity] and conservative overweight (CEW) [obesity] and (5) the contribution (%) of protein to total energy intake based on the AMDR.
Materials and methods
Colombia (South America) is a middle-income country with large socio-economic inequalities. Three national nutrition surveys (ENSIN in Spanish [Encuestas Nacionales de la Situación Nutricional]) were conducted between 2005 and 2015 using a cross-sectional design. The analysis was based on data on energy (kcal/d) and protein (g/d) intake obtained from a 24HR conducted as part of the 2015 ENSIN, which was a nationally representative survey with a complex and multistage sample design. The methodological details have previously been published(Reference Minsalud15).
Population and sample
The 2015 ENSIN surveyed 44 202 urban and rural households and interviewed 151 343 subjects. The sample included 4739 segments located in 295 municipalities in the country's 32 departments and in Bogota, Colombia's capital. Various probabilistic subsamples were calculated to study specific topics, including nutrient intake, nutritional practices of interest and breast-feeding, among others. The 2015 ENSIN sample was based on the Master Household Sample for Health Studies, of the National System of Health Population Studies and Surveys, developed and implemented in 2013 by the Ministry of Health and Social Protection (7). Subjects were selected with various sampling methods, including probability, cluster, stratified and multistage. The primary sampling unit was the department, the secondary was the municipalities and the tertiary was the housing of the subjects. The subsample that constituted the 24HR included 34 099 subjects between 0 and 64 years old, 4589 of whom filled out a second 24HR. Excluded from the 34 099 were children between 0 and 1 year of age (n 1770), pregnant women (n 2589) and those without data on weight, height or both (n 481). The 24HR response rate was 84 %. The final sample that was analysed included 29 259 subjects.
Source of data
Trained personnel administered the questionnaire to heads of household to obtain information on sociodemographics, food security and household wealth. Moreover, nutritionists administered the 24HR using the Automated Multiple-Pass Method (AMPM) developed in 1999 by the United States Department of Agriculture (USDA)(Reference Minsalud15,Reference Blanton, Moshfegh and Baer16) . For children under 12 years old, consumption information was supplied by the person who was responsible for having prepared and served their food the previous day and/or who accompanied the child while eating. For adolescents between 12 and 14 years old and adults 60 years or older, a rapid memory test was conducted before administering the 24HR, which included 4 of the 10 items proposed by Hodkinson in 1972 to identify dementia in elderly patients(Reference Hodkinson17). When one of the four questions was not adequately answered by the subject, the information was provided by the caregiver or the person responsible for feeding the child. Anthropometric measurements were taken by trained interviewers using standardised techniques and calibrated equipment. Size was determined with stadiometers (Shorr Productions LCC, Olney, MD, USA) to the nearest millimetre. SECA scales (model 874) were used to determine weight to the nearest 100 g.
The main outcome variables were OEW, CEW and energy (kcal/d) and protein (g/d) intake. Eleven covariables were also studied: sex, age, weight circumference, adherence to weekly physical activity goals, number of household members, household food security, wealth index, educational level of the head of household, ethnicity, degree of urbanism and geographic region.
Nutritional status
Values for weight, size and sex were converted to Z scores based on growth references by the World Health Organization (WHO)(Reference Hodkinson17,Reference De Onis and Lobstein18) . For children up to 17 years old, OEW was based on body mass index for age (BMI/A) and Z-score >1, and CEW was based on Z-score >2. For adults, overweight was defined as ≥25 BMI <30 (kg/mt2), obesity as BMI ≥30, OEW = overweight + obesity and CEW = obesity. In addition, for each individual with low or excess weight, the 2015 ENSIN estimated ‘adequate weight’ based on its own data using two predictive equations (linear regressions): one for subjects between 1 and 17 years old and another for those between 18 and 64 years old. The equations included data on the sex, weight, size and age of the individuals with normal nutritional status for the age group(19).
Energy and protein intake
After rigorous quality control, the 24HR were converted to nutrients based on a food composition database specifically designed for the 2015 ENSIN. This database contains 2703 items and 9 nutritional variables. In addition, following recommendations by the 2001 FAO/WHO/UNU Expert Consultation(20), the Estimated Energy Requirement (EER) was calculated for each individual based on RIEN(14). Energy (kcal/d) and protein (g/d) intake were reported in absolute terms based on the first 24HR. Protein intake was reported as nutrient density in grams per 1000 calories (g/1000) and as the ratio of absolute protein intake/day (g/d) to adequate weight (Rprotein). Lastly, the ratio of absolute kcal intake/day to EER was calculated and expressed as requirement units (Rkeer) or adequacy (%EER).
Adherence to weekly physical activity goals
The 2015 ENSIN calculated this potential confounder based on minimum adherence per week, using different methods for different age groups(Reference Minsalud15). For children under 6 years old, adherence was defined as 180 min or more of play per day over the prior 7 d, according to C-MAFYCS(Reference Camargo and Orozco21,Reference Camargo, Santisteban and Paredes22) . For adolescents between 6 and 17 years old, adherence to physical activity recommendations was defined as 60 or more min/d of moderate or vigorous physical activity, according to the Youth Risk Behavior Surveillance System(23). Adherence for adults was defined as at least 150 min of moderate or 75 min of vigorous aerobic physical activity/week, according to the International Physical Activity Questionnaire (IPAQ) developed by the WHO(Reference Craig, Marshall and Sjöström24).
Large waist circumference was defined as ≥90 cm for men and ≥80 cm for women. The degree of urbanism was categorised as urban and rural based on the population density reported by the 2015 ENSIN(Reference Minsalud15). Household food security was determined with the Latin American and Caribbean Food Security Scale (ELCSA in Spanish)(25). Wealth level was designated based on the index designed for the international demographics and health survey(Reference Rutstein26), with the highest values representing the wealthiest subjects.
Statistical analysis
All analyses were performed using the routines for complex sampling designs in Stata software version 14.1(27). The statistical analysis was aimed at (1) describing socio-demographic characteristics, (2) for each category of covariates, describing the energy and protein intake of the subjects with prevalences (%) or averages, and presenting each one with its standard error (se) or 95 % confidence interval (95 % CI), (3) determining the prevalence ratio of protein intake to adequate weight (g/kg per d) in subjects with and without excess weight and (4) determining the average prevalence ratio of energy intake to energy required in subjects with and without excess weight.
Multiple linear regressions were performed to obtain adjusted differences in protein and energy intake between subjects with and without excess weight, and with and without conservative excess weight, with their different expressions for each category of covariates. To this end, a new term was created with the result of the cross product of intake and each category of covariates (interaction). The adjusted differences and their respective 95 % CIs incorporated the complex sample design, and the multiple regression model included the covariates sex, age, adherence to physical activity, household size, household food insecurity, wealth index, ethnicity, education level of head of household, geographic area and region.
Ethics approval and consent to participate
All analyses were performed in accordance with the principles of the Helsinki Declaration(28). The databases used are available to the public. This research is classified as ‘without risk’ according to Resolution 8430 of the Colombian Ministry of Health (1993)(29). Since this is a secondary analysis of population studies with anonymised data, no authorisation was required from the Health Research Ethics Committee of the Industrial University of Santander.
Results
A total of 29 259 subjects were studied, 48⋅8 % of which were men. The OEW of the population was 28⋅7 %: 27⋅6 % for men and 30⋅0 % for women (P = 0⋅123). Nine percent (9⋅0 %) of the population had CEW: 8⋅7 % of men and 9⋅2 % of women (P = 0⋅506). A total of 25⋅8 % of subjects met the physical activity recommendations, 37⋅5 % of households were food secure and 77⋅3 % of subjects lived in urban regions. Table 1 presents the remaining socio-demographic characteristics of the subjects studied, according to excess weight categories.
Table 1. Characteristics of the population studied
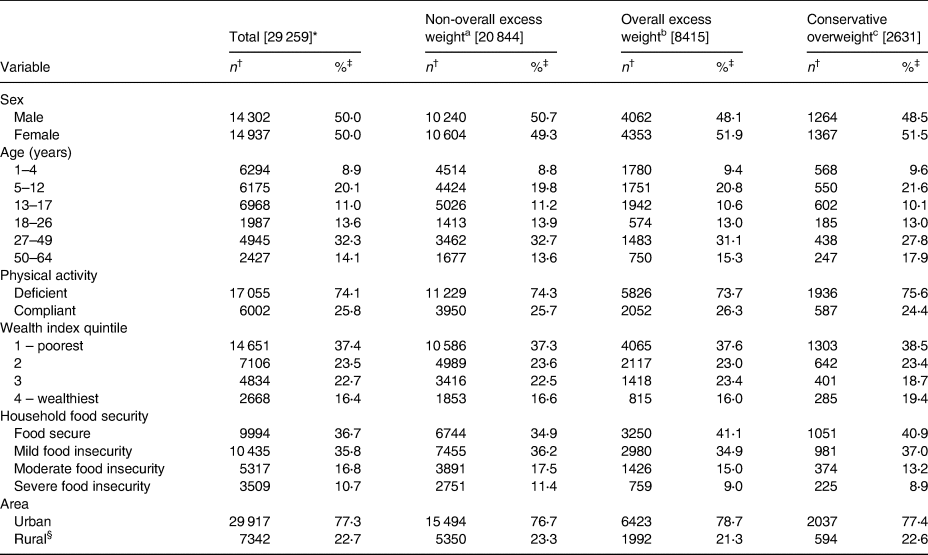
a Non-overall excess weight: In children and adolescents based on Z ≤ +1, in adults <25 (kg/m2).
b Overall excess weight: In children and adolescents based on Z > +1, in adults ≥25 (kg/m2).
c Conservative overweight: In children and adolescents based on Z > +2, in adults ≥30 (kg/m2).
* [N].
† n may be less than [N] due to missing values.
‡ Since percentages have incorporated the complex design of the sample, they may not coincide with those calculated based on absolute values.
§ The rural category included suburban population centres close to small cities, towns in rural areas distant from small towns and places dispersed or very distant from rural towns.
Adequate and current weight
The average adequate weight was 13⋅6 kg (95 % CI 13⋅0, 14⋅2) in the 1–4-year-old group, 26 kg (95 % CI 23⋅5, 28⋅5) in the 5–12-year-old group, 50⋅6 kg (95 % CI 49⋅2, 52⋅0) in the 13–17-year-old group, 59⋅1 kg (95 % CI 58⋅4, 59⋅8) in the 18–26-year-old group, 59⋅8 kg (95 % CI 58⋅8, 60⋅7) in the 27–49-year-old group and 58⋅0 (95 % CI 56⋅7, 59⋅3) in the 50–64-year-old group (P < 0⋅0001). The mean differences between current and adequate weight were 0⋅5 kg (95 % CI −1⋅8, 2⋅9) in the 1–4-year-old group, 1⋅8 (−5⋅9, 9⋅6) in the 5–12-year-old group, 2⋅2 kg (95 % CI −11⋅7, 16⋅1) in the 13–17-year-old group, 4⋅5 kg (95 % CI −15⋅5, 24⋅4) in the 18–26-year-old group, 10⋅4 kg (95 % CI −14⋅6, 35⋅3) in the 27–49-year-old group and 11⋅3 kg (95 % CI −12⋅1, 34⋅7) in the 50–64-year-old group (linear trend test; P < 0⋅0001). Excess weight began during the first 4 years, after which the prevalence decreased in relative terms, while excess weight v. adequate weight remained stable (Fig. 1).

Fig. 1. Adequate weight and current weight according to age (Colombia, 2015).
EER and absolute energy intake
For men, EER was 2146 kcal/d (95 % CI 1985, 2308) and average intake was 2117 kcal/d (95 % CI 1969, 2264). For women, EER was 1796 kcal/d (95 % CI 1760, 1832) and intake was 1818 kcal/d (95 % CI 1740, 1896). EER and average intake by age group were as follows: EER of 1100 kcal/d (95 % CI 1075, 1126) and average intake of 1614 kcal/d (95 % CI 1320, 1908) for the 1–4-year-old age group; EER of 1533 kcal/d (95 % CI 1421, 1645) and average intake of 1787 kcal/d (95 % CI 1573, 2003) for the 5–12-year-old age group; EER of 2285 kcal/d (95 % CI 2214, 2357) and intake of 2367 kcal/d (95 % CI 2235, 2500) for the 13–17-year-old age group; EER of 2339 kcal/d (95 % CI 2295, 2382) and intake of 2305 kcal/d (95 % CI 2195, 2416) for the 18–26-year-old age group; EER of 2194 kcal/d (95 % CI 2149, 2239) and intake of 2001 kcal/d (95 % CI 1925, 2077) for the 27–49-year-old age group and EER of 2087 kcal/d (95 % CI 2050, 2125) and average intake of 1797 kcal/d (95 % CI 1731, 1862) for the 50–64-year-old age group. Supplementary Tables S1 and S2 of Supplementary material present absolute energy intake and adjusted differences for the categories of the covariables studied, according to excess weight categories.
Relative energy consumption (ratio of (kcal/d)/EER ± se − Rkeer)
With regard to the categories of the covariables studied, children from 1 to 4 years old with CEW had the highest Rkeer (1⋅55 ± 0⋅16) and adults between 50 and 64 years old without CEW had the lowest (0⋅86 ± 0⋅83). Ethnicity was the only variable that presented statistically significant differences among subjects with excess weight. Supplementary Tables S3 and S4 of Supplementary material show these ratios according to the categories of the covariables studied.
Protein intake in grams per 1000 kcal (g/1000)
Average protein intake was 33⋅1 g/1000 (95 % CI 31⋅9, 34⋅2) for men and 33⋅4 g/1000 (95 % CI 32⋅7, 34⋅1) for women (P = 0⋅668). Average protein intake was 32⋅7 g/1000 (95 % CI 31⋅8, 36⋅6) for the 1–4-year-old group, 31⋅8 g/1000 (95 % CI 30⋅8, 32⋅8) for the 5–12-year-old group, 32⋅0 g/1000 (95 % CI 30⋅2, 33⋅8) for the 13–17-year-old group, 32⋅8 g/1000 (95 % CI 32⋅0, 34⋅0) for the 18–26-year-old group, 34⋅5 g/1000 (95 % CI 32⋅8, 36⋅2) for the 27–49-year-old group and 34⋅0 g/1000 (95 % CI 32⋅6, 35⋅5) for the 50–64-year-old group (P = 0⋅002). No differences were found among the categories of the covariables studied when comparing protein intake (g/1000) for subjects with and without OEW. For 18–26-year olds and black subjects, statistically significant differences in protein intake (g/1000) were found when comparing subjects with and without CEW. Supplementary Tables S5 and S6 of Supplementary material present these differences.
Protein intake in grams per kilogram of adequate weight (g/kg per d − Rprotein)
Average intake was 1⋅69 g/kg per d (95 % CI 1⋅58, 1⋅79) for men and 1⋅59 g/kg per d (95 % CI 1⋅40, 1⋅78) for women (P = 0⋅383), 3⋅85 g/kg per d (95 % CI 3⋅46, 4⋅24) for children between 1 and 4 years of age, 2⋅25 g/kg per d (95 % CI 2⋅11, 2⋅40) for children between 5 and 12 years of age, 1⋅53 g/kg per d (95 % CI 1⋅33, 1⋅74) for adolescents between 13 and 17 years of age, 1⋅26 g/kg per d (95 % CI 1⋅21, 1⋅31) for adults between 18 and 26 years of age, 1⋅12 g/kg per d (95 % CI 1⋅08, 1⋅17) for adults between 27 and 49 years of age and 1⋅04 g/kg per d (95 % CI 0⋅98, 1⋅10) for adults between 50 and 64 years of age (P < 0⋅0001). Children with OEW had the highest Rprotein intake (average 3⋅94, ±0⋅25 sd). Fig. 2 summarises the findings on energy and protein intake, by age group. Tables 2 and 3 summarize the findings of protein intake (g/kg per d) regarding nutritional status.

Fig. 2. Trends in calorie and protein intake by age; the ratio between energy consumed and required; grams of protein per kilogram of adequate weight (g/kg per d) (Colombia, 2015).
Table 2. Adjusted difference in the ratio between protein intake and adequate weight (g/kg per d), between overall excess weighta and non-overall excess weightb for subjects in the Colombian population, 2015

a Overall excess weight: In children and adolescents based on Z > +1, in adults ≥25 (kg/m2).
b Non-overall excess weight: In children and adolescents based on Z ≤ +1, in adults <25 (kg/m2).
* Overall excess weight n may be less than 8415 for missing values. Non-overall excess weight n may be less than 20 844 for missing values.
† Adjusted difference and 95 % confidence intervals calculated with a linear regression model based on intake/day of kilocalories as the dependent variable and predictors that included indicator variables for each socio-demographic correlate, Non-overall excess weight (Overall excess weight) and cross-product (interaction) terms between overweight and indicator variables of the correlate. In addition, the linear regression model was adjusted by the following covariables: sex, age, physical activity, household size, food security, wealth index, ethnicity, education of the head of household, area and region. The complex sampling survey design was used in all multivariate regression models.
‡ In men ≥ 90 cm, in women ≥ 80 cm.
§ The rural category included suburban population centres close to small cities, towns in rural areas distant from small towns and places dispersed or very distant from rural towns.
Table 3. Adjusted difference in the ratio between protein intake and adequate weight (g/kg per d), between conservative overweighta and non-conservative overweightb for subjects in the Colombian population, 2015

a Conservative overweight: In children and adolescents based on Z > +2, in adults ≥30 (kg/m2).
b Non-conservative overweight: In children and adolescents based on Z ≤ +2, in adults <30 (kg/m2).
* Conservative overweight n may be less than 2631 for missing values. Non-conservative overweight n may be less than 26 628 for missing values.
† Adjusted difference and 95 % confidence intervals calculated with a linear regression model based on consumption/day of kilocalories as a dependent variable and predictors that include indicator variables for each socio-demographic correlate, Non-conservative overweight (Conservative overweight) and cross-product (interaction) terms between obese and indicator variables of the correlate. In addition, the linear regression model was adjusted by the following covariables: sex, age, physical activity, household size, food security, wealth index, ethnicity, education of the head, area and region. The complex sampling survey design was used in all multivariate regression models.
‡ In men ≥ 90 cm, in women ≥ 80 cm.
§ The rural category included suburban population centres close to small cities, towns in rural areas distant from small towns and places dispersed or very distant from rural towns.
Relative contribution of protein to total energy, AMDR (%)
Proteins made up 13⋅27 % (95 % CI 12⋅88, 13⋅66) of the total energy consumed by men and 13⋅31 % (95 % CI 13⋅06, 13⋅56) of the total consumed by women (P = 0⋅834). The contribution of protein to total energy intake was 13⋅07 % (95 % CI 12⋅72, 13⋅43) for the 1–4-year-old age group, 12⋅71 % (95 % CI 12⋅30, 13⋅11) for the 5–12-year-old age group, 12⋅82 % (95 % CI 12⋅09, 13⋅54) for the 13–17-year-old age group, 13⋅13 % (95 % CI 12⋅78, 13⋅47) for the 18–26-year-old age group, 13⋅79 % (95 % CI 13⋅11, 14⋅46) for the 27–49-year-old age group and 13⋅61 % (95 % CI 13⋅05, 14⋅18) for the 50–64-year-old age group. Supplementary Fig. S1 of Supplementary material presents the AMDR of protein (%) to total energy intake.
Discussion
This work found that excess weight in the Colombian population is detectable by the age of 4 years, which may suggest that the excessive energy and protein consumption described herein may be the causal pathway to excess weight and obesity at an early age. Once excess weight begins, it increases steadily until age 40, and although it decreases after age 40, there continues to be a gap between adequate and current weight (Fig. 1). With regard to current mean energy and protein intake, no significant differences were found between subjects with and without OEW and CEW, with the exception of ethnicity. In general, the Rkeer was found to fall within the suggested range of 90–110 %, except for children between 1 and 4 years old (144 and 155 %). Given the low level of physical activity on the part of the Colombian population(7), if a range of 0⋅8–1⋅2 g/kg per d is considered adequate protein consumption regardless of the nutritional condition of the subjects(Reference Wu30), then the population consumes more protein than the limit. Nevertheless, long-term protein consumption of up to 2⋅0 g/kg per d has been considered to be safe(Reference Wu30), and protein intake has been considered inadequate when the relative protein contribution is under the RIEN(14) recommendation of 15 %.
The prevalence of overweight and obesity among Colombian adults was greater for women than for men: 8 and 6⋅8 %, respectively(7). Since overweight, obesity, OEW and CEW cannot be attributed to the prior day's energy or macronutrient intake, as expected, absolute and relative energy and protein intake did not differ according to the nutritional condition of these subjects. Excess weight is a long-term condition that is related only to usual intake and not to current intake based on a single 24HR(Reference Tucker31).
Proteins are one of the most commonly studied macronutrients. They are required for growth and development, and for the synthesis of essential amino acids(Reference Wu30). The U.S. National Academy of Medicine (formerly the Institute of Medicine [IOM]) established the estimated average requirement (EAR) and recommended dietary requirement (RDA) in grams per kilograms per day (g/kg per d) (EAR of 0⋅66 g/kg per d and RDA of 0⋅80 g/kg per d)(32), while RIEN established the relative contribution of protein to total energy intake, with a relative contribution between 10 and 20 % (equivalent to 45 g/d for children between 2 and 5 years of age and up to 103 g/d for subjects between 14 and 17 years old)(14). In all cases studied herein, the estimates exceeded both IOM and RIEN recommendations and were similar to those reported by the 2003–2004 National Health and Nutrition Examination Survey (NHANES): average of 56 g/d ± 14 sd for children and adolescents, 91 ± 22 g/d for subjects between 19 and 30 years of age, 86 g/d ± 20 sd for adults for adults between 30 and 50 years and 66 ± 17 g/d for adults over 50 years old(Reference Fulgoni33). NHANES reported that between 1999 and 2016, the AMDR for total proteins (both animal and vegetable) increased from 15⋅5 to 16⋅4 % in the U.S. population over 20 years of age(Reference Shan, Rehm and Rogers12). Furthermore, protein intake in 2003–6 did not differ significantly from protein intake in 2015–16(Reference Hoy, Clemens and Moshfegh34).
Excess protein intake has been associated with increased mortality from cardiovascular disease, with a hazard ratio of 1⋅08 per 10 % increase in energy consumption (95 % CI 1⋅01, 1⋅16; P = 0⋅04 for the trend). This was found among those who had at least one risk factor associated with smoking, heavy alcohol consumption, overweight, obesity or sedentarism(Reference Song, Fung and Hu35,Reference Willett36) . In a cohort study of Swedish women between 30 and 49 years old with a 16-year follow-up, regular consumption of high-protein, low-carbohydrate diets was associated with a greater risk of cardiovascular disease, with an incidence rate of 1⋅05 (95 % CI 1⋅02, 1⋅08)(Reference Pagona, Sven and Marie37). A case–control study of the Korean population between 30 and 76 years old reported an inverse association, though not statistically significant, between vegetable protein intake and the prevalence of colorectal adenoma, after adjusting for age, total energy intake, waist circumference, BMI, HDL-cholesterol, fasting glucose, alcohol intake and smoking. Nevertheless, when adjusted by potential confounders, that association was not significant (OR 0⋅54 [95 % CI 0⋅27, 1⋅11]; P = 0⋅13 for the trend)(Reference Yang, Kim and Lee38). With regard to the risk of type 2 diabetes mellitus, a cohort study of the population in China between 20 and 74 years old found that, over the long term, diets low in carbohydrates, high in fats and high in proteins were associated with a higher risk of type 2 diabetes for subjects who consumed excess calories (RR 1⋅64 [95 % CI 1⋅03, 2⋅61]; P = 0⋅040 for the trend)(Reference Shan, Duan and Liu39). A cohort study with an Iranian population over 20 years old found that the risk of incidence of chronic kidney disease increased with an increase in high-protein, low-carbohydrate diets (OR 1⋅48 [95 % CI 1⋅03, 2⋅15]; P = 0⋅027 for the trend)(Reference Farhadnejad, Asghari and Emamat40). Excess protein consumption of over 0⋅8 g/kg per d increased intraglomerular pressure and complications from chronic kidney disease(Reference Ko G, Obi and Tortorici41). Lastly, the EAT–Lancet Commission has presented robust evidence of the health and environmental consequences from consuming over 0⋅8 g/kg per d of protein, or ≥10 % of the AMDR, predominantly from animal sources. The commission reported health consequences such as an association with overall mortality from cancer, cardiovascular disease and type 2 diabetes, and an environmental impact on the production of greenhouse gases (methane, nitrous oxide and carbon dioxide) from food production(Reference Willett, Johan Rockström and Brent Loken42).
Public policy implications
The development of the science of nutrition cannot be understood without the institutions and policies that are associated with them(Reference Reich and Balarajan43). In this case, energy and protein intake is not an isolated event that occurs outside the socio-economic and cultural context of the subjects. Furthermore, public policy can provide proper guidance on multiple levels(Reference Reich and Balarajan43). The evidence presented herein, based on data on protein and energy intake from the 2015 ENSIN, will help institutions that are responsible for improving diets and nutrition(14) to not only review and modify nutritional goals but also sustain them, as suggested by the Dietary Guidelines for Americans(Reference Blackstone, El-Abbadi and McCabe9). Incorporating sustainability in a possible update of the RIEN and the Food-based Dietary Guidelines (GABAS in Spanish)(44) may also improve food security in the country(Reference Blackstone, El-Abbadi and McCabe9,Reference Milner and Green45) . Future modifications could include conscious eating as promoted by Canadian dietary guidelines(Reference Webster46) and standardising recommendations in g/kg per d(Reference Fulgoni33). Protein intake limits and the sources of protein can also be adapted, given that red meat and eggs can play a protective role in iron deficiency anemia, thereby reducing its prevalence in Colombia(Reference Herran, Bermúdez and Del Pilar Zea47). By having identified the age at which the current and adequate weight of the subjects began to deviate from each other, dietary and nutritional education as well as other multi-sector dietary interventions can be better targeted before excess weight develops. Various actions need to be taken to prevent pseudoscience from replacing food and nutrition education, such as compelling messages and actions regarding how long a diet needs to be followed before harm or benefits result, the complexity of interactions among different levels of risk factors and differences in individual and population interventions carried out in particular cultural contexts. Lastly, the data on the prevalence of protein intake deficiency reported in the 2005 ENSIN should be reviewed to take into account habitual or long-term consumption(13).
Strengths and limitations of the study
The primary limitation of the present study was the inability to determine causal associations due to the cross-sectional design of the ENSIN. Another limitation was that the present study reported current intake rather than usual or long-term intake, given the use of the 24HR method. Sources of protein could also not be determined (animal or vegetable). Nevertheless, this analysis also has its strengths. The data were taken from a nationally representative survey that estimated energy and protein intake based on a 24HR that was administered by well-trained nutritionists. Furthermore, the 24HR was translated into nutrients based on the best food composition database available in Colombia.
Supplementary material
The supplementary material for this article can be found at https://doi.org/10.1017/jns.2021.2.
Acknowledgements
All the data analyzed during this study are available, they are publicly accessible through a reasoned request to the Ministry of Health and Social Protection of Colombia.
This investigation did not receive any specific subsidy from any funding agency, commercial sector or non-profit organisation.
M. P. Z. is a researcher of the dietary consumption component at ENSIN-2015. O. F. H. and M. P. Z. co-designed the study, co-prepared the databases and co-performed the statistical analyses. O. F. H., M. P. Z. and E. M. G. interpreted the results and prepared, wrote and reviewed the submitted final draft of the manuscript. All authors reviewed the manuscript and approved the final version.
The authors declare that they have no real or potential conflicts.


 Open access