


Functional imaging studies in bipolar disorder have had hetero-geneous and at times confusing findings, although there is now a broad consensus that the disorder is characterised by overactivity in subcortical structures such as the amygdala, hippocampus and basal ganglia, coupled with reduced activity in prefrontal and some other cortical regions. Reference Strakowski, Delbello and Adler1–Reference Strakowski, Adler, Almeida, Altshuler, Blumberg and Chang4 Recent meta-analyses suggest that this pattern is seen both at rest and in studies using task activation, Reference Kupferschmidt and Zakzanis5 although the pattern differs to some extent depending on whether cognitive or emotional tasks (typically facial emotion processing) are used. Reference Chen, Suckling, Lennox, Ooi and Bullmore6 What remains less clear is the ‘state’ v. ‘trait’ characteristics of functional imaging abnormality in bipolar disorder, i.e. whether there are differences between patients in manic and depressed episodes and to what extent changes seen in both phases of illness persist into euthymia.
In Kupferschmidt & Zakzanis’ Reference Kupferschmidt and Zakzanis5 meta-analysis of 55 studies that pooled conventional effect-size data, resting and task-related changes were seen in episodes of illness and in euthymia but the differences between phases were complex. Cortical hypoactivity and limbic hyperactivity was found to be greater in patients in a manic phase than in euthymia, and patients in a depressed phase showed greater hypoactivation in frontal regions than in euthymia. However, patients in euthymia showed more evidence of limbic hyperactivity than those with depression. Abnormalities were also more pronounced in patients in a manic than in depressed phase. Rather differently, Chen et al’s Reference Chen, Suckling, Lennox, Ooi and Bullmore6 meta-analysis of voxel-based functional magnetic resonance imaging (fMRI) studies found that changes (reduced activation) were restricted to the lingual gyrus in 26 studies carried out on participants in a euthymic phase. There were only relatively few studies carried out exclusively on participants in manic and depressed phases (8 and 7 respectively), and so their findings – decreased activation in the inferior frontal gyrus in mania and no change in depression – may not have been reliable.
In what appears to be the only contemporary study to directly compare patients across phases, Townsend et al Reference Townsend, Bookheimer, Foland-Ross, Sugar and Altshuler7 examined 13 patients in a manic phase, 14 in a depressed phase and 15 in a euthymic phase, as well as 14 healthy controls, during performance of the n-back working memory task. Citing a lack of availability of methods for analysing differences among four groups at the whole-brain level, the authors only examined two predetermined regions of interest (ROIs), the left and right dorsolateral prefrontal cortex and the left and right posterior parietal cortex. They found reduced activation in both ROIs in mania, depression and euthymia, with no significant variation across phase.
Over the past decade the importance not only of task-related activations but also de-activations has become increasingly recognised. This follows the discovery of the so-called default mode network, an interconnected set of brain regions that are highly active at rest but de-activate during performance of a wide range of attention-demanding tasks. Reference Raichle, MacLeod, Snyder, Powers, Gusnard and Shulman8,Reference Buckner, Andrews-Hanna and Schacter9 Prominent among these regions are two midline cortical areas, the medial frontal cortex anteriorly and the posterior cingulate cortex/precuneus posteriorly. Recent evidence suggests that bipolar disorder may also be characterised by de-activation changes in the default mode network. Thus, Pomarol-Clotet et al Reference Pomarol-Clotet, Moro, Sarro, Goikolea, Vieta and Amann10 found failure of de-activation in the ventromedial frontal cortex during performance of the n-back task in participants in a manic episode compared with healthy controls, and Fernández-Corcuera et al Reference Fernandez-Corcuera, Salvador, Monte, Salvador Sarró, Goikolea and Amann11 had similar findings in patients with bipolar depression. Strakowski et al, Reference Strakowski, Adler, Cerullo, Eliassen, Lamy and Fleck12 in contrast, found significantly greater de-activation in participants with first-episode mania compared with healthy controls in the bilateral posterior cingulate cortex. So far there has been only one study of patients in the euthymic phase: Allin et al Reference Allin, Marshall, Schulze, Walshe, Hall and Picchioni13 found no changes in the medial frontal or lateral parietal nodes of the default mode network during performance of a paced verbal fluency task, but failure of de-activation was seen in the retrosplenial cortex and adjacent precuneate cortex, an area conforming reasonably closely to the posterior midline node.
The aim in this study was to examine whether task-related activations differed in patients in manic, depressed and euthymic bipolar phases, and also to further clarify the pattern of de-activation changes associated with the disorder. We used a cognitive task, the n-back working memory task, which has been found to be associated with functional imaging changes in both illness phases of bipolar disorder Reference Townsend, Bookheimer, Foland-Ross, Sugar and Altshuler7,Reference Pomarol-Clotet, Moro, Sarro, Goikolea, Vieta and Amann10,Reference Fernandez-Corcuera, Salvador, Monte, Salvador Sarró, Goikolea and Amann11 and in euthymia (for a areview see Cremaschi et al Reference Cremaschi, Penzo, Palazzo, Dobrea, Cristoffanini and Dell'Osso14 ), and which we have found to reliably produce de-activation in the territory of the default mode network. Reference Pomarol-Clotet, Moro, Sarro, Goikolea, Vieta and Amann10,Reference Fernandez-Corcuera, Salvador, Monte, Salvador Sarró, Goikolea and Amann11,Reference Pomarol-Clotet, Salvador, Sarro, Gomar, Vila, Martínez and Guerrero15,Reference Salgado-Pineda, Fakra, Delaveau, McKenna, Pomarol-Clotet and Blin16 We used whole-brain voxel-based analysis and were able to take advantage of advances in fMRI methodology to carry out a conjoint analysis of the four groups of participants (i.e. the three bipolar disorder subgroups and the healthy control group).
Method
Participants
The patient sample was recruited from three hospitals in Barcelona, Benito Menni CASM, Hospital Clínic and Hospital General de Granollers. All patients met DSM-IV 17 criteria for bipolar disorder, made up of three subgroups, mania (n = 38, all type I), depression (n = 38, 32 type I and 6 type II) and euthymia (n = 38, all type I). The participants in the mania subgroup were required to have a Young Mania Rating Scale (YMRS) Reference Young, Biggs, Ziegler and Meyer18 score ≥18 and those in the depression subgroup to have a score of ≥15 on the Hamilton Rating Scale for Depression (21-items, HRSD). Reference Hamilton19 Participants in the euthymia subgroup were required to have had no episodes of illness for at least 3 months and a score on the HRDS-21 of ≤8 and YMRS of ≤8 at the time of scanning. All patients were right handed.
Patients were excluded if: (a) they were younger than 18 or older than 65 years, (b) they had a history of brain trauma or neurological disease, or (c) there was alcohol/substance misuse in the 12 months prior to participation. Patients who had under-gone electroconvulsive therapy in the previous 12 months were also excluded.
In the mania subgroup, patients were taking the following medications: mood stabilisers (lithium n = 20; other mood stabilisers n = 5); antidepressants (n = 2) and antipsychotics (n = 28, second generation 21; first generation 2; combination 5); all medication data were missing for 1 patient. In the depression subgroup, patients were taking mood stabilisers (lithium n = 25; other mood stabilisers n = 9) and/or antidepressants (n = 22) and anti-psychotics (n = 20, all second generation). Most of the participants in the euthymia subgroup were on mood stabilisers (lithium n = 28; other mood stabilisers n = 8); some patients were taking antidepressants (n = 8) and some were also taking antipsychotics (n = 21, all second generation).
A healthy control group (n = 38) was recruited via poster and web-based advertisement in the hospital and local community, plus word-of-mouth requests from staff in the research unit. They met the same exclusion criteria as the bipolar group. They were interviewed and excluded if they reported a history of mental illness and/or treatment with psychotropic medication other than non-regular use of benzodiazepines or similar drugs for insomnia. They were also questioned about family history of mental illness and excluded if a first-degree relative had experienced symptoms consistent with major psychiatric disorder and/or had received any form of in- or out-patient psychiatric care. All were right handed.
All four groups were matched for age, gender and IQ, as estimated by the Word Accentuation Test (Test de Acentuación de Palabras, TAP), Reference Del Ser, Gonzalez-Montalvo, Martinez-Espinosa, Delgado-Villapalos and Bermejo20 a test requiring pronunciation of Spanish words whose accents have been removed. The TAP has been standardised against the Wechsler Adult Intelligence Scale (WAIS-III) Reference Wechsler21 and scores can be converted into full-scale IQ estimates. Reference Gomar, Ortiz-Gil, McKenna, Salvador, Sans-Sansa and Sarró22 Both the bipolar and control groups were also required to have a current IQ in the normal range (i.e. ≥70), as measured using four subtests of the WAIS-III: vocabulary, similarities, block design and matrix reasoning.
All participants gave written informed consent. The study was approved by the local research ethics committees.
Scanning procedure
While being scanned, individuals performed a sequential-letter version of the n-back task Reference Gevins and Cutillo23 in the scanner (Fig. 1). Two levels of memory load (1-back and 2-back) were presented in a blocked design manner. Each block consisted of 24 letters that were shown every 2 s (1 s on, 1 s off) and all blocks contained five repetitions (1-back and 2-back depending on the block) located randomly within the blocks. Individuals had to indicate repetitions by pressing a button. Four 1-back and four 2-back blocks were presented in an interleaved way, and between them a baseline stimulus (an asterisk flashing with the same frequency as the letters) was presented for 16 s. To identify which task had to be performed, characters were shown in green in 1-back blocks and in red in 2-back blocks. All participants first went through a training session outside the scanner.
Task performance was measured using the signal detection theory index of sensitivity (d’) of ability to discriminate targets from non-targets. Reference Green and Swets24 Higher values of d’ indicate better ability to discriminate between targets and distractors. Participants who had negative d’ values in either or both of the 1-back and 2-back versions of the task, which suggests that they were not performing it, were a priori excluded from the study.
In each individual scanning session 266 volumes were acquired from a 1.5-T GE Signa scanner. A gradient-echo echo-planar imaging (EPI) sequence depicting the blood oxygenation level-dependent (BOLD) contrast was used. Each volume contained 16 axial planes acquired with the following parameters: repetition time (TR) = 2000 ms, echo time (TE) = 20 ms, flip angle 70°, section thickness, 7 mm, section skip, 0.7 mm, in-plane resolution, 3×3 mm. The first 10 volumes were discarded to avoid T 1 saturation effects.
Individual fMRI analyses were performed with the FEAT module, included in FSL software (version 4.19 for Linux). Reference Smith, Jenkinson, Woolrich, Beckmann, Behrens and Johansen-Berg25 In the preprocessing phase, images were corrected for movement, co-registered and spatially filtered with a Gaussian filter (full-width at half maximum (FWHM) = 5 mm). To minimise unwanted movement-related effects, individuals with an estimated maximum absolute movement >3.0 mm or an average absolute movement >0.3 mm were excluded from the study. General linear models were fitted to generate individual activation maps for the contrast comparing blocks of baseline with blocks of the 2-back level of the task. To further reduce the potential effect of movement, values of movement parameters were included as nuisance covariates in the fitting of individual linear models.
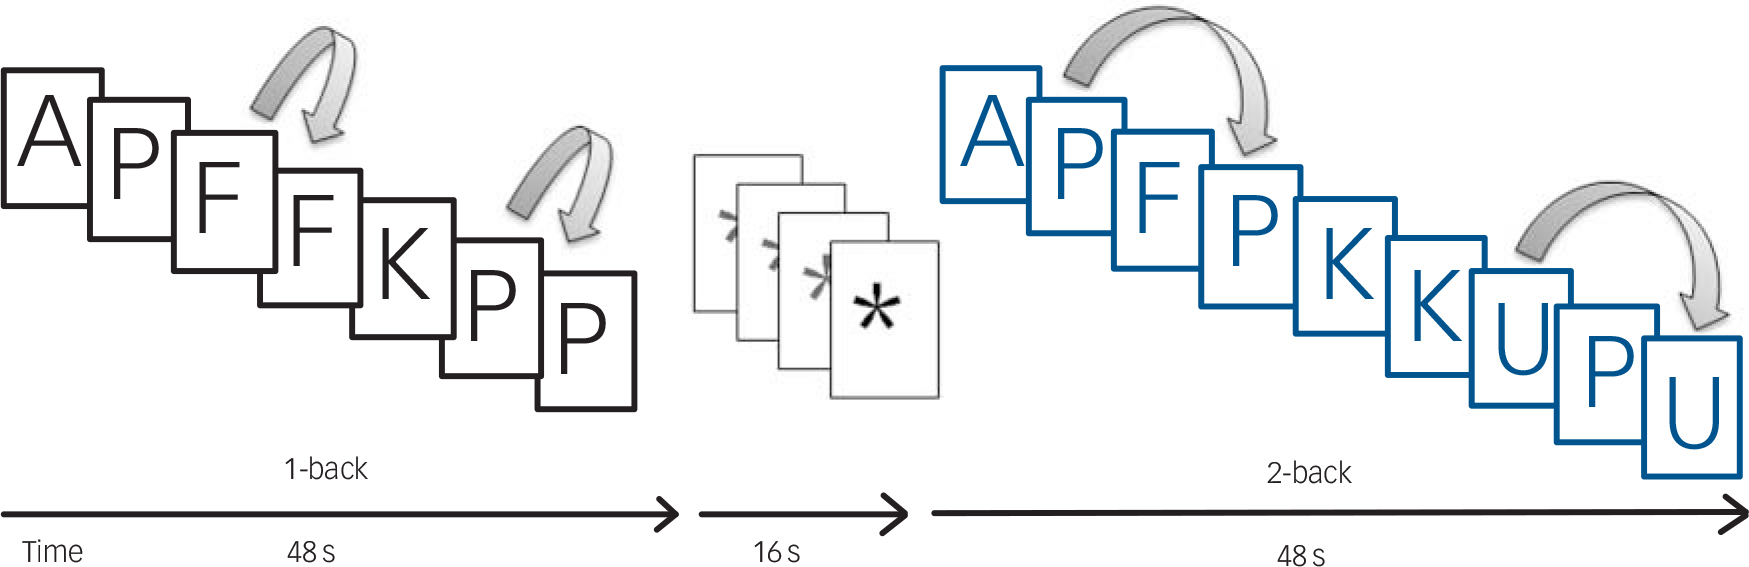
Fig. 1 Sequential-letter version of the n-back task with two levels of memory load, 1-back (black) and 2-back (blue).
Before the group analyses, images were normalised to a common stereotaxic space (Montreal Neurologic Institute (MNI) template).
Group comparisons
The same FEAT module was used to fit a linear mixed-effects model including the baseline v. 2-back activation images for the four independent groups. Using this model, each bipolar subgroup was individually compared with the healthy controls. The bipolar subgroups were also compared with each other, i.e. mania v. euthymia, depression v. euthymia and mania v. depression. Statistical tests on these contrasts were carried out at the cluster level with a family-wise corrected P-value of 0.05 using Gaussian random field methods. The default threshold of z = 2.3 was used to define the initial set of clusters.
Additionally, an ANOVA was run on all four groups together, using the same fitted linear mixed-effects model that defined clusters of difference between any of the four groups. Significant clusters were then taken as ROIs and were used to draw exploratory boxplots visualising the relative levels of activation/de-activation for the four groups in areas of functional abnormality.
Results
Demographic and clinical data on the bipolar and control groups are shown in Table 1. The groups were well-matched for age, gender and TAP-estimated IQ. However, the healthy control group had a higher mean current IQ than the bipolar subgroups, which was significant in the case of the mania and depression subgroups. The three bipolar subgroups did not differ significantly in duration of illness.
Performance on the n-back test
There were significant differences among the groups on both the 1-back version and the 2-back versions of the test (F = 6.66, P<0.001 and F = 12.74, P<0.001, respectively). In the 1-back version, post hoc testing (Tukey HSD) indicated that the mania subgroup performed significantly more poorly than the control group (mean d’ 3.36 (s.d. = 1.10) v. 4.34 (s.d. = 0.76), <0.001) as did the depression subgroup (mean d’.75 (s.d. = 1.17), P = 0.04); however, the euthymia subgroup did not perform significantly differently from the control group (mean d′ 3.91 (s.d. = 1.11), P<0.23). Results were similar in the 2-back version, with the mania subgroup performing significantly worse than the control group (mean d’ 2.02 (s.d. = 1.05) v. 3.22 (s.d. = 0.86), P<0.001), and the depression subgroup performing worse than the control group (mean d′ 2.28 (s.d. = 1.13), P<0.001); however, the performance of the euthymia subgroup did not differ from the control group (mean d′ 2.77 (s.d. = 0.90), P<0.15). Within the bipolar subgroups the only significant difference was between the mania and the euthymia subgroups (P = 0.006).
Neuroimaging findings
As in previous studies by our group, Reference Pomarol-Clotet, Moro, Sarro, Goikolea, Vieta and Amann10,Reference Fernandez-Corcuera, Salvador, Monte, Salvador Sarró, Goikolea and Amann11,Reference Pomarol-Clotet, Salvador, Sarro, Gomar, Vila, Martínez and Guerrero15 the 2-back v. baseline contrast delivered larger and more extensive activations and de-activations than the 1-back v. baseline contrast. Therefore, in what follows only the results for this contrast are reported.
Maps of mean activations for the three bipolar subgroups and the control group in the 2-back v. baseline contrast are shown in online Fig. DS1. Briefly, at P<0.05 corrected, the healthy control group showed a pattern of bilateral activations in the anterior insula, the dorsolateral prefrontal cortex, and the precentral gyri, supplementary motor areas, cerebellum, thalamus, basal ganglia, and parts of the temporal and parietal cortex. They also showed de-activations: these were seen bilaterally in the medial frontal cortex, the amygdala, the hippocampus and adjacent cortical regions, the medial parietal cortex extending to primary visual areas, the posterior insula and the lateral parietal cortex.
Activations and de-activations in the mania, depression and euthymia subgroups followed a broadly similar pattern to that seen in the control group. However, the clusters were noticeably less extensive and less highly activated/de-activated, particularly in the mania and depression subgroups.
Comparisons between the individual subgroups and the healthy control group
Mania subgroup v. control group. As shown in Figure 2, at P<0.05 corrected, the mania subgroup showed significant failure of activation in bilateral clusters involving the dorsolateral prefrontal cortex, the parietal cortex and the precuneus (left: 12272 voxels, peak activation in Brodmann area (BA) 6/8, MNI (–30, –2, 62), z-score = 5.06, P = 7.13×10⁻¹⁷; right: 1477 voxels, peak activation in BA 6/8, MNI (24, 6, 58), z-score = 5.29, P = 0.002). Clusters of reduced activation were also seen in the basal ganglia and thalamus bilaterally (right: 1409 voxels, peak activation in MNI (18, 8, 16), z-score = 4.1, P = 0.002); left: 1208 voxels, peak activation in MNI (–18, –10, 18), z-score = 3.87, P = 0.006) and the cerebellum (right: 1654 voxels, peak activation in MNI (30, –44, –32), z-score = 4.21, P = 0.0008; left: 1259 voxels, peak activation in MNI (–44, –70, –10), z-score = 3.87, P = 0.005).
The mania subgroup also showed failure of de-activation in the ventromedial prefrontal cortex relative to the control group (2605 voxels, peak activation in MNI (–2, 46, –28), z-score = 4.73, P = 1.87×10⁻⁵).
Table 1 Demographic and clinical characteristics of bipolar subgroups and control group
| Mania subgroup (n = 38) |
Depression subgroup (n = 38) |
Euthymia subgroup (n = 38) |
Control group (n = 38) |
F | χ2 | KW | P |
Post
hoc |
|
|---|---|---|---|---|---|---|---|---|---|
| Age, years: mean (s.d.) | 39.74 (11.36) | 39.89 (10.39) | 40.00 (8.78) | 39.68 (8.88) | 0.01 | 0.99 | |||
| Gender, men/women: n | 18/20 | 17/21 | 17/21 | 18/20 | 0.11 | 0.99 | |||
| TAP, mean (s.d.) | 22.75 (4.52) | 22.47 (4.85) | 23.67 (3.15) | 22.71 (3.28) | 0.62 | 0.60 | |||
| TAP_FISQ, mean (s.d.) | 101.81 (8.65) | 101.33 (9.39) | 103.50 (6.02) | 101.66 (6.21) | 0.57 | 0.63 | |||
| WAIS-III, mean (s.d.) | 95.15 (14.28) | 93.17 (15.05) | 97.47 (13.87) | 105.61 (14.59) | 5.06 | 0.002 | M, D < C | ||
| Duration of illness, years:
mean (s.d.) |
11.59 (11.67) | 14.51 (10.17) | 13.03 (7.28) | N/A | 0.81 | 0.45 | |||
| YMRS score, mean (s.d.) | 21.84 (3.67) | 1.29 (2.24) | 1.41 (1.88) | N/A | 717.81 | <0.001 | D, E<M | ||
| HRSD score, mean (s.d.) | 4.14 (3.65) | 22.13 (4.03) | 2.73 (2.18) | N/A | 383.07 | <0.001 | M, E<D | ||
| CGI score mean (s.d.) | 4.66 (0.72) | 4.51 (0.65) | 2.06 (1.03) | N/A | 60.39 | <0.001 | M, D>E | ||
| GAF score, mean (s.d.) | 45.81 (11.05) | 44.77 (11.90) | 76.78 (11.17) | N/A | 84.43 | <0.001 | M, D<E | ||
| History of psychosis, yes/no: n | 30/8 | 24/10Footnote * | 30/8 | N/A | 1.31 | 0.52 | |||
M, mania subgroup; D, depression subgroup; C, control group; E, euthymia subgroup; KW, Kruskal–Wallis; TAP, Word Accentuation Test (Test de Acentuación de Palabras); TAP_FISQ, TAP–estimated Full-Scale IQ; WAIS-III, Wechsler Adult Intelligence Scale III; YMRS, Young Mania Rating Scale; HRSD, Hamilton Rating Scale for Depression; CGI, Clinical Global Impressions; Reference Guy26 GAF, Global Assessment of Functioning. Reference Jones, Thornicroft, Coffey and Dunn27
* Data missing for 4 participants.
Depression subgroup v. control group. Once again the patients showed a pattern of hypo-activation in the bilateral dorsolateral prefrontal cortex extending to the basal ganglia and thalamus (4415 voxels, peak activation in MNI (–32, –2, 50), z-score = 4.71, P = 1.9×10⁻¹⁴); in the bilateral parietal cortex and precuneus (2687 voxels, peak activation in MNI (8, –64, 62), z-score = 4.86, P = 1.3×10⁻⁵); and in the cerebellum (2707 voxels, peak activation in MNI (–32, –54, –30), z-score = 4.89, P= 1.2×10⁻⁵). Like the

Fig. 2 Brain clusters showing statistically significant differences in the 2-back v. baseline contrast (at P<0.05 corrected) among the three bipolar subgroups compared with the controls.
(a) Mania subgroup v. control group; (b) depression subgroup v. control group; and (c) euthymia subgroup v. control group. The right side of the image is the right side of the brain.
mania subgroup, the depression subgroup also showed failure of de-activation in the ventromedial prefrontal cortex, (4415 voxels, peak activation in MNI (0, 46, –20), z-score = 4.68, P = 5.9×10⁻⁸) (Fig. 2).
Euthymic subgroup v. control group. In contrast to the other two groups, the euthymia subgroup did not show any clusters of reduced activation compared with the control group. However, failure of de-activation was again seen in the ventromedial frontal cortex (3511 voxels, with peak activation in BA 25, MNI (–6, 16, –10), z-score = 4.12, P = 1.31×10⁻⁶) (Fig. 2).
Since the mania and depression subgroups showed significantly worse n-back task performance than the healthy control group, we repeated these comparisons including performance as a covariate. Although there was a reduction in the area of some of the clusters found, for the most part they were still evident in the same locations. The findings are shown in online Fig. DS2.
Comparisons within the bipolar subgroups
Mania v. euthymia subgroup. The mania subgroup showed two clusters of significantly reduced activation compared with the euthymia subgroup. These were symmetrically located in the left and right dorsal parietal cortex and precuneus. The cluster on the left had a larger extension (2229 voxels, peak activation in BA 40, MNI (–46, –42, 56), z-score = 3.93, P = 7.83 10–5), than that on the right (1368 voxels, peak activation in BA 7, MNI (26, –50, 56), z-score = 3.9, P = 2.97×10⁻³). The findings are shown in Fig. 3.
Depression v. euthymia subgroup. Results for this comparison were similar to those for the mania v. euthymia contrast. Once again the depression subgroup showed significantly reduced activation in the dorsal parietal cortex and precuneus. This time, however, the reduction was unilateral, being seen only on the right (982 voxels, peak activation in BA 40, MNI (40, –44, 56), z-score = 3.95, P = 0.02). The findings are also shown in Fig. 3.
Mania v. depression subgroup. No significant differences in levels of activation or de-activation were found between these two phases of illness. For the comparison between the mania and euthymia subgroups, the only pair-wise comparison where the two groups differed significantly in n-back performance, the analysis was repeated adding d’ a covariate. The results remained similar. The findings are shown in online Fig. DS2.

Fig. 3 Brain clusters showing statistically significant differences in the 2-back v. baseline contrast (at P<0.05 corrected) in the mania and depression subgroups compared with the euthymia subgroup.
(a) Mania v. euthymia subgroup and (b) depression v. euthymia subgroup. No differences were found when the mania subgroup were compared with the depression subgroup. The right side of the image is the right side of the brain.
Four-group ANOVA and ROI analysis
Results from the ANOVA including the three bipolar subgroups and the control group are shown in Fig. 4. Four clusters of significant difference between at least one group and the others were found. Two of the clusters were symmetrically located in the left and right dorsal parietal cortex, similar to the significant clusters found in the mania v. euthymia and in the depression v. euthymia contrasts (right: 1582 voxels, peak activation in MNI (40, –46, 56), z-score = 4.05, P = 0.001; left 1118 voxels, peak activation in MNI (–58, –40, 54), z-score = 4.17, P = 0.009). Boxplots of mean activations in ROIs based on these two clusters indicated significantly reduced levels of activation in both phases of illness compared with euthymia and the control group. However, the euthymia subgroup did not differ significantly from the control group in either of the clusters (see online Table DS1 for details of the means, standard deviations and significance levels).
A third cluster, also found in the individual analyses, was located in the ventromedial frontal cortex (1943 voxels, peak activation in MNI (–2, 46, –28), z-score = 5.06, P= 0.0002). The accompanying boxplots indicate significantly lower for the mania, depression and euthymia subgroups than the de-activation control group.
This analysis also produced a new cluster. This was located in the left dorsolateral prefrontal cortex (1256 voxels, peak activation in BA 6, MNI (–34, –2, 54), z-score = 4.32, P = 0.005). As can be seen from the boxplots, there was significantly reduced activation in the mania, depression and euthymia subgroups compared with the control group. The mania subgroup also showed significantly reduced activation compared with the euthymia subgroup.
Discussion
Main findings
The analyses carried out in this study provide evidence that bipolar disorder is characterised by both mood-state-dependent and mood-state-independent functional imaging abnormalities.
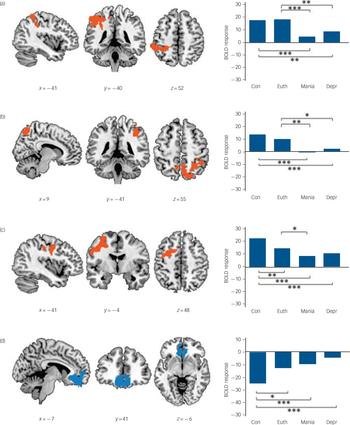
Fig. 4 The four clusters of significant difference found comparing all three bipolar subgroups and the control group.
The first three clusters, left parietal (a), right parietal (b) and left dorsolateral frontal (c) were regions of activation in the control group; the fourth in the ventromedial and orbitofrontal cortex (d) was a region where the control group showed de-activation. Boxplots are based on mean activation values from regions of interest (ROIs) extracted from the four significant clusters. BOLD, blood oxygen level-dependent; Con, control group; Euth, euthymia subgroup; Mania, mania subgroup; Depr, depression subgroup. ***significant at P<0.001, **significant at P<0.01, *all results significant at P<0.05 based on the post hoc Tukey’s HSD test. The right side of the image is the right side of the brain.
Reduced activation in the dorsal parietal cortex was seen in both mania and depression but not in euthymia. Reduced activation was also seen in the dorsolateral prefrontal cortex, but here the changes showed a more complicated relationship with phase of illness – activation was reduced across all three phases of illness, although with greater reductions in mania (but not depression) than in euthymia. On the other hand, failure of de-activation in the medial frontal cortex was seen in all three illness phases and so seems to represent a trait-like abnormality.
Changes in the dorsal parietal and dorsolateral prefrontal cortex
Our finding of mood-state dependent changes in the dorsal parietal cortex is unexpected – this region was not identified in either Kupferschmidt & Zakzanis’s Reference Kupferschmidt and Zakzanis5 or Chen et al’s Reference Chen, Suckling, Lennox, Ooi and Bullmore6 meta-analyses, including in their subanalyses directed to mood state. One possible explanation for this relates to the fact that the parietal cortex forms part of the ‘working memory network’ activated the n-back task, Reference Owen, McMillan, Laird and Bullmore28 and, although both meta-analyses pooled data from studies using a range of different cognitive tasks, relatively few of them employed the n-back or other working memory tasks (10/32 and 7/29 respectively). Among studies that did use the n-back task, Pomarol-Clotet et al Reference Pomarol-Clotet, Moro, Sarro, Goikolea, Vieta and Amann10 found reduced activation in the parietal cortex along with other parts of the working memory network in patients in a manic phase, and Fernández-Corcuera et al Reference Fernandez-Corcuera, Salvador, Monte, Salvador Sarró, Goikolea and Amann11 had similar results in bipolar depression (it should be noted that both these studies were carried out on samples that overlapped with the present study). With respect to euthymia, Cremaschi et al Reference Cremaschi, Penzo, Palazzo, Dobrea, Cristoffanini and Dell'Osso14 reviewed eight studies using the n-back task in this phase of illness and found reduced parietal activation only in one of them (Townsend et al Reference Townsend, Bookheimer, Foland-Ross, Sugar and Altshuler7 – discussed further below); there no differences between patients and controls in three of the studies and three found increased activation. Accordingly, the literature to date provides some support for mood state-related differences in this region during performance of this cognitive task.
If this explanation is correct, it might be expected that a different pattern of mood-state dependent changes would be found if other tasks were used. Some support for this view comes from a study by Chen et al. Reference Chen, Suckling, Ooi, Jacob, Lupson and Bulmore29 They scanned 12 patients with bipolar disorder during performance of a facial emotion identification task, first when they were in a manic episode and then again when they had become euthymic. Twelve healthy controls were also scanned twice. A significant group×time interaction was found in the right amygdala and hippocampus, which was the result of increased activation in the patients when they were euthymic. (It should be noted that the authors used a mask restricting the analysis to brain regions involved in emotional processing and so the possibility of changes in other regions cannot be ruled out.)
We also found reduced activation in the dorsolateral prefrontal cortex, which showed ambiguous evidence of state-like characteristics. It did not appear in any of the contrasts between pairs of bipolar subgroups, but emerged in the ANOVA comparing all three bipolar subgroups and the controls. Reduced prefrontal cortex activation has been a regular finding in bipolar disorder, although it has mainly been documented in the orbitofrontal cortex, Reference Blumberg, Leung, Skudlarski, Lacadie, Fredericks and Harris30–Reference Altshuler, Bookheimer, Townsend, Proenza, Eisenberger and Sabb32 the ventrolateral prefrontal cortex Reference Mazzola-Pomietto, Kaladjian, Azorin, Anton and Jeanningros33 and the frontal pole Reference Blumberg, Stern, Ricketts, Martinez, de Asis and White34,Reference Rubinsztein, Fletcher, Rogers, Ho, Aigbirhio and Paykel35 perhaps reflecting the nature of the tasks used in these studies – the go/no-go task, the Stroop task and a gambling task. Consistent with such an interpretation, all of a small number of studies that have used working memory tasks have found reduced activation in or close to the dorsolateral prefrontal cortex in mania, Reference Pomarol-Clotet, Moro, Sarro, Goikolea, Vieta and Amann10 depression Reference Fernandez-Corcuera, Salvador, Monte, Salvador Sarró, Goikolea and Amann11 and euthymia. Reference Monks, Thompson, Bullmore, Suckling, Brammer and Williams36–Reference Lagopoulos, Ivanovski and Malhi38
The study of Townsend et al, Reference Townsend, Bookheimer, Foland-Ross, Sugar and Altshuler7 described in the introduction, is the only other study to date that has examined patients in all three illness phases during performance of the n-back task. Their findings were quite different to ours in that they failed to find significant variation across phase in either the parietal cortex or the dorsolateral prefrontal cortex, although activation was reduced in all three patient groups compared with controls. There are two potential reasons why these authors may have failed to detect differences across phase, however. First, at 13–15 per group, the sample sizes may have been too small to detect differences, particularly when it is considered that between-patient differences are likely to be more subtle than those between patients and healthy controls. Second, group comparisons were carried out at the ROI rather than the whole brain level. Here it is noteworthy that, rather than using anatomically defined ROIs, the authors employed a 5 mm sphere around the maximally activated voxels in each bilateral region. It seems possible that this might have resulted in ROIs that favoured finding differences between patients and controls, but were not optimally located to detect differences between phases.
The activation changes between illness and euthymia we found in the dorsal parietal cortex, and more equivocally between mania and euthymia in the dorsolateral prefrontal cortex, could have reflected either the obvious symptomatic differences between the two states, or alternatively improvement in cognitive function taking place with recovery. Of the two, the latter seems intuitively more likely, given that we used a cognitive as opposed to an emotional task. A cautionary note needs to be sounded here, however, because the view that cognitive impairment in depression and mania normalises with clinical recovery Reference Murray, Sham, Van Os, Zanelli, Cannon and McDonald39 is almost certainly an oversimplification. On the one hand, it is now accepted that cognitive impairment is also seen in a proportion of patients in euthymia (see, for example, Robinson & Ferrier Reference Robinson and Ferrier40 ). On the other, the few studies that have directly compared the degree of impairment in different phases of illness have not found evidence that it is substantially less marked in euthymia (for example see Martinez-Aran et al Reference Martinez-Aran, Vieta, Reinares, Colom, Torrent and Sánchez-Moreno41 ).
Failure of de-activation in the medial frontal cortex
The final finding of this study was that failure of de-activation in the medial frontal cortex distinguished the patients from the controls but was present to a similar degree in all three phases of illness. This finding is in line with those of our previous studies in mania Reference Pomarol-Clotet, Moro, Sarro, Goikolea, Vieta and Amann10 and bipolar depression, Reference Fernandez-Corcuera, Salvador, Monte, Salvador Sarró, Goikolea and Amann11 although not with that of Strakowski et al Reference Strakowski, Adler, Cerullo, Eliassen, Lamy and Fleck12 in patients in a first-episode of mania. Calhoun et al Reference Calhoun, Maciejewski, Pearlson and Kiehl42 additionally found failure of de-activation that affected particularly the medial frontal cortex in a mixed group of patients with bipolar disorder. Potentially also relevant here is a finding from Chen et al’s Reference Chen, Suckling, Lennox, Ooi and Bullmore6 meta-analysis of whole-brain voxel-based studies. This found the medial frontal cortex to be a site of increased activation compared with controls, and this continued to be seen in the subanalysis of the euthymia group. It is quite possible that this finding could actually represent failure of de-activation in the patients, since hyperactivation and failure of de-activation can give similar findings when conventional subtractive analysis is carried out (see Gusnard & Raichle Reference Gusnard and Raichle43 for a detailed explanation).
Implications and limitations
This study found that brain functional changes in bipolar disorder can be divided into those that are state-related and those that have more enduring, trait-like characteristics. The parietal cortex, an area that is implicated in working memory performance, showed evidence of belonging to the former category. Failure of de-activation in the medial frontal cortex, and so by implication default mode network dysfunction, appeared to fall into the latter. The dorsolateral prefrontal cortex showed a combination of both characteristics, exhibiting reduced activation in both phases of active illness but without fully normalising between episodes.
Our study has some limitations that should be acknowledged. Most notably, the patients were taking medication, which differed in dosage and type in the different phases of illness. We studied unselected patients with bipolar disorder: most but not all had type I illness, but we did not preselect patients with non-psychotic forms of illness. Additionally, the cross-sectional nature of the study means it may be susceptible to unknown, but potentially relevant, sampling biases.


eLetters
No eLetters have been published for this article.