


The relative price of food increased by about 8 % in the UK between December 2007 and December 2009, meaning that food prices increased by more than average price rises (i.e. above the increase in the all-item Retail Price Index)( Reference Crossley, Low and O’Dea 1 ). Food prices in the UK were about 12 % higher in 2012 than they were in 2007, after accounting for inflation( 2 ), whereas median equivalized disposable income fell over a similar time period( 3 ). Consumers in the UK responded to the sharp increases in food prices, and the concomitant global economic recession, by simply spending more on some, but not all, foods. They also changed their shopping behaviours to partially offset increasing food prices by trading down some foods (including cereals, pork, fish, and sweets and chocolate) and by switching to cheaper versions of products of the same type( 2 ), such as from branded to own brand products, or from own brand to value products. Consumers also simply bought less of some types of food, including beef, lamb, fish and fruit( 2 ).
Change in food purchasing behaviour can also be seen in secondary analysis of consumer panel data, such as the Kantar Worldpanel (KWP). KWP’s consumer panel of approximately 30000 households in Great Britain, of which about 3000 live in Scotland, reports purchase information, including food and drinks brought into the home, but excluding those that are ‘eaten out’ (such as restaurant and fast-food meals; takeaway foods and drinks), for continuous periods ranging from months to many years. In a recent analysis of changes in food and drink purchasing in the KWP data between 2005–2007 and 2010–2012, Griffith et al. ( Reference Griffith, O’Connell and Smith 4 ) reported that households in Great Britain reduced real expenditure (i.e. after adjusting for inflation) on foods brought into the home, reduced the amount of energy bought (kJ/adult equivalent per d) and reduced real expenditure per 1000 kcal (4184 kJ). Energy content of foods and drinks purchased and brought into the home decreased by 74 kcal (310 kJ)/adult equivalent per d between 2005–2007 and 2010–2012, while the average energy density increased largely because of households switching from low-energy-dense fruits and vegetables to more energy-dense processed foods( Reference Griffith, O’Connell and Smith 4 ). A similar decrease, of 4·4 % or 101 kcal (423 kJ)/person per d, in total energy intake was found between 2010 and 2012 from the Living Costs and Food Survey, which also reports food and drink purchases( 5 ). Energy intake from foods and drinks consumed outside the home also decreased, by 12·5 %, between 2009 and 2012, representing about 11 and 10 % respectively of total energy intake( 2 ).
Epidemiological studies tend to show an inverse relationship between food affordability and diet quality, with less affluent households having diets that are more energy dense and of a lower quality (less lean meat, fish, and fresh fruit and vegetables) than those of more affluent households( Reference Rehm, Monsivais and Drewnowski 6 , Reference Backholer, Spencer and Gearon 7 ). Energy-dense foods, and overall diets, tend to be cheaper per unit of energy than low-energy-dense foods and diets( Reference Drewnowski 8 , Reference Andrieu, Darmon and Drewnowski 9 ). There is a danger that these observed changes in food purchasing and the increase in dietary energy density could be interpreted as a decrease in the quality of dietary intakes between 2007 and 2012( Reference Douglas, Clark and Craig 10 – Reference Purdam, Garratt and Esmail 12 ) and a negative, or at least a less positive, energy balance. However, purchase data are not the same as consumption data and changes in the types and amounts of foods purchased cannot be directly associated with diet quality or energy balance without considering the pathway from purchase to consumption. Not all foods and drinks purchased are consumed. It should be noted that, in their report, Griffith et al. ( Reference Griffith, O’Connell and Smith 4 ) only refer to energy and diet quality as purchased, not as eaten. The present study examined whether a decrease in energy intake and an increase in energy density between 2007 and 2012, estimated from purchase data, were not present after adjusting for food and drink waste.
In a series of surveys, the Waste and Resources Action Programme (WRAP) estimated the amounts of, and surveyed reasons for, food and drink waste at the household level using data from several sources. (i) Local authority waste audits and WasteDataFlow (a reporting system for waste collected by local authorities) were used to calculate average household waste amounts in eighty local authority areas. (ii) Detailed waste composition from 1800 households in England and Wales that were representative of UK households. Data collection included questionnaires and direct measurement of the amount and type of kerbside waste. (iii) A detailed ‘Kitchen Diary’ completed for one week by 948 representative households, which focused on the reason why each food item was wasted and route of disposal. A description of the food and the amount were also recorded by participants. Weighting of the sample data was performed where appropriate( 13 ). These surveys were conducted between 2006 and 2012, and they allow an estimate of the change in food waste to be made. In some cases only parts of the food purchased is edible, creating losses through unavoidable waste, i.e. ‘waste arising from food and drink preparation that is not, and has not been, edible under normal circumstances, e.g. meat bones, egg shells, pineapple skin and tea bags’( 14 ). There are, however, edible foods that are not consumed that are classed as avoidable food waste, i.e. ‘food and drink thrown away that was, at some point prior to disposal, edible, e.g. milk, lettuce, fruit juice, meat (excluding bones, skin, etc.)’( 14 ). Unavoidable waste is likely to be a fixed proportion of any given food (e.g. the skin of a banana), but avoidable waste is more variable and the weight of total food and drink waste (i.e. unavoidable and avoidable) appears to have decreased, by 19 % per household, between 2007 and 2012, although it still accounts for 260 kg/household per year in the UK( 15 ). Furthermore, the reduction in waste over this time has differed across the spectrum of food energy densities, with the biggest waste reductions tending to be in the less-energy-dense foods such as fresh vegetables and salads, and fresh fruit( 15 ).
The aim of the current study was to test the hypothesis that a decrease in energy intake and energy density, estimated from food and drink purchase data between 2007 and 2012 in Scotland, was not present after accounting for the decrease in food and drink waste over the same period. The secondary aim was to compare the effects of area-based level of deprivation on these changes. The analysis focuses on foods and drinks brought into the home and excludes those that are ‘eaten out’, as these are not recorded by KWP participants for the current data set.
Methods
Analyses were conducted on continuous household consumer data collected by KWP from 2657 households in Scotland in 2007, and 2841 households in 2012, of which 1353 were included in both years. These data are for all foods and drinks purchased and brought into the home, which are scanned and recorded by panel members, but items that are not brought into the home are not included. Panel members scan till receipts and product bar codes of purchases, and items without bar codes (e.g. some fruit and vegetables that are sold loose) are also recorded. Information recorded about each item includes description of the item, weight or volume, price paid, any price or volume promotional discounts applied, date and place of purchase.
Estimation of dietary energy
KWP collects nutritional information from product labels where available and imputes values where these are not available. Approximately 80 % of products included in the current analyses use nutritional information taken directly from product labels, or from food composition tables, with the remainder having a value imputed by KWP from product group averages. For these products, energy values were equalized where only an imputed value was available for 2007 and 2012, and label values were used for both years where one year’s value was imputed. This eliminated any artificial difference in the apparent energy value of foods between 2007 and 2012 caused by differences in estimated energy values of products. Energy values in the nutritional data were checked against; limits of 0 and 3700 kJ/100 g, energy value in kcal (×4·18)±10 %, and non-alcoholic drinks and all foods were checked against the calculated energy from the macronutrient composition ±10 %. Inconsistencies were resolved by comparing values from adjacent years, and by replacing imputed values with label values from other years where possible. Household composition within KWP varies by the number of people and their ages, therefore household energy requirements (and the amount of food needed to be bought each week) will also vary. To account for this, the amount of energy purchased was scaled by the estimated energy requirements of the household members to give an equivalized energy value. These were estimated from the sex and age of each individual, and linked to the Dietary Reference Values for Energy( 16 ). The total estimated energy requirement for each household was calculated from the sum of the individual values per household, and divided by 10·45 MJ (2500 kcal) to give an adult equivalent value, consistent with methods previously published by Griffith et al.( Reference Griffith, O’Connell and Smith 4 ).
Energy density of the food purchased was calculated from the contributions of all foods and milks, but excluded all other drinks (i.e. tea, coffee, water, fruit juices, squashes, sugar-containing drinks and artificially sweetened drinks), based on criteria used by Wrieden et al.( Reference Wrieden, Armstrong and Anderson 17 ) and methods used by the World Cancer Research Fund( 18 ) and the Scottish Government( 19 ) in setting a dietary goal.
Energy density of each household’s diet was calculated from the weight and energy content of all foods and milks purchased and expressed as kJ/100 g.
Estimation of food consumption
Two adjustments were applied to the weights of products purchased to correct for any weight changes during food preparation and cooking, and for food waste. First, a factor to adjust for food preparation weight changes (e.g. the weight increase when dry pasta is cooked, the weight decrease when meat is cooked) and for unavoidable waste (e.g. banana skins) was estimated for each food or drink item using conversion factors from food composition tables( Reference Holland, Welch and Unwin 20 ). An unavoidable waste factor of 10 %, as used previously in comparing intakes from purchase information with Reference Nutrient Intakes( 21 ), was used for foods where it was assumed that there would be some waste but where a measured value was not available( Reference Wrieden, Barton and Armstrong 22 ).
Second, an avoidable waste factor was estimated for each of the 2091 food groups that were defined by KWP for retail purposes by mapping food products on to the categories for which WRAP published waste information, for 2007 and 2012( 23 ). Waste values published by WRAP are given for broad categories for 2007 and 2012, such as the proportion of ‘fresh fruit’ purchased that was uneaten and classified as avoidable waste. Finer categories (such as ‘apples’, ‘bananas’ and ‘melon’) and associated waste factors are published only for 2012. The fine category waste values were estimated for 2007 by scaling the 2012 values using the differences in waste factors for the broad category between 2007 and 2012 (see online supplementary material, Supplemental Table 1). For example, the avoidable waste value for apples in 2012 was 13·1 %, and the avoidable waste values for fresh fruit were 14·0 % in 2012 and 17·3 % in 2007. The estimated waste value for apples in 2007 was calculated to be 16·2 % (17·3/14·0×13·1). The estimated intakes after these adjustments are referred to here as energy ‘as consumed’.
Bigger households tend to waste more food overall, but the amount of food wasted per person is lower than in smaller households( 13 , 15 , 23 , 24 ). To account for this, a final adjustment for the difference in avoidable waste by household size was estimated. Six avoidable waste factors were estimated for households comprising between one and six individuals in the KWP data, with a further factor for households of seven and more individuals( 13 , 15 , 23 , 24 ). The same avoidable waste factor by household size was used for purchases in 2007 and 2012 in the current analysis. These adjustments converted the amounts of foods and drinks as purchased into estimated amounts that were likely to be consumed.
To explore how changes in food purchasing and waste between 2007 and 2012 affected the diets of households with different levels of deprivation, the amount of energy purchased and ‘as consumed’, and dietary energy density purchased and ‘as consumed’, were analysed by groups defined by quintile of the Scottish Index of Multiple Deprivation (SIMD). The SIMD is based on geographic area ranked on a single value calculated from seven domains: current income; employment; health; education skills and training; geographic access to services; housing; and crime( 25 ). Each household’s SIMD was obtained for 2006 (the closest available year to 2007) and 2012 by KWP through data linkage to the Scottish Neighbourhood Statistics database( 26 ). SIMD quintile for some households (n 494) changed between 2006 and 2012, partly because the SIMD ranking changed between the two years and partly because some households moved during this time.
To explore the effects of under-reporting of food purchases on the estimated amount of energy purchased and ‘as consumed’, and on the corresponding energy density of the diet, the analyses were repeated after excluding households reporting energy purchases less than 0·5 times estimated household energy requirements. This will tend to exaggerate the extent of under-reporting as it excludes the unknown contribution of foods and drinks consumed outside the home.
Analysis
Two-sided Student’s t tests were used to test for differences between the amounts of energy purchased and ‘as consumed’, and dietary energy density purchased and ‘as consumed’, between 2007 and 2012. Linear multiple regression using a mixed model approach was used. Mixed models were fitted separately to the outcome variables (energy purchased, energy ‘as consumed’, energy density purchased, energy density ‘as consumed’). In each case the fixed effects were SIMD, year (2007 v. 2010) and an SIMD × year interaction. A random effect term for household, some of which were present in both years and some in only one, was included, leading to variance components for between- and within-household variation. Fixed effects are presented as estimated means, and P values for main effects and interaction terms were obtained from F tests using estimated denominator degrees of freedom. All analyses were carried out using the statistical software package IBM SPSS Statistics Version 23.0.0.0.
Results
Characteristics of households in 2007 and 2012 are presented in Table 1. Mean household size did not change significantly between 2007 and 2012 (P=0·405).
Table 1 Household composition of the Kantar Worldpanel Scottish panel in 2007 and 2012
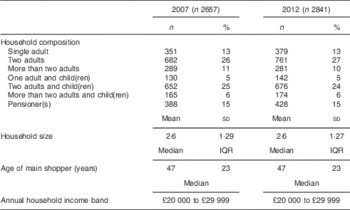
IQR, interquartile range.
Mean daily energy purchased per adult equivalent of all households combined was significantly lower in 2012 than it was in 2007 (P<0·001; Table 2). After adjustment for food and drink waste the estimated daily amount of energy ‘as consumed’ per adult equivalent of all households combined was not significantly different. There was no statistically significant effect of level of deprivation on the decrease in energy purchased or energy ‘as consumed’ between the two years (Table 3). This suggests that, between 2007 and 2012, households across all levels of deprivation bought less energy, but as a result of wasting less food did not lower their energy intakes significantly.
Table 2 Mean energy and energy density, purchased and ‘as consumed’, and their standard errors, by households in the Kantar Worldpanel Scottish panel in 2007 and 2012
P values are from the two-sided Student’s t test for differences for continuous variables. Authors’ calculations from Kantar Worldpanel data.
Table 3 Mean energy and energy density, purchased and ‘as consumed’, and their standard errors, according to quintile of level of deprivation, by households in the Kantar Worldpanel Scottish panel in 2007 and 2012
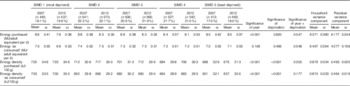
SIMD, Scottish Index of Multiple Deprivation.
Estimates were obtained from two-level random-intercept multivariable linear regression, with an interaction term between year and deprivation.
Authors’ calculations from Kantar Worldpanel data.
Mean energy density of the household foods purchased, and ‘as consumed’, was slightly, but significantly, higher in 2012 than in 2007 (P=0·010 and 0·022, respectively; Table 2). Dietary energy density, both as purchased and ‘as consumed’, increased significantly with increasing level of deprivation (from quintile 5 to quintile 1 of SIMD; both P<0·001), as shown in Table 3. After controlling for the effects of level of deprivation, the effect of year was also statistically significant; dietary energy density, both as purchased and ‘as consumed’, was higher in 2012 than in 2007 (both P<0·001) but there was no interaction between the level of deprivation and year (P=0·205 and P=0·177 for purchased and ‘as consumed’, respectively). This suggests that although households in more deprived areas reported more energy-dense purchases, changes in reported purchases increased dietary energy density between 2007 and 2012, and that the changes were similar across levels of SIMD.
When households reporting estimated energy purchases less than 0·5 times estimated energy requirements were excluded from the current analyses, patterns of differences in the amount of energy ‘as consumed’ and dietary energy density were unchanged (see online supplementary material, Supplemental Table 2).
Discussion
The present study explored whether the decrease in the amount of energy purchased per person in Scotland between 2007 and 2012 could, at least in part, be accounted for by the decrease in food waste over the same period. Results suggest that this is the case; after adjusting for changes in food waste, estimated mean daily energy intakes did not change greatly over this time. This finding was consistent across households of different levels of deprivation. These results add to the existing literature by bridging the gap between the decrease in food and drink purchases and consumption using contemporary food and drink waste data.
The decrease in energy purchased between 2007 and 2012 is consistent with previous studies. The energy content of reported food and beverage purchases in the Living Costs and Food Survey fell by 3·0 % for those consumed at home and 4·8 % when foods and beverages consumed outside the home were included( 2 ). This decrease may not be solely because of rising food prices over this time, however. Energy purchased fell by 3·7 % per person over a similar number of years between 2001/02 and 2007, continuing a downward trend that started in the 1960s( 2 ). In examining consumer panel data collected in the USA, Ng et al. calculated that the significant decrease in energy purchased between 2000 and 2011 was independent of any effect of the recession or changes in food prices( Reference Ng, Slining and Popkin 27 ). Unfortunately, information on the changes in amount of foods and drinks wasted in the USA over the same time period was not available.
Therefore, it appears that part of the decrease in energy purchased that occurred over the period of rapid price increases is attributable to the general, long-term, downwards trend. This decrease in energy purchased needs to be considered alongside the increase in obesity prevalence in the UK, the drivers of which are complex, multifactorial and much debated. Although the amount of energy purchased has fallen, levels of physical activity have also fallen, for example, and probably by a greater amount( Reference Millward 28 ). The analysis conducted here suggests that reduced food waste has also contributed to reducing food, and therefore energy, purchases since 2007.
Energy density
Mean energy density of foods purchased was slightly higher in 2012 than in 2007, with an increase of 0·9 % for all households combined. This is inconsistent with change in dietary energy density over this time from similar studies in the UK, although the different findings may reflect the different methods used in adjusting for food waste and in calculating energy density. For example, in similar household purchase data in Scotland from the Living Costs and Food Survey, no change in dietary energy density between 2001 and 2012 was seen( Reference Wrieden and Barton 29 ). Purchase data were adjusted for food waste; however, the same waste factors were used for both years and the decrease in food waste over time was not accounted for, which in part may account for the lack of difference observed. Both this and the current analyses calculated energy density after excluding the contribution of drinks( Reference Wrieden, Armstrong and Anderson 17 ). Energy density of purchases, based on KWP data for the whole of Great Britain, appeared to increase by considerably more than in the current study, by 4·8 % between 2005–2007 and 2010–2012( Reference Griffith, O’Connell and Smith 4 ). It is unclear whether this included drinks in the calculation of energy density, but as the amount of soft drinks and alcoholic drinks purchased in the UK fell between 2009 and 2012( 2 ) their inclusion could account for this apparent increase in energy density. The reduction in food waste was not by the same proportion across all food groups, with the greatest reduction being in food groups having medium energy densities (e.g. bakery products) or low energy densities (e.g. fresh fruit, fresh vegetables and salads)( 13 ). If consumption of these food groups remained more or less the same over the recession, but less of these foods was wasted, then less of the lower-energy-density foods would need to be purchased and this would therefore contribute towards the increase in average energy density of foods purchased.
Seemingly, the differences in reported change in dietary energy density over time may reflect the different methods used in adjusting for food waste and in calculating energy density, and it is unclear whether the average energy density of foods purchased has changed much over the period of rapid price rises. This does not mean that overall diet quality is unchanged, however, as more comprehensive summary measures of overall diet quality showed that the nutritional quality of foods purchased did decrease over this time( Reference Griffith, O’Connell and Smith 4 ). At about 700 kJ/100 g, energy density is considerably higher than the Scottish Dietary Goal of 125 kcal/100 g (523 kJ/100 g). Recent changes to the types of foods purchased appear to have resulted in little improvement at best, and probably moved average energy density further from the Scottish Dietary Goal.
Energy density and level of deprivation
Households in more deprived areas reported food purchases that had a higher average energy density than did households in less deprived areas; indeed, there was a linear relationship between quintile of deprivation and energy density of purchases. The same relationship was also reported in the Scottish data of the Living Costs and Food Survey( Reference Wrieden and Barton 29 ). This was not unexpected as more energy-dense foods tend to cost less than foods of lower energy densities( Reference Drewnowski and Darmon 30 ) and energy density tends to be inversely related to estimates of income in other populations( Reference Monsivais and Drewnowski 31 , Reference Aggarwal, Monsivais and Cook 32 ). There was, however, no effect of deprivation on the increase in energy density between 2007 and 2012, which might have been expected as lower-income households, and especially those on very low incomes, are more likely to be affected by rising prices because a bigger proportion of their equivalized income is spent on food( Reference Douglas, Ejebu and Garcia 33 ). It could be hypothesized that households on low incomes would show the greatest response to increasing prices, including a greater decrease in food waste and a greater switch to purchasing foods of higher energy density. However, household income contributes only partly to the SIMD ranking and households in more deprived areas may not necessarily have less money to spend on food than households in less deprived areas. WRAP shows only small differences in food waste per person across households of differing occupations (as a proxy estimate of income)( 23 ). Furthermore, the KWP does not include many very-low-income households (those in poverty) who are likely to be more at risk of being in food poverty, which is ‘the inability to acquire or consume an adequate quality or sufficient quantity of food in socially acceptable ways, or the uncertainty that one will be able to do so’( Reference Dowler 34 ). Therefore households most likely to be susceptible to rising food prices are probably under-represented in the KWP data. Rising food prices are likely to affect lower-income households more than higher-income households. As SIMD quintiles are based on a ranking of deprivation, to which income is only one contributing factor, it provides a relative rather than an absolute level of deprivation. Therefore, it is possible that falling levels of relative income would affect lower-income households’ spending on foods and drinks without being reflected in changes in SIMD quintile. Overall, if households with low incomes responded differently to rising food prices between 2007 and 2012 than did households with higher incomes, the data used in the current analyses are unlikely to show it. Clearly any such difference would be important and other research should look for indicators of such patterns.
It is unclear why there has been a reduction in food waste in the UK. WRAP’s ‘Love Food, Hate Waste’ campaign, and the associated increase in media coverage of the problem of food waste, started around the same time (2007) as the sharp increases in food prices. The reduction in household waste could be a response by consumers to increasing prices or increased awareness of food waste or both.
Limitations
The present study is subject to a number of limitations. Calculations of the amount of energy purchased are reliant on secondary data that were collected for different aims, while some of the adjustments to ‘as consumed’ also rely on secondary data collected by WRAP. WRAP identifies the sources of uncertainty in its estimates of food waste, and these include local authority and households sampling issues, measurement uncertainty and change of behaviour by households when they are recording food and drink waste( 13 ). WRAP calculated the 95 % CI from the effects of sampling errors (i.e. excluding any effects of systematic errors) on food and drink waste in the 2007 and 2012 data, and gave the reduction in total waste as 15·4±5·2 % by weight, acknowledging that the confidence intervals were underestimates. The effect of a greater than 15 % reduction in waste would be to increase the estimated amount of energy ‘as consumed’ in 2012 and strengthen the results of these analyses.
Several household factors appear to be correlated with the amount of avoidable food and drink waste including the age of the main shopper, household composition, job status and life stage( 23 ). These were not considered in the current analyses because WRAP does not publish multifactorial values for these, and they are not likely to be independent. It is possible that lower-income households, which are more likely to be in more deprived areas, reduced their waste more than did more affluent households. The strongest correlation with avoidable food and drink waste in the WRAP survey was household size, however, which was used in estimating the amounts of foods and drinks available for consumption from purchases.
The KWP data used for these analyses do not include foods and drinks that were consumed outside the home, or takeaway foods, even if they were brought into the home, and about 10 % of energy intake is therefore not captured( 2 ). KWP members may differ from the general population as they report lower household incomes, are more likely to be middle aged and with a greater proportion of multiple-adult households compared with households participating in the Living Costs and Food Survey( Reference Leicester 35 ). There is evidence that not all food and drink purchases that are brought into the home are recorded( Reference Leicester 35 ). One method of assessing the impact of under-recording of food intake is to repeat analyses after excluding participants reporting low energy intakes, or purchases, relative to estimated energy requirements. When this was done in the current study, the patterns of differences in the amount of energy purchased and ‘as consumed’, and energy density, were largely similar. Therefore, it appears that under-recording of food purchases in the KWP data set did not alter the overall study findings. Related to this is the estimation of household energy requirements, which in the absence of any information on individual activity levels assumes an inactive lifestyle and an energy expenditure of 1·4 times BMR. Any difference in actual energy requirements across age groups (because of higher activity levels in some households or some individuals within a household) would tend to alter the estimated amount of energy available for consumption.
Conclusion
The results of the present study show that accounting for the decrease in waste is important when estimating food and energy intakes from purchase data collected over time. A number of assumptions were necessary to do this and more complete waste information needs to be made available to allow different household characteristics to be accounted for simultaneously. Previous research by others shows that over the period of the recent recession and of rapid price rises consumers bought less foods and drinks while also spending more, resulting in less energy per adult equivalent being bought. They also responded by ‘trading down’ their purchases. The present study suggests that the reduction in energy purchased was countered by reductions in estimated food and drink waste, resulting in no significant change in net energy intake.
Acknowledgements
Financial support: This work was supported by the Scottish Government’s Rural and Environment Science and Analytical Services (RESAS) Division. RESAS had no role in the design, analysis or writing of this article. Conflict of interest: The authors declare that they have no conflicts of interest. Kantar Worldpanel had no role in study design or data analysis. Authorship: S.W. was responsible for formulating the research question and analysing the data. G.W.H provided statistical advice. S.W., J.I.M. and G.W.H. contributed to the preparation of the manuscript. Ethics of human subject participation: Not applicable.
Supplementary material
To view supplementary material for this article, please visit https://doi.org/10.1017/S1368980016003256


