


Chromium (Cr3+) is an essential trace element functioning in glucose and insulin metabolism and is associated with age-related chronic diseases including diabetes and CVDReference Anderson and Watson1, Reference Anderson2, Reference Cefalu and Hu3. Cr also acts in regulating corticosteroid metabolismReference Ravina, Slezak, Myrsky, Bryden and Anderson4, is postulated to decrease losses in bone density and lean body massReference Anderson5 and protects against the loss of cognitive function in the elderlyReference Smorgon, Mari, Atti, Dalla Nora, Zamboni, Calzoni, Passaro and Fellin6. Moreover, Cr also acts both as an insulin potentiating factor and antioxidantReference Anderson, Roussel, Majhoub, Zouari, Matheau and Kerkeni7, Reference Cheng, Lai, Hou and Huang8 and could, therefore, counteract the increased oxidative stress associated with insulin resistance in the elderly.
Cr status declines with ageReference Davies, McLaren, Hunnissen and Howard9 in relation to lower energy intake, change in food patterns, decreased absorption or increased Cr lossesReference Mertz10. Marginal Cr deficiencies in this population may lead to an increased risk of the metabolic syndrome, diabetes, CVD, may go undetected and contribute to morbidity and even mortality. In the USA and Europe, few studies have measured Cr intakes in the general population and none has focused on the determination of food Cr content and intake in French elderly people. Therefore, the objective of this study was to provide missing data about the food Cr content and intakes in French aged free-living subjects and to investigate the possible relationships between the level of these intakes and the biological parameters involved in the glucose–insulin system and oxidative stress. We analysed the individual food Cr contents and daily Cr intakes from freely chosen diets for 3 d in French free-living elderly people and determined their Cr excretion and plasma hormonal related variables including insulin, leptin and cortisol. In association with the relationship between insulin resistance and oxidative stress, we also measured plasma lipid peroxidation as thiobarbituric acid reactive substance, plasma protein oxidation as plasma thiol groups and blood total and reduced glutathione.
Experimental methods
Patients
Twelve autonomous free-living volunteers (8 women and 4 men) aged 70 to 85 years participated in the study. They were recruited in Valence Hospital Geriatric Centre which has been chosen previously chosen as representative of the French elderly population for investigation in the EURONUT Seneca StudyReference Ferry, Hininger-Favier, Sidobre and Mathey11. The inclusion criteria were defined as French people with usual dietary habits with no specific or regional intakes and representative of French dietary habits, no trace element and antioxidant supplementation 3 months before the study, BMI between 22 and 30, non smoking, < 30 g/d alcohol consumption for men and < 20 g/d for women, no severe pathologies (cancer, CVD, stroke), no surgery within 3 months of the study, no diabetes, creatininemia >30 μmol/l, no alanine aminotransferase, aspartate aminotransferase and gamma-glutamyl transpeptidase greater than three times the physiological values.
To compare the biological data between older and younger subjects, blood and urine samples were also obtained from young healthy French subjects (n 9, three males and six females), 25–35 years old, using the same criteria of inclusion and same methodology for determination of biological parameters. The Ethical Committee approved the study, and each volunteer signed an informed consent. Subjects were not compensated for their participation.
Food collection and analyses
Food records for three consecutive days were analysed and the Cr content of all food (breakfast, lunch, snacks, dinner and beverages) was determined. Beverages and foods were analysed as consumed. Food weight estimation was evaluated as eaten and by serving using the validated SUVIMAX French food evaluation guideReference Savanvitch, Deschamps, Arnault, Castelbon, Bertrais, Menne and Hercberg12. Cr contents of 108 daily meals were analysed. Samples were collected in polyethylene containers, weighed and homogenised in a blender fitted with low-Cr steel blades to minimise Cr contaminationReference Anderson, Bryden and Polansky13. A composite human diet sample, RM 8431, with a certified value of 102 (sd6) ng Cr/g (NIST, US Department of Commerce, Gaithersburg, MD), was used as an analytical check on the accuracy of the results. Under our conditions, we obtained a Cr concentration of 110 (sd9) ng/g. We also used NIST Bovine Muscle RM 8414 with a certified value of 71 (sd38) ng/g (our value was 62 (sd13) ng/g). Cr intakes by meal and then by day were calculated given the weight record of the different items. For each participant, values were expressed as the mean of 3-d Cr intake (μg/d) with standard deviation.
Analyses
Urine samples were collected after a 12 h overnight fast. Second morning void urine was collected using sterile polyethylene snap-lid containers (Fisher Scientific, Pittsburgh, PA, USA). Samples were kept on ice, and stored at − 20°C before analysis.
Blood was collected after a 12 h overnight fast and centrifuged for 30 min at 2000 g. After centrifugation, serum was stored at − 20°C before analysis.
Urinary chromium
Urinary Cr was analysed by graphite furnace atomic absorption using an AAnalyst 800, (Perkin-Elmer Corporation, Norwalk, CT, USA) using end capped graphite tubesReference Anderson, Bryden, Polansky and Reiser14. Two pooled urine samples, whose Cr concentrations had been verified by four independent methods, were assayed at least twice daily to validate the analytical reliability of the urinary Cr concentrationsReference Anderson and Kozlovsky15. Data were expressed as ng Cr/mg creatinine with standard deviation. Cr content of foods was analysed using the same instrumentReference Anderson and Kozlovsky15.
Related hormonal variables
Cortisol, insulin and leptin were measured by ELISA (American Laboratory Products Co., Windham, NJ, USA).
Oxidative stress parameters
Lipid peroxidation was measured by thiobarbituric acid reactive substance concentrations in the plasmaReference Richard, Portal, Meo, Coudray, Hadjian and Favier16. Protein oxidation was determined by measuring the concentration of plasma thiol groupsReference Faure, Lafond, Favier, Cadet, Kalnyanaraman, Fontecave and Pierre17. Total and reduced glutathione levels were measured in plasma as previously described by AkerboomReference Akerboom and Sies18. For this determination, within 20 min of venipuncture, whole blood samples were deproteinized by adding an aqueous solution of metaphosphoric acid (6 %, w/v), then the mixture centrifuged at 2500 g for 10 min at 4°C. The acidic protein-free supernatant fractions were stored at − 80°C until analysis.
Statistics
Statistical treatment of data was completed using Statistica Statistical Software, Paris, France, and SAS, SAS Institute, Cary, NC. Results are expressed as mean values with standard deviations. Biological variable mean comparisons between the groups were tested for significance by Student's t test. Statistical significance was set as P < 0·05. Pearson's correlation analyses were performed to establish the relationship between Cr intakes and key variables.
Results
Cr content of foods and daily Cr intakes
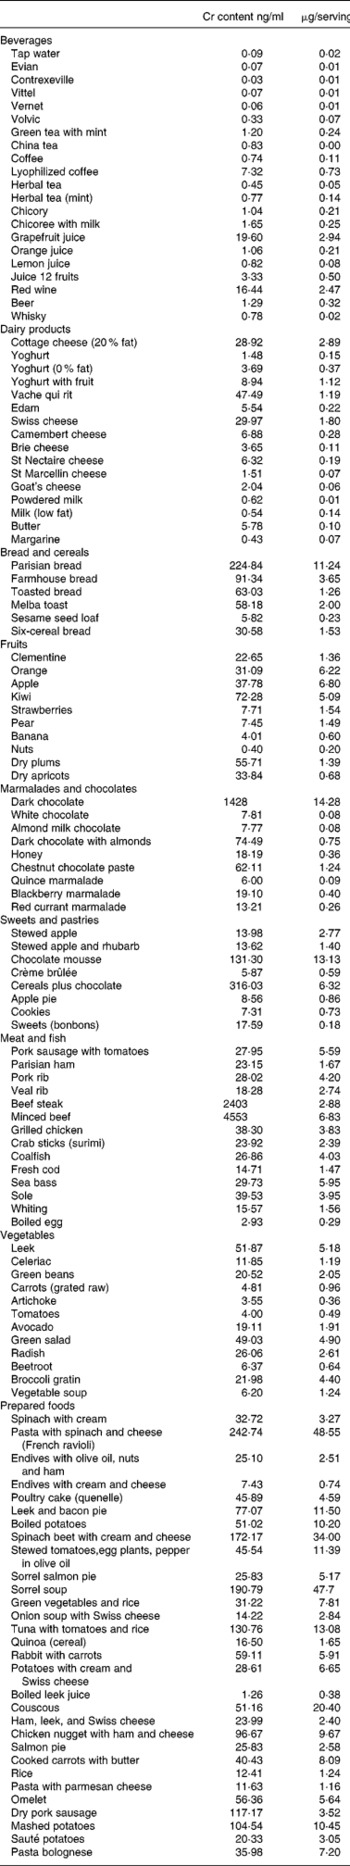
The Cr content of foods and beverages, freely chosen and consumed for three consecutive days, is shown in Table 1. With the exception of special food items such as dark chocolate, Parisian bread or some prepared foods, most of the foods contained Cr below 100 μg/kg.
Table 1 Chromium content of food and beverages
The mean energy intake was 7280 kJ/d (1742 kcal/d) for men and 6580 kJ/d (1575 kcal/d) for women. Expressed as percentage of the total energy intake, carbohydrates represented 43·8 % in men and 46·5 % in women, proteins as 17·1 % in both men and women, and lipids as 39·1 % in men and 37·6 % in women. Mean Cr daily intakes were 40·2 (sd 13·9) μg (Table 2) without a significant difference due to gender or age (> or < 75 years old). All the mean Cr individual intakes except one were below the French RDA for adults (60 μg/d) and 50 % were below two-thirds of this RDA. Moreover, considering the recommendations of the French Geriatric Board for optimal Cr intake for people over 70 yearsReference Cynober19, which recommends 125 μg/d, all the measured intakes were below two-thirds of this level and 50 % below one-third of this level.
Table 2 Daily energy and chromium intakes and contributions of different meals
Chromium excretion and related hormonal variables
Urinary Cr excretion was similar in the older group compared with younger (0·15 (sd 0·05) v. 0·14 (sd 0·02) ng/mg creatinine; Table 3). When we analyzed the data for Cr concentration directly to minimize for changes in creatinine excretion related to ageing, there were also no significant differences between the groups. Fasting insulinemia was significantly higher in the elderly group than in younger subjects while, in the elderly, fasting glycemia remained in the physiological range (1·1 (sd0·1) g/l). Plasma leptin and cortisol were not different between the two groups. We found a negative correlation between Cr intakes and BMI (r − 0·28; P < 0·06), fasting insulin (r − 0·56; P < 0·04) and leptin (r − 0·46; P < 0·04).
Table 3 Urinary Cr excretion and related hormonal variables in elderly free-living French subjects compared with younger French subjects (Mean values and standard deviations)
Mean value was significantly different from the younger group: *P < 0·05.
Oxidative stress parameters
There were no significant differences in oxidative stress parameters between the two groups except for plasma thiobarbituric acid reactive substance levels which were higher in older than in younger subjects (P < 0·05) and weakly correlated (r 0·11) to insulin plasma levels (Table 4).
Table 4 Oxidative stress parameters in elderly and younger subjects (Mean values and standard deviations)

GSHt, total glutathione; GSSG, oxidised glutathione; GSH, reduced glutathione; SH, thiol; TBARs, thiobarbituric acid reactive substances.
Mean values are significantly different from the younger group: *P < 0·05.
Discussion
In this study, despite a well balanced composition of the diets and a fairly good energy intake the Cr nutritional density was very low, in relation to the low Cr content of the selected foods. More than 90 % of the self-selected diets did not reach the French RDA for adults (60 μg Cr/d), and all were dramatically below the specific recommendations (125 μg Cr/d) for people older than 70 years.
Only limited data on Cr intakes exist for comparison. Moreover, they have been mostly obtained from adults and very few from the elderly. In the USA, the reported Cr intakes in elderly people were lower than those measured in this study (25 to 37 μg/d)Reference Offenbacher, Rinko and Pi-Sunyer20. In younger US adults (22–65 years), Cr intakes were still lower than those measured in the present work, at 23·1 (sd 2·9) μg/d for women and 38·8 (sd 6·5) μg/d for menReference Anderson, Bryden and Polansky21. In Europe, low levels of Cr intakes, similarly to our data, were found for most countries. In Finland, Sweden and Switzerland, the intakes were approximately 50 μg/d or lowerReference Kumpulainen22. They have been evaluated at 53 (sd 31) μg/d in BelgiumReference Van Cauwenbergh, Hendrix, Robberecht and Deelstra23, 60–90 μg/d in PolandReference Marzec24 and, in Germany, Cr recommendations were nowhere near reached in the daily diet from nursing homes for the elderlyReference Stelz, Lindemann, Wojke, Erbe, Schulter, Muskat, Most and Pallauf25. Higher Cr intakes have been also reported as 96·4 μg/d in Canadian free-living women aged 66·2 yearsReference Gibson, Mc Donald and Martinez26, 143 μg/d in Greek adultsReference Bratakos, Lazos and Bratakos27, and 129 μg/dReference Garcia, Cabrera, Lorenzo, Sanchez and Lopez28 or 88·3 μg/dReference Bocio, Nadal and Domingo29 in Spanish adults. In French young adults, 154 μg/d was measured using duplicate meals purchased from catering establishmentsReference Noel, Leblanc and Guerin30 or 98 μg/d from food usually eaten in FranceReference Biego, Joyeux, Hartemann and Bebry31. Some of this variation might result from discrepancy in the average daily energy levels as well as methodological differences in the collection and analyses of the diets. Compared with the literature, our data are in the lower range of values reported in Europe for adults but higher than those measured in the USA. They confirm previous observations showing that it is practically impossible to reach the optimal intakes of Cr if the total energy intake remains below 2500 kcal/d (10450 kJ)Reference Anderson32. Regarding biological parameters, Cr excretion was not different between the two groups and was similar to the values measured previously in French healthy post menopausal womenReference Bureau, Anderson, Arnaud, Rayssiguier, Favier and Roussel33 and in American elderly subjectsReference Anderson34. Insulin plasma levels were higher in older than in younger subjects. The increased level of insulin with ageing is well documentedReference Preuss35 and the negative correlation between Cr intakes and insulin, underlines the role of Cr in insulin sensitivity.
In the presence of Cr, much lower amounts of insulin are required and the insulin sensitivity is improvedReference Anderson2.
In this study, lipid peroxidation was significantly increased in older participants. In agreement with this observation, a positive correlation between age and plasma thiobarbituric acid reactive substance levels has been reportedReference Junqueira, Barros, Chan, Rodrigues, Giavarotti, Abud and Deucher36 and numerous studies have pointed out an increased lipid peroxidation in elderly subjectsReference Maugeri, Santangelo, Bonanno, Testai, Abbate, Lo Giudice, Mamazza, Pugllsi and Panebianco37. By decreasing high levels of insulin and preventing auto-oxidation of glucose, Cr may act as an indirect antioxidant. Recent interventional trials have reported the antioxidant effects of Cr supplementation in people with type 2 diabetesReference Anderson, Roussel, Majhoub, Zouari, Matheau and Kerkeni7, Reference Cheng, Lai, Hou and Huang8. In contrast, plasma thiol groups, oxidation of which is an early determinant of oxidative stressReference Balcerezyk and Bartoz38, were not significantly modified in older subjects while protein oxidation is generally reported to increase during ageingReference Kasapoglu and Özben39.
The present study clearly shows that even though free-living elderly French subjects have good dietary habits and consume well-balanced diets, their daily Cr intakes are dramatically lower than the French recommendations. The analyses of the food Cr content demonstrate that low Cr intakes are due mainly to the low Cr density of foods. The potential needs of Cr supplementation in the elderly in France is still a matter of debate since some studies failed to demonstrate a beneficial effect of Cr supplementation in the elderlyReference Offenbacher, Rinko and Pi-Sunyer20, Reference Uusitupa, Mykkanen, Siitonen, Laakso, Sarlund, Kolehmainen, Rasanen, Kumpulainen and Pyorala40. French RDA for Cr is similar for adults and older personsReference Martin41. Specific recommended intakes for the elderly should move from avoiding deficiency status to preventing chronic diseases.
In conclusion, future research along these lines is needed to establish specific Cr requirements for the elderly especially as dietary patterns change to include less refined high-sugar and high-fat foods which are not only low in Cr but also enhance Cr lossesReference Anderson, Bryden, Polansky and Reiser14.
Acknowledgements
We are very grateful to Labcatal Pharmaceutical (7 Rue Roger Salengro, BP 305, 95 541 Montrouge Cedex, France) for support of the study.


