Over the years, unhealthy foods with increasingly large portion sizes have been among the most popular products of fast-food chains and restaurants, and people often eat more than they need without being aware of the extra energy intake. Constructing an effective tool that quickly informs people of the amounts of energy and nutrients in a plate of food at the dining table, i.e. allowing them to eat with quantitative dietary knowledge, is highly significant in public health.
As the mobile and electronic technologies advance, numerous smart wristbands (e.g. Fitbit wristband) and watches (e.g. Apple Watch) have become available for quantitative physical activity assessment( Reference Jeran, Steinbrecher and Pischon 1 – Reference Taraldsen, Chastin and Riphagen 4 ). As a result, these devices have been used widely by the public to gauge their level of exercise, such as the distance walked and the energy expended. In contrast, there is currently no convenient way for an individual to know the energy content in a plate of food before it is consumed. Currently, to determine the energy intake of an individual, a self-reporting procedure to a dietitian is the most utilized method. This subjective method is not only unreliable and inaccurate, but also very burdensome, costly and time-consuming for both the individual being assessed and the assessor. To innovate dietary assessment, several electronic approaches have been developed. Piezoelectric sensors and microphones have been developed to measure chewing and swallowing during eating events( Reference Päßler and Fischer 5 – Reference Hoover and Sazonov 9 ). However, these sensors may not be suitable for long-term use in people’s daily life. Electronic sensors have been embedded within utensils, such as plates and mugs, to weigh the food or beverage( Reference Nørnberg, Houlby and Jørgensen 10 ); these novel methods monitor eating automatically. However, their utility is limited due to the required use of specially made utensils. Wearable cameras have been used to reduce dietary assessment error in 24 h dietary recalls( Reference Gemming, Doherty and Kelly 11 ). However, existing commercial body-worn cameras are not well suited for dietary assessment because they are mostly designed for public security or entertainment purposes. To conduct objective dietary assessment, the eButton, a small wearable device worn in the upper chest area, has been developed( Reference Sun, Burke and Mao 12 , Reference Sun, Burke and Baranowski 13 ). The eButton has a specially designed camera with a large field of view (up to 170°) and an appropriately tilted lens to observe food on a table. Although the eButton can conduct dietary assessment objectively, it is more suitable for dietary research than everyday use, mainly because people near the device may be accidently recorded and the wearer may forget to turn it off during private events. These problems can be controlled by pre-filtering data using advanced computational algorithms (e.g. deep learning-based eating recognition( Reference Mezgec and Korousic Seljak 14 – Reference Jia, Li and Qu 19 )) and specially trained people( Reference Beltran, Dadabhoy and Chen 20 ). However, these methods cannot be adopted easily in non-research applications.
Nowadays the smartphone has become the most ubiquitous personal electronic device. A recent survey indicated that 77 % of Americans now own a smartphone, up from 35 % in 2011( 21 ). Dietary assessment using the smartphone has been previously investigated( Reference Gemming, Utter and Ni Mhurchu 22 – Reference Steele 26 ). Food pictures provide an excellent means to refresh people’s memory about their dietary intake, and motivated people have formed social media groups to exchange food pictures and discuss their dietary experience (e.g. ‘Food’ in Facebook( Reference Stumbo 24 )). However, when smartphone pictures are used to evaluate energy/nutrients quantitatively, a number of limitations exist: picture taking must be volitionally initiated by an individual for each plate of food; two pictures are needed when there is a leftover for volume subtraction; it is difficult to use this method if multiple people fetch food from shared containers; and the process of picture taking may disrupt normal eating habits. Despite these problems, considering the widespread availability of the smartphone, we believe that this device is currently the most practical tool for self-motivated food energy/nutrient analysis in real life.
Obtaining the energy/nutrients from a food image requires two important pieces of information: food name and food volume. There are several ways to let the smartphone know the food name, such as speech recognition of the user’s announcement( Reference Puri, Zhu and Lubin 27 , Reference Hardesty 28 ) and deep learning-based computer vision( Reference Mezgec and Korousic Seljak 14 – Reference Christodoulidis, Anthimopoulos and Mougiakakou 17 ). In addition to food name, the volume, or portion size, of the food must be entered into a food database to determine energy and nutrients. The volume problem is more difficult because: (i) the ordinary food image does not have a dimensional reference, preventing the size of the food from being gauged; and (ii) the two-dimensional image lacks information about the three-dimensional surface of the food which defines its volume.
Currently, the dimensional reference is obtained by using a fiducial marker that must be present in a food picture. Clearly, this is a very strong requirement. Many objects have been suggested as fiducial markers, including: (i) a colour checkerboard( Reference Khanna, Boushey and Kerr 29 ); (ii) a business card( Reference Ashman, Collins and Brown 30 , Reference Pendergast, Ridgers and Worsley 31 ); (iii) a specially designed physical cube( Reference Bucher, Weltert and Rollo 32 , Reference Bucher, Rollo and Matthias 33 ); (iv) a circular plate of a known diameter( Reference Jia, Yue and Fernstrom 34 ); (v) a specially designed tablecloth( Reference Boushey, Kerr and Wright 25 ); and (vi) a laser-generated pattern or mesh( Reference Yao 35 , Reference Langston 36 ). Methods (i) to (iii) require people to carry a physical object and place it beside the food before taking the picture; methods (iv) and (v) require special dining setups; and method (v) requires a complex laser device attached to the smartphone.
A common approach to estimating food volume is by human visualization. This method is often used when the fiducial marker is missing, such as in the case of a finger food. To achieve better accuracy, a wireframe volume estimation method was developed( Reference Zhang 37 – Reference Chen, Jia and Yue 40 ). Since a two-dimensional image does not carry the complete three-dimensional information, the observed food is assumed to have a specific shape, such as a cuboid, wedge, cylinder or partial ellipsoid. Once a wireframe shape is selected, the food is fit by scaling in different dimensions until the best fit is visually achieved (Fig. 1). Then, the volume of the scaled wireframe provides a volumetric estimate. This method has been well studied by both our and other groups( Reference Beltran, Dadabhoy and Chen 20 , Reference Jia, Chen and Yue 38 ). The results indicate that the method has a high accuracy when the shape of food and the wireframe are well matched. However, if this condition is not met, the estimation error can be large. In addition, the wireframe method is ineffective when multiple foods occlude each other or are mixed.
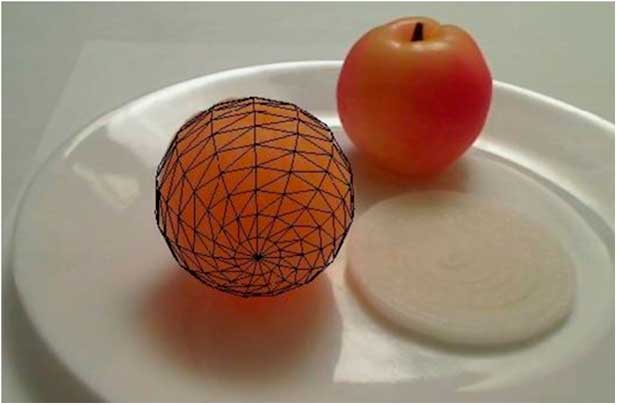
Fig. 1 (colour online) Wireframe method for food volume estimation
In the current paper, we present a new smartphone-based dietary evaluation method that does not require the use of any fiducial marker placed with food. Instead, the length (or the width) of the smartphone itself is used to calibrate the imaging system. We also present a new interactive portion size estimation method based on virtual reality technology, where a virtually generated cube is used as the unit of estimation. Instead of finding a numerical value of the food volume by comparing the sizes of food and cube, which is mentally demanding, we ask the estimator to scale the cube up or down until the volumes of the cube and the food are visually equivalent. This scaling procedure can be easily and quickly performed on the smartphone screen by sliding two fingers inward or outward. To gauge the estimation error for the estimator, we also present an automated training procedure to evaluate the individual’s skill level. These new technologies will allow people to perform table-side estimation of energy and nutrients before making a dietary decision.
Methods
In this section, we first present a fiducial-marker-free method to calibrate the camera system. Then, a virtual reality method for food volume estimation is described.
Calibration of imaging system
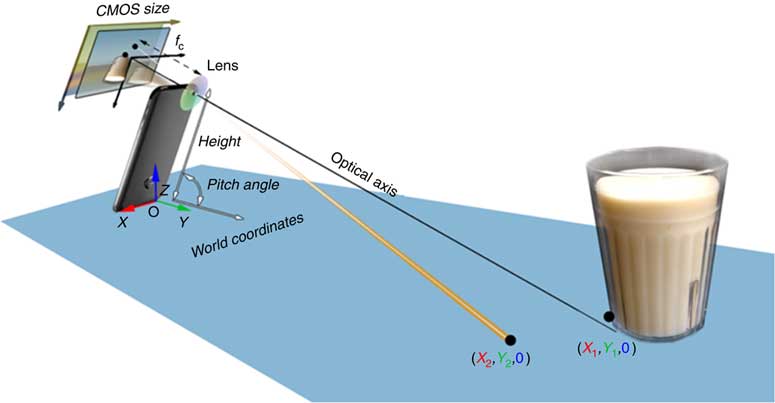
The key concepts that enable us to eliminate the external fiducial marker are: (i) making use of the motion sensor within the smartphone to determine camera orientation; (ii) utilizing the length or width of the smartphone to uniquely determine the location of any visible point on the tabletop; and (iii) using a special way to photograph a food (setting the bottom of the smartphone on the tabletop during picture taking, see Fig. 3 below). We show, mathematically, that these concepts provide an adequate calibration of the imaging system, allowing volume estimation of the food on the tabletop without any fiducial marker in the image.
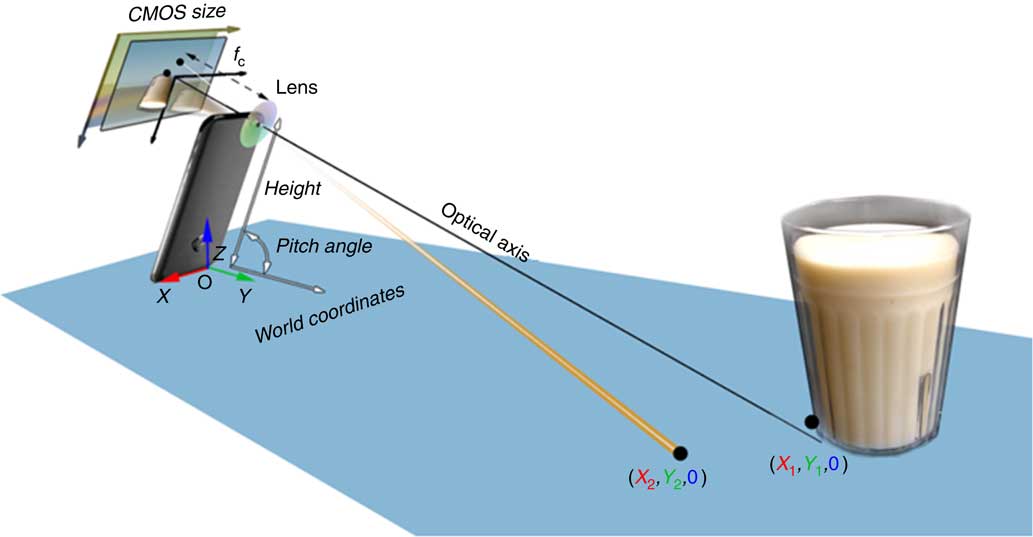
Fig. 3 (colour online) Mathematical model for reconstructing the world coordinates of the tabletop (CMOS, complementary metal oxide semiconductor)
Let us assume that the tabletop is a level surface. The camera within the smartphone, the tabletop and the food on the table form an imaging system, as shown in Fig. 2. For this system, we can establish four coordinate systems, including the world coordinates, camera coordinates, optical image coordinates and pixel coordinates, illustrated in Fig. 2.
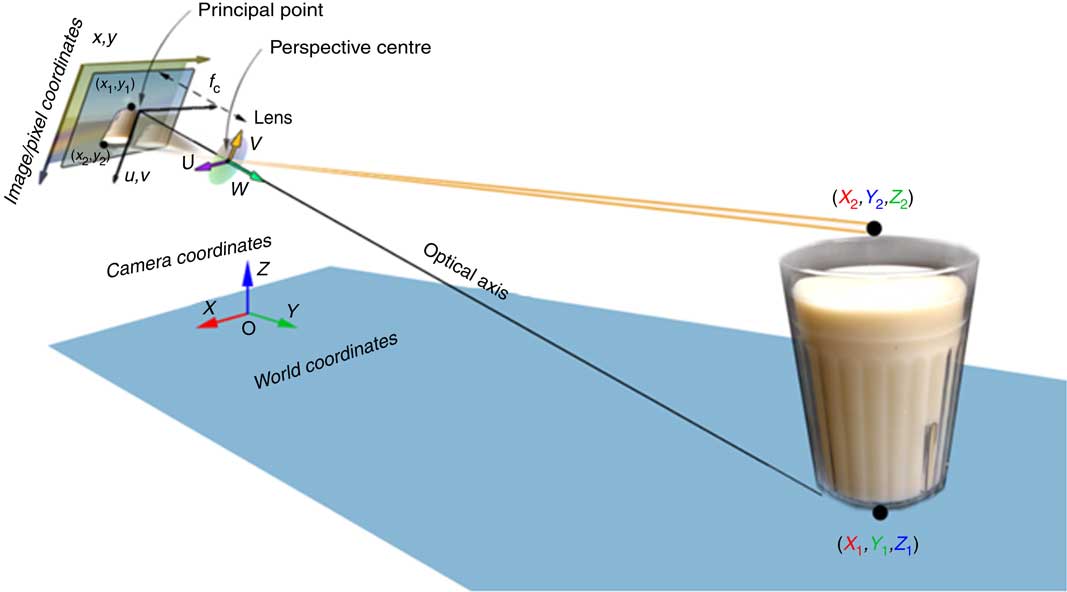
Fig. 2 (colour online) Model of the smartphone imaging system
Let [X, Y, Z]t be the coordinates in the world coordinate system. We define the camera coordinate system [U, V, W]t in such a way that its W-axis is parallel to the optical axis of the lens and its origin is located at the centre of the lens. With these definitions and assuming that the food shape does not change during the estimation process, the relationship between coordinate systems [U,V,W]t and [X,Y,Z]t can be represented as a rigid body transformation( Reference Ma, Soatto and Kosecka 41 , Reference Valkenburg and McIvor 42 ):
 $$\left[ {\matrix{ U \cr V \cr W \cr } } \right]{\equals}\,{\mib{R}} \left[ {\matrix{ X \cr Y \cr Z \cr } } \right]{\plus}{\mib{T}} {\rm ,}$$
where T is a 3×1 translation vector determined by the choice of origin for the world coordinates and R is a 3×3 rotation matrix with its entries being sinusoidal functions of three angles, i.e. pitch θ, yaw φ and roll ψ, given by:
 $$\eqalignno { & {\mib R} \,{\equals} {\rm } \left[ {\matrix{{\cos \varphi \,\cos \psi } & {\sin \theta \,\sin \varphi \,\cos \psi {\minus}\cos \theta \,\sin \psi } \cr {\cos \varphi \,\sin \psi } & {\sin \theta \,\sin \varphi \,\sin \psi {\plus}\cos \theta \,\cos \psi } \cr {{\minus}{\!}\sin \varphi } & {\sin \theta \,\cos \varphi } & } } \right \cr \ &{\hskip 90pt{{\rm }\left {\matrix{ {\cos \theta \,\sin \varphi \,\cos \psi {\plus}{\rm sin}\,\theta \,{\rm sin}\,\psi } \cr {\cos \theta \,\sin \varphi \,\sin \psi {\minus}\sin \,\theta \,\cos\,\psi } \cr {\cos \theta \,\cos \varphi } } } \right] .$$
Note that the values of θ, φ and ψ can be measured using the inertial measurement unit within the smartphone. These parameters determine the orientation, or pose, of the smartphone when the food picture is taken.
Now, let us define the image coordinate system in the imaging sensor plane and the camera coordinate system at the plane of the optical lens. The origin of the image coordinate system is located at the centre of the imaging sensor, which is also the intersection between the imaging plane and the optical axis. Particularly, let the u- and v-axes in the image coordinate system be parallel with the U- and V-axes in the camera coordinate system, and the origin of the camera coordinate system be the centre of the optical lens. Then, the projection from the camera coordinate system to the image coordinate system is given by:
 $$\left[ {\matrix{ u \cr v \cr } } \right]{\equals}\,{{f_{{\mathop{\rm c}\nolimits} } } \over W}\left[ {\matrix{ U \cr V \cr } } \right],$$
where f c is the focal length of the camera.
Within the camera, the optical image of the food object at the imaging plane is sampled digitally by a CMOS (complementary metal oxide semiconductor) sensor, resulting in a rectangular array of pixels as a digital image. We thus perform another coordinate transformation to associate the optical image with the digital image, given by:
 $$\left[ {\matrix{ x \cr y \cr } } \right]{\equals}\left[ {\matrix{ {s_{c}^{x} } & 0 \cr 0 & {s_{c}^{y} } \cr } } \right]\left[ {\matrix{ u \cr v \cr } } \right]{\plus}\left[ {\matrix{ {c_{x} } \cr {c_{y} } \cr } } \right],$$
where c
x
and c
y
are offsets which are the pixel coordinates of the origin in the optical image coordinates, and $s_{c}^{x} $
and
$s_{c}^{x} $
and $s_{c}^{y} $
are scale factors determined by the resolution of the particular imaging sensor.
$s_{c}^{y} $
are scale factors determined by the resolution of the particular imaging sensor.
Combining Eqs (1) to (4), we have a compact form of the coordinate transformation:
 $$\left[ {\matrix{ x \cr y \cr } } \right]{\equals}\,{\mathop{\rm f}\nolimits} \left( {X,\,Y,\,Z} \right).$$
Reconstruction of tabletop coordinates
Eq. (5) provides a mathematical model describing the projection of any visible point in the real world to a specific pixel in the food image. Conversely, given a food image, we are interested in the inverse function of Eq. (5) for the purposes of volume estimation, i.e.
 $$\left( {X,\,Y,\,Z} \right)\,{\equals}\,{\mathop{\rm f}\nolimits} ^{{{\minus}1}} \left( {x,\,y} \right).$$
However, there is a fundamental problem in defining Eq. (6). Because, in general, for surface points on the food, depth W cannot be determined from the two-dimensional image, Eq. (5) is not invertible and thus Eq. (6) does not exist. However, if certain constraints on the imaging system are imposed, Eq. (6) can be well defined, allowing the world coordinates to be reconstructed.
Let us assume that the food image is taken while the smartphone is set on the tabletop as shown in Fig. 3. With the known smartphone orientation provided by the inertial measurement unit, a right angle between the surface of the smartphone and the optical axis, and the projection relationship in Eq. (5), it can be shown (detailed in the Appendix) that the inverse of function f in Eq. (6) exists for the tabletop, i.e.
 $$\left( {X,\,Y,\,0} \right)\,{\equals}\,{\mathop{\rm f}\nolimits} ^{{{\minus}1}} \left( {x,\,y} \right).$$
Note that Z=0 in Eq. (7) represents the plane equation of the tabletop. Since, according to Fig. 3, the angles φ and ψ, which represent yaw and roll, respectively, are both zero, Eq. (2) becomes:
 $${\mib{R }} \,{\equals}\left[ {\matrix{ 1 & 0 & 0 \cr 0 & {\cos \theta } & {{\minus}{\!}\sin \theta } \cr 0 & {\sin \theta } & {\cos \theta } \cr } } \right].$$
From Eq. (4), the world coordinates of the tabletop are related to the pixel coordinates by:
 $$\left[ {\matrix{ u \cr v \cr } } \right]{\equals}\left[ {\matrix{ {1{\rm /}s_{c}^{x} } & 0 \cr 0 & {1{\rm /}s_{c}^{y} } \cr } } \right]\left[ {\matrix{ {x\,{\minus}\,c_{x} } \cr {y\,{\minus}\,c_{y} } \cr } } \right],$$
 $$W\,{\equals}\,{{h \cdot \sin \theta } \over {\cos \theta \,{\minus}\,(v{\rm /}f_{{\mathop{\rm c}\nolimits} } ) \cdot \sin \theta }}, $$
 $$\left[ {\matrix{ U \cr V \cr } } \right]\,{\equals}\,{W \over {f_{\rm{c}} }}\left[ {\matrix{ u \cr v \cr } } \right]$$
and
 $$\left[ {\matrix{ {\matrix{ X \cr Y \cr } } \cr 0 \cr } } \right]{\equals}\,{\mib{R}} ^{{{\minus}1}} \left( {\left[ {\matrix{ {\matrix{ U \cr V \cr } } \cr W \cr } } \right]{\minus}{\mib{T}} } \right),$$
where the derivation of Eq. (10) is included in the Appendix.
We point out that all the parameters in Eqs (8) to (12) are known from smartphone specifications or are available from the output of the inertial measurement unit (containing an accelerometer, a gyroscope and a magnetometer) within the smartphone. For example, for the iPhone 6 Plus, the specifications and calibration parameters used in Eqs (8) to (12) are listed in Tables 1 and 2, respectively.
Table 1 Smartphone (iPhone 6 plus) parameters used in Eqs (8) to (12)

CMOS, complementary metal oxide semiconductor.
Table 2 Calibration parameters used in Eqs (8) to (12) for the smartphone (iPhone 6 plus)
IMU, inertial measurement unit.
Background of food image-based volume estimation
Although Eqs (8) to (12) allow the world coordinates [X, Y, 0]t of any visible points in the tabletop to be reconstructed, the information provided about the food volume is still very sparse because the surface function of the food is unknown except along the observable intersection (if it exists) between the food and the tabletop. Previously, the wireframe method( Reference Chae, Woo and Kim 38 – Reference Ma, Soatto and Kosecka 40 ) solved this problem by assuming that the food shape is close to one of a set of predefined shapes (e.g. cuboid, wedge, cylinder, partial ellipsoid) rendered in deformable wireframes (Fig. 1 and related text). This method produces accurate results for well-matched shapes, but shows only limited performance for complex shaped, obscured, mixed or hand-held foods. In these cases, visual estimation becomes the only way to provide an estimate. This is a difficult task because the estimator must come up with a volumetric value for each food. If the volume is in the unit of cm3 (or equivalently, ml), the value is usually very large and the estimate is not intuitive. Although the ‘cup’ is often used as the unit for measuring real-world foods, it is not very suitable for image-based measures because its height and shape are not standardized, and its mental images differ for different people. In many parts of the world, the Western ‘cup’ is an unfamiliar object.
International food unit
To improve the robustness of food volume estimation from images, we propose to use the International Food UnitTM (IFUTM)( Reference Bucher, Weltert and Rollo 32 ), which is a 4 cm×4 cm×4 cm cube (64 cm3; Fig. 4). The result of food volume measurement is in ‘F’. For example, an apple of 128 cm3 is 2 F. The IFU™ cube can be dyadically divided into 2 cm and 1 cm sub-cubes, in units of ‘dF’ (where ‘d’ follows ‘divided’)( Reference Bucher, Weltert and Rollo 32 ). Thus, 1 F=8 dF=64 ml. The features of the IFUTM, including its cubic shape, dyadic division in length and octave division in volume, appear to be more convenient for human visualization from images than other forms of divisions. In addition, they are also preferred by computer processing because they are parallel to the binary and octave number systems utilized by the computer. The IFUTM has many other attractive properties. First, since it is a cube of known size, its world coordinates (Eq. (6)) are well defined from pixels in images so long as it sits on the tabletop, either physically or virtually. Second, although other convex shapes (e.g. a sphere) may also invert Eq. (6), the corners of the cube, when projected into a two-dimensional image, produce a well observable sense of orientation. Third, previously, a significant practical difficulty was to estimate the height of the food from an image when a planar fiducial marker is used. The three-dimensional IFUTM facilitates height estimation significantly by providing a clearly observable height reference. Finally, the IFUTM is connected to both the metric millilitre (1 F=64 cm3=64 ml) and the commonly used cup measures (1 F≈¼ cup, whereas the cup has multiple confusing definitions: 1 metric cup=250 ml, 1 US legal cup=240 ml, 1 US customary cup=236·6 ml and 1 imperial cup=284 ml). Previous studies on IFU™ have shown a significantly higher accuracy in food volume estimation using the IFUTM than the cup for untrained individuals( Reference Bucher, Weltert and Rollo 32 , Reference Bucher, Rollo and Matthias 33 ).
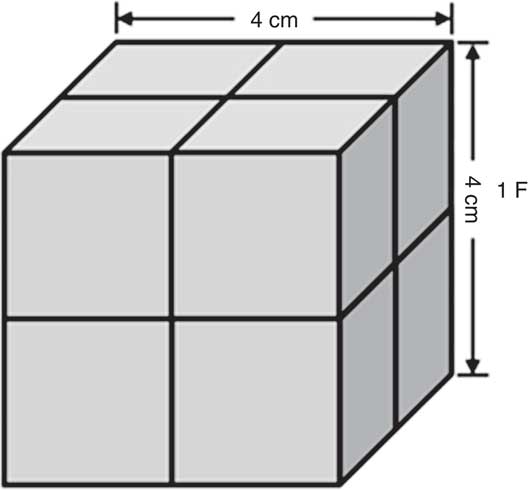
Fig. 4 International Food UnitTM
Volume estimation using the IFUTM
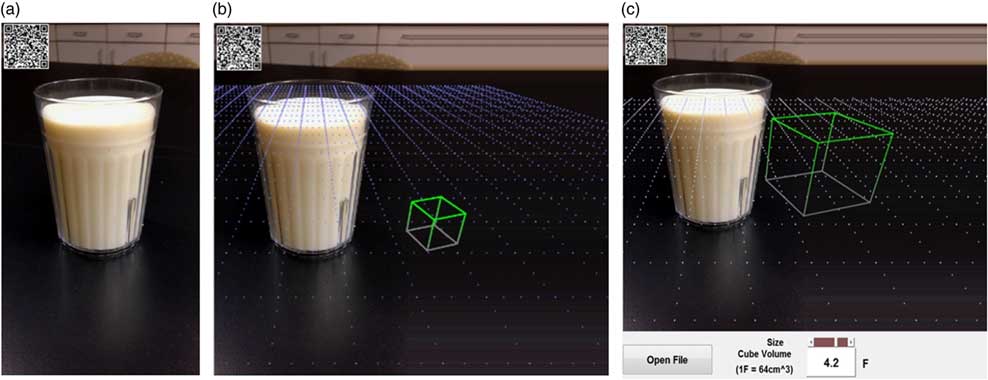
Based on the fiducial-marker-free food image estimation technique and the IFUTM concepts, we present a fast, interactive method for portion size estimation using the smartphone. Since, by Eqs (8) to (12), the world coordinates of the tabletop are known, we can manipulate the image properly and utilize virtual reality technology on the tabletop to assist the estimation task shown in Fig. 5(a). First, we extend the tabletop virtually, thus providing more spaces in the image. Then, we create a virtual ‘tablecloth’ in the form of a grid. The side length of each square in this grid is exactly 4 cm in the world coordinates, the same as the side length of the IFUTM. This grid both marks the location and orientation of the tabletop in the image and provides a scale reference, in both horizontal and vertical directions, for all foods on the table. Next, we place a virtual IFUTM cube on the tabletop. During the estimation process, the estimator moves the cube to a desired place (sliding with one finger on the smartphone screen), scales it (sliding with two fingers in an inward or outward motion), while comparing it side-by-side with any food item of his/her interest until the volume of the scaled cube is visually equivalent to that of the food (what we call ‘volumetric equivalence’ (VE)), as seen in Fig. 5(b) and 5(c).
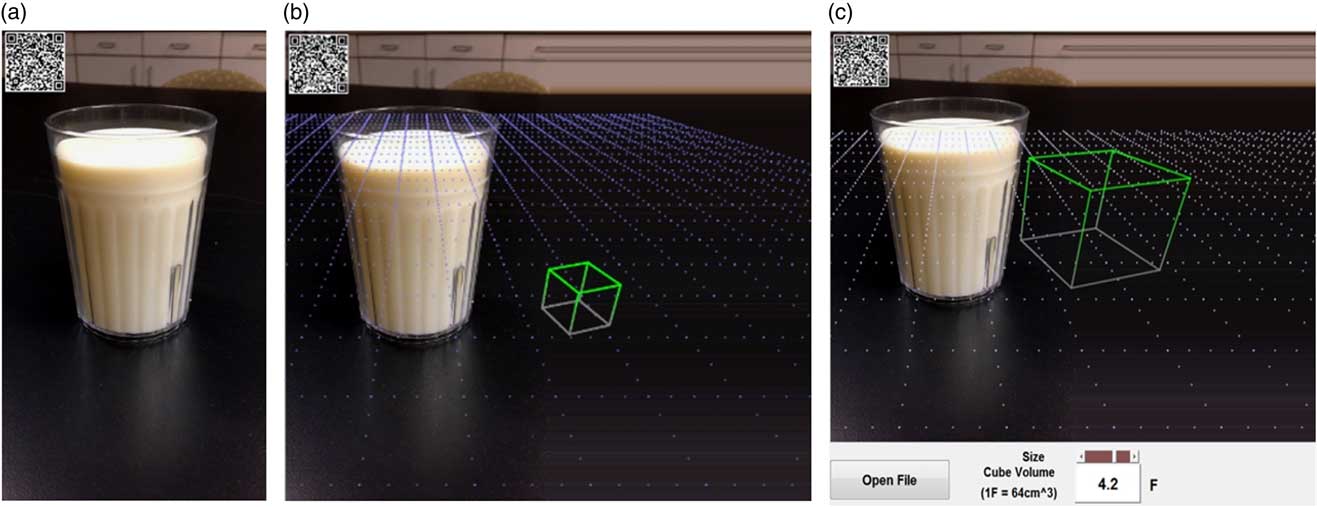
Fig. 5 (colour online) Virtual reality-based volume estimation using the International Food UnitTM (IFUTM): (a) fiducial-marker-free image; (b) extended image with a virtual grid of 4 cm spacing and an IFUTM; (c) final image in which the volume of the scaled IFUTM cube is visually equivalent to the volume of the milk, yielding an estimate of 4·2 F
It is important to point out that we ask the estimator to achieve a VE rather than coming up with a numerical value because, we believe, the VE task is easier than the numerical task for most people, although this assertion still needs a proof. A distinct advantage of the IFUTM approach over the wireframe approach is that it is more robust in handling complex real-world cases, as shown in Fig. 6 where the use of wireframes would be very difficult.
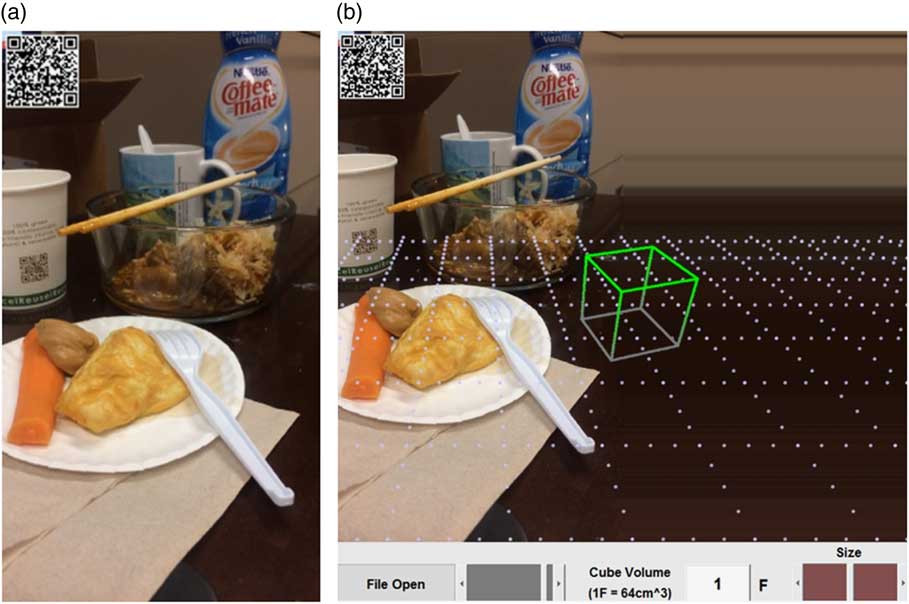
Fig. 6 (colour online) (a) A complex real-world fiducial-marker-free image; (b) extended virtual reality image from which any food item can be estimated by moving and scaling the International Food UnitTM
Nevertheless, to correctly judge VE requires human experience. In practice, a person who has no experience in VE needs to acquire skills, and it is important to gauge a person’s skill level by measuring his/her average portion estimation error. Thus, we propose an automated training process using an app to conduct a set of exercises. The person first estimates the volume of a food in an image, then a feedback with the true volume is provided so he/she can learn from the error. If this error is larger than a pre-set bound (e.g. 20 %), the person will need to retry the exercise until the error bound is reached.
Experiments
We conducted two experimental studies to: (i) compare the effect of training; and (ii) evaluate whether the pre-set error bound for food volume estimation is achieved successfully.
Study 1
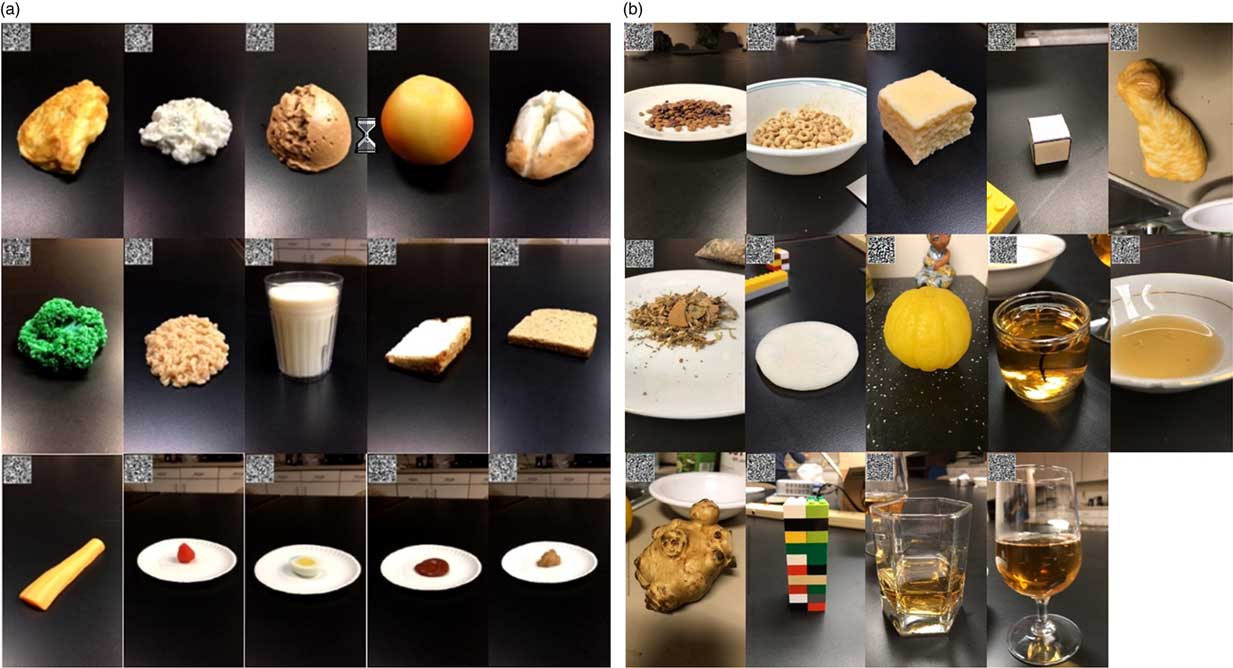
In this experiment, we implemented the described algorithms in MATLAB® with a graphical interface (MathWorks, Natick, MA, USA). Fifteen commercial food models of known volumes (Nasco Life/form® Food Replica; shown in Fig. 7(a)) were used as the test objects. Forty volunteers, who were first- and second-year undergraduate students, participated in the study. These students had never estimated food portion sizes from images. During the experiment, each participant manually adjusted the size of the virtual cube to reach the VE as described previously. At this point, the participant had to click a control bar to move to the next food image.

Fig. 7 (colour online) (a) Fifteen food models tested in both Studies 1 and 2; (b) fourteen foods, beverages and non-food objects utilized for generating forty-five training images in different containers for Study 2. Note that, in each image, the two-dimensional barcode records the motion sensor data at the time of image acquisition
Study 2
In this experiment, twenty-nine volunteers, who were again first- and second-year undergraduate students without experience in estimating portion sizes from images, participated in the study. The same fifteen food models (Fig. 7(a)) were used for tests. However, before the tests, we implemented a training process. We selected fourteen foods, beverages and non-food objects (different from the fifteen foods for testing), as shown in Fig. 7(b). It can be observed that many of these objects or containers have irregular shapes, unsuitable for using the wireframe method. The volumes of the training items were measured using cup measures (for liquids and grains), by water displacement (for submergible ones) or with a ruler (for cuboids). They were photographed in different containers, such as plates, glasses and bowls, resulting in forty-five training images. The training was provided by our self-developed MATLAB software. For each image, the participant scaled the virtual cube until he/she believed that a VE was reached between the food and the cube. Once he/she clicked the ‘submit’ button, the software provided a feedback of the true volume in a message box. If the absolute estimation error was larger than 20 %, the participant had to retry the volume estimation for this specific item until the error was less than 20 %. The participant was asked to estimate as many training images as possible until he/she felt confident about his/her skills for food volume estimation. After training, the test was conducted the same as that in Study 1.
Results
Table 3 lists the name of each food (column 1) and its ground truth volume (ml or, equivalently, cm3; column 2) as measured by cup, water displacement or ruler. For each test with or without training, we list the median, interquartile range (defined as the difference between the medians of the lower and higher halves of the data values after sorting in an ascending order( Reference Eftimov, Korosec and Korousic Seljak 43 )), average absolute error and root-mean-square error. Each of these values was calculated over the number of estimates provided by the research participants. In the last column, we also list the probability of the null hypothesis (i.e. ‘no difference’ with and without training) from the Mann–Whitney U test for each food.
Table 3 Experimental results of the fifteen foods, tested with and without training, using the new approach of fiducial-marker-free image-based food portion size estimation using a smartphone

IQR, interquartile range; RMSE, root mean-square error.
Several important observations can be made from Table 3. First, all the measures indicate that the training process improves volume estimation performance. Second, in fourteen out of fifteen cases (except for egg), there is a statistically significant reduction in the relative error (defined as (estimate – ground truth)/ground truth×100 %) after training (last column). Third, without training, there is a large estimation bias as measured by the median (average 87·97 %). After training, it is nearly eliminated (average −1·14 %).
Figure 8(a) and 8(b) further compare the relative error (with the standard derivation indicated) and the root-mean-square error, respectively. It is noticeable that, from both measures, the errors tend to be much larger in the last few items. These items, which are shown in the last row of Fig. 7(a), have the smallest volumes among the fifteen foods tested, as indicated in the second column in Table 3. The average absolute error is 16·65 % for the first ten foods (calculated from the ninth column in Table 3), indicating that, for these large-volume items, the 20 % error bound was well achieved. On the other hand, for the last five foods, the average absolute error is 47·60 %, indicating that, for these small-volume items, the 20 % error bound was not achieved.

Fig. 8 (colour online) (a) Mean relative error ((estimate – ground truth)/ground truth×100 %) with standard deviation indicated by vertical rules and (b) root mean-square error (RMSE) for each of the fifteen foods tested using the new approach of fiducial-marker-free image-based food portion size estimation using a smartphone: ![]() , Study 1, without training;
, Study 1, without training; ![]() , Study 2, with training
, Study 2, with training
Discussion
One of the desired goals in portion size estimation is to gauge and control, in a statistical sense, the average estimation error. Our pre-training method is, in theory, capable of reaching this goal if the statistical features of food items for training and testing are the same. Our experimental results indicated that this goal was achieved for large-volume foods (average absolute error 16·65 %<20 %). However, it failed for small-volume foods (average absolute error 47·60 %>20 %). Several factors may have contributed to this failure. First, we found that it was difficult to visually judge the VE when the display of the food and the cube was small. Thus, we believe that the excessive error was mainly due to this visual effect. This effect could be corrected by allowing the estimator to manually zoom the display window, so the food and cube appear in normal sizes. Second, our training samples (Fig. 7(b)) lacked small objects with similar shapes to the small foods utilized in the test (last row in Fig. 7(a)). As a result, participants may not be trained adequately for the types of foods tested. This problem can be solved by enlarging the training set properly. Third, in Study 2, we asked the participants to decide by themselves when to stop training. This self-judgement may have also contributed to the large error because some participants may be overconfident in their skills and stopped training too early. A more appropriate stop criterion could be to monitor the participant’s skills by averaging the absolute estimation errors in the past N trials, where N is to be determined empirically, and stopping the training when the average error is below the pre-set error bound.
In our method, the IFU™ played an important role in the algorithm development. We used the cubic-shaped virtual dimensional reference to provide a better visual effect in estimating food volume, especially providing a reference in the height of the food which was not provided previously when using the actual two-dimensional fiducial markers. In addition, the scalable virtual cube allows the use of this new VE concept. We believe that, for most people, the mental task involved in assessing VE is easier than coming up with a numerical number for the volume. However, this assertion is still subject to a solid proof, perhaps by a psychological or experimental study.
Currently, the VE is established manually. However, it is possible to develop an algorithm to initiate this equivalence using a computer and display the computed result for a person to validate or modify. This computational approach could make the table-side food volume estimation both quicker and more accurate.
Clearly, our purpose of computing food volume is to use it for the estimation of energy and nutrients. However, this final step of estimation is not straightforward. There are numerous unsolved problems, such as food/ingredient recognition and food database development/improvement. Despite solving these problems is important, the present work focuses on food volume estimation.
Limitations
Our fiducial-marker-free method for image-based food portion size estimation requires taking the food picture with the bottom of the smartphone sitting on the tabletop. This may become too restrictive in cases where the food is tall, and the single image may not cover the food adequately. In this case, the second image can be taken at an arbitrary position where the view is more desirable. Since some shape and dimensional features of the food have been available in the first image, this image can be used as an important reference while volume estimation is performed using the first image. Alternatively, computational algorithms could be developed to automatically transfer the calibration information from the first image to the second image so that volume estimation can be performed in the same way as that for the first image. Finally, we remark that there are limitations in our experiments. It should be noted that the number of human foods utilized in our study (i.e. sample size) was small, and the sample population (college students) was more educated than the average population. Thus, our subjects were digitally knowledgeable, which may have helped them learn more quickly than the general population in using the computational tools. In addition, we have not yet been able to fully delineate the mechanisms of the large performance difference before and after training. It was likely that different individuals visualized the sizes of objects (including foods) differently, which affected their initial estimates. Further, the colour and contrast of the virtual IFUTM and grid displayed on the computer screen could also be factors affecting the initial estimates, even for experienced computer users. However, we believe that, after repeated training with feedbacks of true food volumes, the individual differences with respect to subject population, visualization of object size and response to computer display will all decrease and likely disappear, in a similar trend as that observed in our experiments.
Conclusion
The present work contributes to the field of smartphone-based food portion size estimation from images by: (i) elimination of the fiducial marker; (ii) achievement of a greater robustness and practical utility by the introduction of new concepts and application of advanced technologies, including the IFUTM, virtual tablecloth, scalable cube as a reference and VE; and (iii) assessment and control of the estimation error using an automated training process. Our methods are suitable for implementation in an app, allowing the smartphone owner to perform table-side estimation of the energy and nutrients of his/her food before making a dietary decision. In the future, the presented technology may be combined with methods for automated food recognition( Reference Eftimov, Korosec and Korousic Seljak 43 ) to quickly search a nutrient database and determine and monitor energy and nutrient intakes.
Acknowledgements
Acknowledgements: The authors acknowledge T.J. Carabuena, A.E. Richards, T.A. Pecarchik, S. Chow and S.A. Duran for their contributions to experimental studies. Financial support: Y.Y. and H.Z. acknowledge a research grant from the National Natural Science Foundation of China (NSFC) (grant number 61571026) and the Ministry of Science and Technology of China (MOST) (grant number 2016YFE0108100); W.J. and M.S. acknowledge the US National Institutes of Health (NIH) (grant numbers R01CA165255 and R21CA172864); T.B. acknowledges financial support from the School of Health Sciences and the Faculty of Health and Medicine of the University of Newcastle, Australia. The NSFC, MOST and NIH had no role in the design, analysis or writing of this article. Conflict of interest: The authors declare no conflict of interest. Authorship: Y.Y., M.S. and W.J. were responsible for research method design, mathematical analysis and experiments. T.B. contributed to experimental design and data analysis. H.Z. contributed to computational development. Y.Y., M.S., W.J. and T.B. contributed to drafting and editing of the manuscript. Ethics of human subject participation: The study was conducted according to the guidelines in the Declaration of Helsinki. Ethics of this study were authorized by the University of Pittsburgh Institutional Review Board.
Appendix
In this section, we explain the derivation for Eq. (10). Let Z=0 which represents the tabletop. According to Eq. (1), we have:
 $$\left[ {\matrix{ U \cr V \cr W \cr } } \right]\,{\equals}\,{\mib{R}} \left[ {\matrix{ X \cr Y \cr 0 \cr } } \right]{\plus}{\mib{T}} ,$$
where
 $${\mib{R}} \,{\equals}\,\left[ {\matrix{ {R_{{11}} } & {R_{{12}} } & {R_{{13}} } \cr {R_{{21}} } & {R_{{22}} } & {R_{{23}} } \cr {R_{{31}} } & {R_{{32}} } & {R_{{33}} } \cr } } \right] $$
and
 $${\mib{T}} \,{\equals}\,\left[ {\matrix{ {T_{1} } \cr {T_{2} } \cr {T_{3} } \cr } } \right].$$
By substitution, Eqs (13) to (15) yield:
 $$\left[ {\matrix{ U \cr V \cr } } \right]{\equals}\left[ {\matrix{ {R_{{11}} } & {R_{{12}} } \cr {R_{{21}} } & {R_{{22}} } \cr } } \right]\left[ {\matrix{ X \cr Y \cr } } \right]{\plus}\left[ {\matrix{ {T_{1} } \cr {T_{2} } \cr } } \right]$$
and
 $$W\,{\equals}\,\left[ {\matrix{ {R_{{31}} } & {R_{{32}} } \cr } } \right]\left[ {\matrix{ X \cr Y \cr } } \right]{\plus}T_{3} .$$
Since R is a rotation matrix, its inverse,
 $$\left[ {\matrix{ {R_{{11}} } & {R_{{12}} } \cr {R_{{21}} } & {R_{{22}} } \cr } } \right]^{{{\minus}1}} ,$$
exists:
 $$\left[ {\matrix{ X \cr Y \cr } } \right]{\equals}\left[ {\matrix{ {R_{{11}} } & {R_{{12}} } \cr {R_{{21}} } & {R_{{22}} } \cr } } \right]^{{{\minus}1}} \left\{ {\left[ {\matrix{ U \cr V \cr } } \right]{\minus}\left[ {\matrix{ {T_{1} } \cr {T_{2} } \cr } } \right]} \right\}.$$
Substituting Eq. (18) into Eq. (17), we have:
 $$\eqalignno { W\,{\equals}\,&\left[ {\matrix{ {R_{{31}} } \quad {R_{{32}} } } } \right] \cr& \cdot \left[ {\matrix{ {R_{{11}} } \quad {R_{{12}} } \cr {R_{{21}} } \quad {R_{{22}} } \cr } } \right]^{{{\minus}1}} \left\{ {\left[ {\matrix{ U \cr V \cr } } \right]{\minus}\left[ {\matrix{ {T_{1} } \cr {T_{2} } \cr } } \right]} \right\}{\plus}T_{3} .$$
Because
 $$\left[ {\matrix{ u \cr v \cr } } \right]\,{\equals}\,{{f_{\rm c} } \over W}\left[ {\matrix{ U \cr V \cr } } \right]$$
as expressed in Eq. (3), we have:
 $$$$
\left[ {\matrix{ U \cr V \cr } } \right]\,{\equals}\,{{W} \over f_{\rm c} }\left[ {\matrix{ u \cr v \cr } } \right].
$$$$
\left[ {\matrix{ U \cr V \cr } } \right]\,{\equals}\,{{W} \over f_{\rm c} }\left[ {\matrix{ u \cr v \cr } } \right].Substituting Eq. (20) into Eq. (19), we obtain:
 $$\eqalignno { W\,&{\equals}\,\left[ {\matrix{ {R_{{31}} } \quad {R_{{32}} } \cr } } \right] \cr& \cdot \left[ {\matrix{ {R_{{11}} } \quad {R_{{12}} } \cr {R_{{21}} } \quad {R_{{22}} } \cr } } \right]^{{{\minus}1}} \left\{ {{W \over {f_{\rm c} }}\left[ {\matrix{ u \cr v \cr } } \right]{\minus}\left[ {\matrix{ {T_{1} } \cr {T_{2} } \cr } } \right]} \right\}{\plus}T_{3} .$$
Extracting W from both sides of Eq. (21) gives:
 $$W\,{\equals}\,{{{\minus}\left[ {\matrix{ {R_{{31}} } & {R_{{32}} } \cr } } \right] \cdot \left[ {\matrix{ {R_{{11}} } & {R_{{12}} } \cr {R_{{21}} } & {R_{{22}} } \cr } } \right]^{{{\minus}1}} \left[ {\matrix{ {T_{1} } \cr {T_{2} } \cr } } \right]{\plus}T_{3} } \over {1{\minus}\left[ {\matrix{ {R_{{31}} } & {R_{{32}} } \cr } } \right]\left[ {\matrix{ {R_{{11}} } & {R_{{12}} } \cr {R_{{21}} } & {R_{{22}} } \cr } } \right]^{{{\minus}1}} \left[ {\matrix{ u \cr v \cr } } \right]{\rm \,/\,}f_{\rm c} }}.$$
For the specific setup in Fig. 3,
 $${\mib{T}} {\equals}\left[ {\matrix{ 0 \cr {{\minus}h} \cr 0 \cr } } \right] $$
and
 $$\left[ {\matrix{ {R_{{11}} } & {R_{{12}} } \cr {R_{{21}} } & {R_{{22}} } \cr } } \right]^{{{\minus}1}} {\equals}\left[ {\matrix{ 1 & 0 \cr 0 & {1{\rm /}{\!}\cos \theta } \cr } } \right].$$
Substituting them into Eq. (22), the relationship between W and v can be simplified as follows:
 $$\eqalignno { \quad\quad W\, \;{\equals}\, & {{{\minus}\left[ {\matrix{ 0 & {\sin \theta } \cr } } \right] \cdot \left[ {\matrix{ 1 & 0 \cr 0 & {1{\rm /}{\!}\cos \theta } \cr } } \right]\left[ {\matrix{ 0 \cr {{\minus}h} \cr } } \right]{\plus}0} \over {1{\minus}\left[ {\matrix{ 0 & {{\minus}h} \cr } } \right]\left[ {\matrix{ 1 & 0 \cr 0 & {1{\rm /}{\!}\cos \theta } \cr } } \right]\left[ {\matrix{ u \cr v \cr } } \right]{\!}{\rm /}f_{\rm c} }} \cr {\equals} & {{h \cdot (\sin \theta {\rm /}cos\,\theta )} \over {1{\minus}(v \cdot \sin \theta {\rm /}f_{{\mathop{\rm c}\nolimits} } \cdot \cos \theta )}} \cr {\equals} & {{h \cdot \sin \theta } \over {\cos \theta \,{\minus}\,(v{\rm \,/\,}f_{{\mathop{\rm c}\nolimits} } ) \cdot \sin \theta }}, $$
which is Eq. (10).