


Total sulfur amino acid (TSAA) nutrition of cultivated fish species currently deserves much attention from a practical standpoint due to a growing and extensive use of methionine (Met)-limiting plant protein sources such as soya and legume seed derivatives in aquafeeds.
Met is an indispensable amino acid (IAA) for normal growth of animals including fish(Reference Wilson and Halver1) and plays a central role in protein synthesis and in transmethylation and trans-sulfuration to cysteine (Cys). Met is a precursor in the biosynthesis of important nutrients and bioactive compounds such as polyamine (spermine and spermidine), creatine, phosphatidylcholine, glutathione, taurine, coenzyme A and active sulfate(Reference Baker2). Trans-sulfuration of Met to Cys has been shown to be 100 % efficient on a sulfur basis(Reference Baker2), hence the dietary requirement for TSAA in animals might be met by either Met alone or a combination of Met and Cys, where the latter amino acid has been shown to be able to spare approximately half of the dietary requirement for Met in fish(Reference Wilson and Halver1, Reference Hidalgo, Alliot and Thebault3, Reference Goff and Gatlin4) as in poultry and mammals(Reference Baker2).
Met deficiency has been shown for a long time to cause bilateral cataracts in salmonid species(Reference Poston, Riis and Rumsey5, Reference Simmons, Moccia and Bureau6) so that requirement values of Met (TSAA) have been set on maximum weight gain and absence of lens pathology in certain studies(Reference Wilson and Halver1). In the last decade dietary allowances for Met or TSAA have been reported for several cultured fish species(Reference Wilson and Halver1, Reference Alam, Teshima and Ishikawa7–Reference Santiago and Lovell13). TSAA requirement estimates have been shown to vary within a quite broad range of values (2·0–4·2 % protein) either among or within fish species. As frequently questioned, at least part of the wide inter-intra specific disparity in dietary amino acid requirement estimates of fish could be due to various methodological approaches, experimental model design as well as to different diet composition, fish size, feeding levels and culture conditions adopted in single laboratory studies(Reference Tacon, Cowey, Calow and Tytler14–Reference Tibaldi and Kaushik17). Moreover, as suggested by Twibell et al. (Reference Twibell, Wilson and Brown8), Kasper et al. (Reference Kasper, White and Brown18) and recently reviewed in terrestrial animals(Reference Dilger and Baker19), even variable Met:Cys ratios and/or different levels of sulfur amino acid-related nutrients such as choline in test diets could explain some variability in Met or TSAA requirement values as assessed in previous experiments with fish.
In the case of European sea bass (Dicentrarchus labrax), a strictly carnivorous marine fish species of great economic interest in the Mediterranean area, Thebault et al. (Reference Thebault, Alliot and Pastoreaud20) provided a first estimate of the dietary Met requirement obtained in a dose–growth study which used just four levels of dietary Met in practical-like diets. The requirement value was found to be approximately 10 g/kg in a diet supplying 10 g Cys/kg, resulting in a TSAA allowance of approximately 4 % protein. This latter value appears inconsistent with the corresponding values of 2·2 or 2·3 % protein obtained by Tibaldi et al. (Reference Tibaldi, Tulli, Corsin, Chatain, Saroglia and Sweetman21) and Kaushik(Reference Kaushik22) for the same fish species based on whole-body amino acid deposition(Reference Ogino23) and the whole-body A/I ratio (A/I = individual IAA/sum of IAA including Cys and tyrosine) relative to the lysine requirement, according to the ideal protein concept as outlined by Wilson(Reference Wilson and Halver1), respectively. Discrepancies between amino acid requirement estimates from dose–response studies or from whole-body amino acid pattern and ratios to lysine requirement have frequently been noted(Reference Tibaldi and Kaushik17, Reference Baker24). There is growing evidence that such differences, in fish like in other animal models, may be primarily due to a different proportion or contribution of amino acids required for maintenance over the total dietary allowance(Reference Rodehutschord, Jacobs and Pack25–Reference Conceição, Grasdalen and Rønnestad28). Given the disparity of the currently available dietary allowance for Met or TSAA and the many factors that may affect amino acid requirement estimates, a dose–response study was undertaken to re-evaluate the Met and TSAA requirement of juvenile European sea bass at a constant level of dietary Cys, using seven levels of dietary Met in semi-purified diets not limiting in choline and where soyabean meal represented a major protein source. Besides growth and N gain, plasma concentrations of sulfur amino acids in response to varying levels of Met in the diet were also investigated.
A further aim of the present study was to estimate the TSAA requirements for maintenance over total absolute requirement of juvenile European sea bass based on the response in N retention to graded intake of TSAA.
Materials and methods
Experimental diets
Seven semi-purified diets were formulated to be grossly isonitrogenous (7·7 % DM), isolipidic (15·7 % DM), isoenergetic (19·5 MJ/kg DM) and to contain graded levels of l-Met. They all included an enzyme-treated soyabean meal (H310; Hamlet Protein AS, Horsens, Denmark), low in trypsin inhibitor activity ( < 1 mg/g) as a major Met-limiting protein source. A first preparation (diet 1) was designed to be deficient in Met and TSAA (l-Cys, 1 g/kg; l-Met, 2 g/kg, as provided by dried fish soluble concentrate and soyabean meal) but otherwise resembling the amino acid profile of sea bass muscle protein through supplementation with mixtures of crystalline indispensable and dispensable l-amino acids (Sigma-Aldrich Chemicals, Milan, Italy). A second diet (diet 2) was formulated to minimise the level of TSAA (l-Cys, 4·2 g/kg; l-Met, 5 g/kg) as supplied by dried fish soluble concentrate (80 g/kg), wheat gluten meal (100 g/kg), enzyme-treated soyabean meal (250 g/kg) and gelatine (80 g/kg) of known amino acid composition. It also contained crystalline IAA and dispensible amino acid (DAA) mixtures to simulate, except Met and Cys, the amino acid profile of sea bass muscle protein. Five further preparations (diets 3–7) were obtained from diet 2 by adding 2·5, 5·0, 7·5, 10·0 or 12·5 g pure l-Met/kg, with reductions in equal amounts of N from the DAA mixture to compensate. Crystalline amino acid mixtures were coated with carboxymethylcellulose and/or gelatine before being added and mixed to the other feed ingredients. In addition, a fish meal-based complete feed was prepared to be used as a positive control (control diet).
All diets were pelleted through a 2·2 mm die, dried overnight at 35°C in a fluid bed drier, then stored at 3°C until used.
The composition, the analysed proximate composition, gross energy, and the Met and TSAA contents of the experimental diets are shown in Table 1.
Table 1 Composition, proximate analysis, gross energy content and methionine (Met) and total sulfur amino acid (TSAA) levels of the experimental diets

IAA, indispensable amino acids; DAA, dispensable amino acids.
* Description of the ingredients: fish protein concentrate, CPSP 90, from Sopropeche (Boulogne-sur-Mer, France); gelatine from Sigma (Milan, Italy); wheat gluten and gelatinised wheat starch from Roquette Italia S.P.A. (Cassano Spinola, Italy); enzyme-treated soyabean, H310 from Hamlet Protein AS (Horsens, Denmark); cod liver oil, carboxymethylcellulose and soya lecithin from Laboratorio Dottori Piccioni S.r.l. (Gessate, Italy).
† Composition of the essential amino acid (Sigma Chemicals, Milan, Italy) mix (%): histidine, 5·8; lysine, 15·5; leucine, 30·7; isoleucine, 7·16; valine, 8·1; phenylalanine, 8·7; tyrosine, 10·7; threonine, 6·6; tryptophan, 6·7.
‡ Composition of the dispensable amino acid (Sigma Chemicals, Milan, Italy) mix (%): alanine, 13·7; aspartic acid, 24·3; glutamic acid, 35·2; glycine, 9·7; proline, 7·6; serine, 9·5.
§ Composition of the mineral mix (g/kg diet): MgO, 3·00; CaHPO4− , 1·00; KH2PO4, 5·00; NaCl, 0·59; FeCO3, 0·10; KI, 0·15; ZnO, 0·05; MnO, 0·100; CuSO4, 0·0; sodium selenite, 0·0004.
∥ Composition of the vitamin mix according to National Research Council(64) (mg/kg diet): vitamin A (250 000 U/g), 2·5; vitamin D3 (250 000 U/g), 4·8; ascorbate monophosphate (Stay-C®; Roche Vitamins, Inc. (Parsippany, NJ, USA) (35 %), 100; tocopheryl acetate, 123; menadione, 10; thiamin HCl, 12; riboflavin, 12; pyridoxine HCl, 12; calcium pantothenate 40; vitamin B12, 0·01; niacin, 15; biotin, 1·0; folic acid, 2; inositol, 430.
¶ (Met+cysteine).
Fish and experimental conditions
European sea bass (D. labrax) juveniles, obtained from a commercial hatchery (Panittica Pugliese, Torre Canne, Brindisi, Italy), selected to be uniform in size and free from grossly discernible anatomical malformations, were randomly divided among twenty-four groups. Fish groups were stocked in 250-litre fibreglass tanks being part of an indoor partially recirculating marine water system (14 m3 total volume, 5 % daily water volume renewal rate, 12 h artificial daylength, 400 lux light intensity), provided with thermostatic control and regulation of water temperature, mechanical sand filter, bio-filter and UV lamp apparatus.
Fish were fed the control diet and adapted over 3 weeks to the experimental conditions. At the end of this preliminary period, under- or oversized specimens were removed to further limit size variation within a group. The twenty-four fish groups were then assigned to the eight diets according to a random design with triplicate units per treatment, with a stocking density of fifty fish per tank (average individual weight, 13·4 (sd 0·2) g).
The feeding trial lasted 12 weeks and the fish were hand-fed two meals daily to visual satiety (i.e. until the first feed item was refused). The actual feed intake and mortality per group were recorded on a daily basis. Fish were group-weighed every 3 weeks, after a 24 h fasting and under moderate anaesthesia. Water quality was monitored twice per week throughout the experiment and all parameters resulted in nearly constant and optimal values for sea bass (temperature, 23·0 (sd 0·5) °C, salinity, 35 (sd 1) ‰, dissolved O2, 6·2 (sd 0·3) mg/l, pH, 7·7 (sd 0·2), total ammonia N, < 0·12 mg/l, nitrite N, < 0·06 mg/l).
Fish and blood sampling
At the beginning of the trial, fifteen fish were sampled at random from the tanks, killed using an overdose of anaesthetic (Finquel®; Argent Laboratories, Redmond, WA, USA), then pooled, minced, freeze-dried and ground to be analysed for initial whole-body N content.
At the end of the trial, all fish were individually checked by visual inspection to eventually detect grossly discernible signs of Met deficiency and five fish were sampled at random from each unit. They were pooled and treated as previously described for the initial sample to be analysed for final whole-body N content.
At the end of the growth trial, after a 2-week adaptation period to a single meal per d, individual blood samples were withdrawn from three fish per each of the groups fed diets 1 to 7, at 6 or 24 h after the meal, to determine plasma concentrations of TSAA.
Blood samples, taken from caudal vessels using heparinised syringes, were immediately centrifuged (3000 g for 10 min at 4°C), deproteinised by ultrafiltration (9000 g for 10 min at 4°C; Waters-Millipore PLGC Membrane; Millipore, Billerica, MA, USA) and stored at − 20°C until analysed.
Handling of the fish was done according to the European Union Directive (86/609EC) for the protection of animals used for experiments and other scientific purposes following the guidelines of the Commission Recommendation 2007/526/EC for fish.
Analytical methods
The proximate composition, the gross energy content (adiabatic calorimeter, IKA C7000; IKA Werker GmbH, Staufen, Germany) of the diets and the Kijeldhal-nitrogen content of pooled whole-body fish samples were determined according to AOAC(29). To verify the correspondence with the expected levels of TSAA, the diets were analysed by HPLC after derivatisation with AccQ-Tag (Waters Italia S.p.A., Milan, Italy) according to Cohen & De Antonis(Reference Cohen and De Antonis30) using α-aminobutyric acid (2·5 mmol/l) as internal standard.
From each plasma sample, an aliquot (0·1 ml) was used to determine the free Met and amino acid levels by HPLC according to Waters Italia S.p.A., using α-aminobutyric acid (2·5 mmol/l) as internal standard. A further plasma sample (0·2 ml), added with norleucine as internal standard was used to determine homocysteine (Hcys), Cys and glutathione levels according to Ubbink et al. (Reference Ubbink, Hayward Vermaak and Bissbort31).
Statistical analysis
All the zootechnical responses to dietary treatments were analysed by one-way ANOVA. Plasma amino acid concentrations were subjected to a two-way ANOVA including the sampling time and dietary treatment as main factors. If appropriate, means were compared by Duncan's multiple-range test. Statistical comparison among means was carried out at the 5 % significance level(Reference Snedecor and Cochran32).
Different regression models were preliminary tested in fitting the relationship between weight gain or N gain and Met (TSAA) dietary level or intake (i.e. broken-line(Reference Robbins, Norton and Baker33), exponential(Reference Rodehutschord, Jacobs and Pack25), four-parameter logistics(Reference Gahl, Finke and Crenshaw34) or saturation kinetic models(Reference Mercer35)) but none of the non-linear ones outperformed the broken-line model for the goodness of fit after being analysed in terms of root mean square error (RMSE) and probability plots of standardised residuals(Reference Shearer16). Hence, Met (TSAA) requirement values were estimated using the broken-line model as outlined below:
where y is the requirement value corresponding to the breakpoint x value, U is the slope of the first segment, L is the asymptote of the first segment, R − x is defined as zero when x > R, Met (TSAA) requirement for maintenance = − L/U, and Met (TSAA) requirement for 1 g N deposition = 1/U.
All data were processed by SPSS/PC for Windows release 16.0.0 (SPSS Inc., Chicago, IL, USA).
Results
Feed, N, TSAA intakes and mortality of juvenile sea bass as affected by dietary treatments are shown in Table 2. Although the test diets were readily accepted since the first administration, after 3 weeks from the beginning of the trial feed consumption started to be progressively reduced in fish groups fed the Met-deficient diet, which resulted in negligible feed intake during the last week of the trial. As a consequence, diet 1 resulted in impaired feed and N intakes relative to the other semi-purified diets supplying increasing levels of Met (TSAA) (12·8 v. 16·2 mg/kg average body weight per d; P < 0·001) which did not differ from each other or from the control diet, except in the case of diet 7 where a slightly higher N intake was noted (P < 0·001). As a result, the calculated Met (TSAA) intake in fish fed graded levels of Met increased in a stepwise fashion (P < 0·001).
Table 2 Feed, nitrogen, methionine (Met) and total sulfur amino acid (TSAA) intakes and mortality in sea bass (Dicentrarchus labrax) fed the test diets over 84 d
(Mean values and mean square errors)
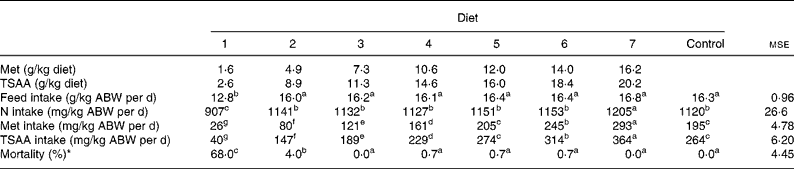
ABW, average body weight = (initial biomass+final biomass)/2.
a–g Mean values within a row with unlike superscript letters were significantly different (P < 0·05).
* ANOVA on arcsin-transformed data.
In addition to reduced feed intake, fish given the TSAA-deficient preparation suffered severe mortality from week 8 onwards. Some minor losses occurred also in fish groups fed diet 2, while mortality was absent or negligible in those fish subjected to the other dietary treatments. At visual inspection, no grossly discernible evidence of lens opacity was detected in fish fed diets varying in Met (TSAA) content.
The growth performance, feed conversion ratio and gross N retention efficiency in fish fed the test diets are shown in Table 3. At the end of the experiment, sea bass fed diet 1 resulted in significantly lower weight gain (30·9 %), severely impaired feed conversion rate and negligible N retention, when compared with the other dietary treatments (P < 0·001). As shown in Table 3, specific growth rate and gross N retention improved in response to graded levels of Met (TSAA) in the diet without any further significant change over a dietary Met and TSAA content of 10·6 and 14·6 g/kg, respectively (diet 4). All diets supplying more than this Met (TSAA) level resulted in a growth rate and N retention efficiency which did not differ from those attained by fish given the control preparation.
Table 3 Growth performance, feed conversion ratio (FCR) and gross nitrogen retention (GNR) efficiency in sea bass (Dicentrarchus labrax) fed the test diets over 84 d
(Mean values and mean square errors)
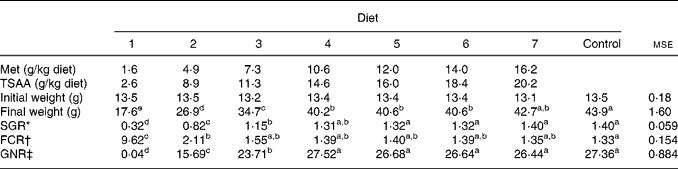
Met, methionine; TSAA, total sulfur amino acids; SGR, specific growth rate.
a–e Mean values within a row with unlike superscript letters were significantly different (P < 0·05).
* SGR = 100 × (ln final body weight − ln initial body weight)/d.
† FCR = feed intake per group/weight gain per group.
‡ GNR = 100 × (whole-body N gain per group/N intake per group).
The concentrations of Met, Hcys and Cys measured in plasma of fish fed graded levels of Met (TSAA) 6 and 24 h after a single meal are shown in Table 4. No significant interaction between dietary treatment and sampling time was found after subjecting the data to a two-way ANOVA, so plasma amino acid levels are presented according to main factors. As expected and regardless of the dietary treatment, the 6 h post-feeding plasma Met concentration was found to be substantially higher than the levels measured under post-absorptive conditions (P < 0·001). On the other hand, blood sampling time little affected plasma levels of Hcys (P = 0·337) and Cys (P = 0·456). Irrespective of the sampling time, plasma TSAA levels increased in response to graded levels in the diet, with a sharp increase in fish fed excessive Met as indicated by growth parameters (P < 0·001). A similar trend towards increasing plasma levels was also observed for Hcys and Cys.
Table 4 Effects of test diets and sampling time on the sea bass (Dicentrarchus labrax) plasma levels of methionine (Met), homocysteine (Hcys) and cysteine (Cys) 6 and 24 h after a single meal
(Mean values and mean square errors)
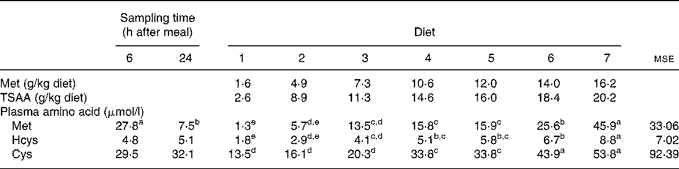
TSAA, total sulfur amino acids.
a–e Mean values within a row, for sampling time or diet, with unlike superscript letters were significantly different (P < 0·05).
The dietary Met (TSAA) requirement was estimated by fitting the broken-line model to the dose–response relationship using either body-weight gain or N accretion as the dependent variable (for parameter estimates, see Table 5). Break points indicated estimates of dietary Met relative requirement values to be 9·1 (se 0·03) g/kg diet (2·0 % dietary protein) and 8·0 (se 0·01) g/kg diet (1·8 % dietary protein) using weight gain and N deposition, respectively (Fig. 1). Given an approximately constant level of Cys in diets 2–7 (4·0 g/kg), the corresponding TSAA requirement values were calculated to be 13·1 g/kg (3·0 % dietary protein) and 12·0 g/kg (2·7 % dietary protein) when weight gain and body N accretion were used as the response criterion, respectively.
Table 5 Parameters estimated by fitting the broken-line model to the experimental data using weight gain (percentage initial body weight) and nitrogen gain (mg/kg average body weight per d) as dependent variables against dietary levels of methionine
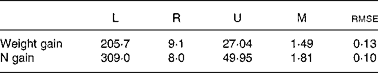
L, plateau value; R, requirement; U, slope; M, x – intercept; rmse, root mean square error.

Fig. 1 Weight gain (percentage initial weight; ■) and N gain (mg/kg average body weight (ABW) per d; ▲) of juvenile sea bass (Dicentrarchus labrax) fed graded levels of dietary methionine (Met) as fitted by the broken-line model.
When the relationship between N gain and TSAA intake (mg/kg average metabolic weight (AMW) per d) was fitted by the broken-line model, the break point indicated that 87·4 (se 0·02) mg TSAA/kg AMW per d were required to optimise fish response (Fig. 2).
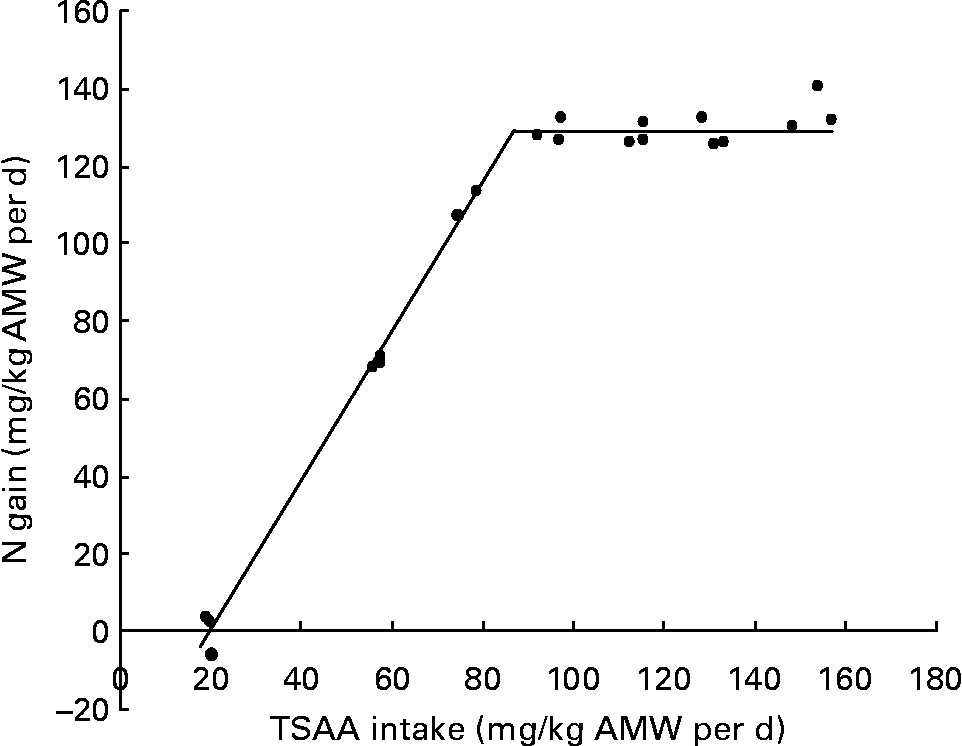
Fig. 2 Relationship between N gain and total sulfur amino acid (TSAA) intake in juvenile sea bass (Dicentrarchus labrax) as fitted by the broken-line method (y = 129·21+1·92 × (87·4 − x) root mean square error (RMSE) = 0·08). AMW, average metabolic weight ((initial body weight0·75+final body weight0·75)/2).
Fitting the linear change in N gain at marginal TSAA intake (y = 1·92x − 38·47; n 9) to y = 0, resulted in a daily intake of 20 mg TSAA/kg AMW per d corresponding to the amount needed to maintain N balance. The inverse value of the slope of the linear fit at marginal TSAA intake indicated 520 mg as the estimated TSAA intake required for 1 g N deposition in juvenile sea bass.
Discussion
Depressed feed intake, growth retardation and the development of nutritional pathologies are known to occur in response to diets containing disproportionate levels of Met (TSAA) or certain IAA in several animal models(Reference D'Mello and D'Mello36), including fish(Reference Wilson and Halver1, Reference Tibaldi and Kaushik17, Reference Cowey, Cho and Sivak37). In the present study, juvenile sea bass exhibited a progressive anoretic behaviour as a primary response to a diet severely deficient in Met (TSAA) resulting in negligible growth and high mortality at the end of the trial. Loss of appetite or reduced feed intake in fish fed purified or semi-purified diets deficient or limiting in Met (TSAA) have been reported in other dose–response studies carried out with the same(Reference Thebault, Alliot and Pastoreaud20) or other fish species(Reference Alam, Teshima and Ishikawa7, Reference Luo, Liu and Mai10, Reference Cowey, Cho and Sivak37–Reference Kim, Kayes and Amundson39). This was sometimes associated with some mortality, particularly in experiments that, like the present one, had quite a long duration (more than 8 weeks), used juvenile stages and when fish were fed diets containing less than 65 % of the minimal Met (TSAA) level ensuring optimal growth (i.e. grouper(Reference Luo, Liu and Mai10), Japanese flounder(Reference Alam, Teshima and Ishikawa7), yellowtail(Reference Ruchimat, Masumoto and Hosokawa40), rainbow trout(Reference Cowey, Cho and Sivak37, Reference Kim, Kayes and Amundson39, Reference Barash, Poston and Rumsey41–Reference Walton, Cowey and Adron43), red drum(Reference Moon and Gatlin44), striped bass(Reference Keembiyehetty and Gatlin45)).
In fish, the development of bilateral cataracts is a pathological sign often associated with a dietary deficiency of Met or TSAA, as they appear among the most susceptible amino acids to be modified after oxidation of proteins and glutathione in the lens; the latter protects lens proteins and cell membranes from oxidative damage by detoxification of H2O2 and other organoperoxides(Reference Bjerkås, Bjùrnestad and Breck46). Lens opacity induced by a dietary deficiency of TSAA has been observed in different fish species such as rainbow trout, Arctic charr, striped bass and Japanese sea bream(Reference Poston, Riis and Rumsey5, Reference Simmons, Moccia and Bureau6, Reference Cowey, Cho and Sivak37, Reference Keembiyehetty and Gatlin45, Reference Takagi, Shimeno and Hosokawa47) but not in all the fish species studied to date. At the end of the present trial sea bass fed the TSAA-deficient diet (diet 1) did not show, at gross visual inspection, any lens opacity and their plasma glutathione levels were not significantly reduced 6 or 24 h after a meal (data not shown). Likewise, Thebault et al. (Reference Thebault, Alliot and Pastoreaud20) and Hidalgo et al. (Reference Hidalgo, Alliot and Thebault3) in their studies on sulfur amino acid nutrition of sea bass did not observe lens alteration in fish fed diets deficient or limiting in TSAA. So European sea bass similarly to other fish species studied to date appears less susceptible to this pathology related to Met dietary deficiencies.
By virtue of their particular structural or metabolic features, excessive intake of sulfur amino acids results in impaired growth and toxicity in various animal models(Reference D'Mello and D'Mello36, Reference Harper, Benevenga and Wohlueter48), with Met being recognised as the most growth-depressing amino acid when fed in huge excess to farm livestock(Reference Baker2). Data on piscine literature appear contradictory in this respect. A marked decline in growth and feed conversion efficiency due to a slight excess of Met or TSAA relative to the requirement level has been observed either in certain carnivorous fish species (yellow croacker, cobia, European sea bass, rainbow trout)(Reference Mai, Wan and Ai11, Reference Zhou, Wu and Tan12, Reference Thebault, Alliot and Pastoreaud20, Reference Kaushik and Luquet49) and in omnivorous or herbivorous ones (Indian major carps, tilapia, catla, milkfish)(Reference Murthy and Varghese50–Reference Borlongan and Coloso53). To what extent growth depression observed in the above-mentioned studies could be simply a consequence of reduced feed palatability or consumption, as suggested by Griffin et al. (Reference Griffin, White and Brown54), seems questionable, since data on actual feed intake had not always been reported. On the other hand, the results of the present trial revealed no adverse effect on feed consumption or growth impairment in European sea bass juveniles fed diets supplying up to 60 % excess Met and even larger surpluses of dietary Met or TSAA did not result in impaired growth performance in other fish species or studies. Hence, there is no apparent distinction in food habits, growth stage, size or environmental needs which may give a ready explanation for the inconsistent response to excessive Met or TSAA intake among or within fish species. This warrants the need for comparative studies to ascertain if variable response to excess dietary Met or TSAA reflects real species differences or are mostly due to changes in basal diet composition (major ingredients, source and bioavailability of sulfur amino acids, overall amino acid profile, Met:Cys ratio).
Consistent with most studies aimed at estimating amino acid requirements of fish, even in the present experiment weight gain was the primary response criterion to evaluate the Met (TSAA) requirement of European sea bass based on the dose–response relationship. Nearly optimal growth performance is a prerequisite to avoid biased estimates of the requirement to be made and this condition had not always been met in certain amino acid studies with fish, particularly when test diets containing large amounts of crystalline amino acids were used without precautions(Reference Tibaldi and Kaushik17). Under these circumstances growth rates could be lower than those ensured by diets where dietary protein is supplied as all-bound amino acids, possibly reflecting impaired protein synthesis and deposition or increased amino acid catabolism due to a much faster absorption of pure amino acids relative to protein-bound ones(Reference Cowey15). Increasing feeding frequency or protecting dietary pure amino acid to retard their absorption has been shown to be effective in minimising growth-depressive effects(Reference Fournier, Gouillou-Coustans and Métalliller26, Reference Murai, Akiyama and Ogata55–Reference Tibaldi, Tulli and Lanari57). Even in the present study, coating crystalline amino acid mixtures with gelatine or carboxymethylcellulose in diets not limiting in Met (TSAA) resulted in growth and N retention efficiency which were similar to those of fish fed an intact-protein control diet, thus leading to an unbiased estimate of the requirement to be made.
In the present study, the dose–response Met (TSAA) requirement was also estimated using N gain as a more conservative measure of growth, protein deposition being the main determinant of amino acid requirements(Reference Rodehutschord, Becker and Pack58). This resulted in a slightly lower Met requirement estimate than that obtained using weight gain as the dependent variable (8·0 (se 0·01) v. 9·1 (se 0·03) g/kg; 1·8 v. 2·1 % dietary protein), whereas no such differences were observed in previous studies on Met requirements of carp(Reference Schwarz, Kirchgessner and Deuringer59), threonine requirements in salmonids fry(Reference Bodin, Mambrini and Wauters60), lysine in European sea bass(Reference Tibaldi and Lanari56), while even higher values were estimated from N gain than weight gain in the case of Met, lysine and histidine requirements of rainbow trout(Reference Rodehutschord, Jacobs and Pack25, Reference Rodehutschord, Becker and Pack58, Reference Rodehutscort and Pack61). Discrepancies between weight and N gain as response criteria in amino acid requirement experiments have frequently been ascribed to changes in whole body gain composition, particularly protein content, due to varying levels of the test amino acid in the diet(Reference Bureau, Encarnação, Cruz Suàrez, Ricque Marie and Tapia Salazar62). This, however, barely applies to the present study where, except in fish fed the diet lowest in Met, N content of the whole body was little affected by dietary Met (TSAA) level (data not shown). Hence there is no ready explanation for such a discrepancy, suggesting a further role for Met (TSAA) metabolism in fish beyond its role in protein deposition.
Besides growth and protein accretion, plasma or serum Met levels in response to graded TSAA levels in the diet have proven useful to reinforce requirement estimates in previous studies with fish(Reference Griffin, White and Brown54, Reference Harding, Allen and Wilson63). In the present research, irrespective of the blood sampling time, plasma concentrations of Met, as well as Hcys and Cys, were in response to graded dietary sulfur amino acid levels, making it difficult to meaningfully determine a requirement estimate. However, a sharp increase in plasma Cys concentration in sea bass fed dietary TSAA levels beyond 7·3 g/kg (diet 3) was consistent with the estimated requirement based on N gain data.
According to the most widely used mode of expressing IAA requirements in piscine literature (i.e. g/kg diet or percentage dietary protein), the TSAA requirement value of the European sea bass juveniles estimated in the present study (12·0–13·1 g/kg, 2·7–3·0 % protein, in the presence of 4 g Cys/kg, depending on the response criterion adopted) was lower than the value estimated for the same species by Thebault et al. (Reference Thebault, Alliot and Pastoreaud20) (20 g/kg, 4 % protein, in the presence of 10 g Cys/kg) with practical-like diets containing 50 % crude protein. Our estimates fall in the lower range of TSAA requirement values reported for other fish species: channel catfish (5·6 g/kg; 2·3 % protein, in the absence of Cys)(Reference Harding, Allen and Wilson63); rainbow trout (5·2–8·0 g/kg; 2·0–2·3 % protein, in diets varying from 3 to 6 g Cys/kg)(Reference Rodehutschord, Jacobs and Pack25, Reference Kim, Kayes and Amundson39); Nile tilapia (9·0 g/kg; 3·2 % of dietary protein, in the presence of 1·5 g Cys/kg)(Reference Santiago and Lovell13); hybrid striped bass (10·0 g/kg; 3·03 % of dietary protein, in the presence of 1·3 g Cys/kg)(Reference Keembiyehetty and Gatlin45); yellow perch (10·0 g/kg; 3·0 % dietary protein, in the presence of 1·3 g Cys/kg)(Reference Twibell, Wilson and Brown8); red drum (10·6 g/kg; 3·03 % of dietary protein, in the presence of 1·2 g Cys/kg)(Reference Moon and Gatlin44); carp (12·7 g/kg; 3·2 % of dietary protein, in the presence of 4·2 g Cys/kg)(Reference Schwarz, Kirchgessner and Deuringer59); Japanese eel (12·0 g/kg; 3·2 % of dietary protein, in the absence of Cys)(64); Indian major carp (12·9 g/kg; 3·2 % of dietary protein, in the presence of 10 g Cys/kg)(Reference Ahmed, Khan and Jafri9); gilthead seabream (14 g/kg; 4·0 % of dietary protein)(Reference Luquet and Sabaut65); yellowtail (14·2 g/kg; 3·3 % of dietary protein, in the presence of 3·1 g Cys/kg)(Reference Ruchimat, Masumoto and Hosokawa40); Japanese flounder (15·5 g/kg; 3·1 % of dietary protein, in the presence of 0·6 g Cys/kg)(Reference Alam, Teshima and Ishikawa7); juvenile grouper (15·7 g/kg; 3·3 % of dietary protein, in the presence of 2·6 g Cys/kg)(Reference Luo, Liu and Mai10); chinook salmon (16 g/kg; 4·0 % of dietary protein, in the presence of 1·0 g Cys/kg)(Reference Halver, DeLong and Mertz66); Arctic charr (17·0 g/kg; 4·2 % of dietary protein, in the presence of 10 g Cys/kg)(Reference Simmons, Moccia and Bureau6). From the list above, food habits or environmental needs of the different fish species studied to date do not seem able to explain such a wide spread in their Met or TSAA requirements. It should be also noted that, although reduced, major disparities still exist even when requirements are expressed as percentage dietary protein. As frequently questioned, this disparity could reflect a variety of experimental conditions, diet composition, response criteria and methodologies adopted in separate trials and laboratories(Reference Cowey15, Reference Shearer16, Reference Kim, Kayes and Amundson39, Reference Bureau, Encarnação, Cruz Suàrez, Ricque Marie and Tapia Salazar62). In particular, with reference to diet composition, there is evidence in fish that some of the among-study variability in TSAA requirement values could be ascribed to variable levels of Cys and sulfur amino acid-related nutrients such as choline in test diets(Reference Twibell, Wilson and Brown8, Reference Kasper, White and Brown18, Reference Baker24). Recent studies also suggest possible underestimation of IAA requirements, expressed as percentage dietary protein, when test diets are formulated to contain excess protein and their IAA profile, excluding the test amino acid, is not ideal or nearly so(Reference Bureau, Encarnação, Cruz Suàrez, Ricque Marie and Tapia Salazar62, Reference Encarnação, deLange and Rodehutscord67, Reference Bodin, Govaerts and Abboudi68). Hence, besides different experimental conditions and diet composition, even different Cys and protein levels in the test diets could explain the disparity between TSAA requirements of European sea bass estimated in the present study and those reported by Thebault et al. (Reference Thebault, Alliot and Pastoreaud20).
Partitioning the total IAA requirement into the two components, maintenance and growth, is a recent challenge in fish nutrition(Reference Fournier, Gouillou-Coustans and Métalliller26, Reference Rodehutschord, Becker and Pack58, Reference Hauler and Carter69–Reference Mambrini, Kaushik, Nunes, Portugal and Costa71) but it is of great interest since there is growing evidence that in fish, like in other animal models, maintenance requirement over total dietary needs for a given IAA can be different depending on the specific amino acid as well as fish species(Reference Tibaldi and Kaushik17, Reference Fournier, Gouillou-Coustans and Métalliller26, Reference Rodehutschord, Becker and Pack58). As the absolute intake of the limiting amino acid is a function of both actual feed consumption and its dietary concentration(Reference Chung and Baker72), the relationship between absolute TSAA intake and N gain was considered here to estimate TSAA requirements for maintenance and for 1 g N gain in sea bass. Similarly to other studies with other IAA(Reference Hauler and Carter69, Reference Rollin, Wauters and Bodin70, Reference Abboudi, Ooghe and Larondelle73) in salmonid species, also in the present experiment N deposition was linearly related to TSAA consumption at marginal Met intakes. This constant efficiency of utilisation of dietary TSAA allowed us to estimate that the TSAA consumption required to obtain 1 g N deposition was 520 mg TSAA. The maintenance TSAA requirement value calculated in the present study (20 mg/kg AMW per d) under culture and dietary conditions ensuring nearly optimal growth for the European sea bass is similar to the value already estimated for rainbow trout (16 mg/kg average body weight per d)(Reference Rodehutschord, Becker and Pack58) or the rat (21 mg/kg AMW per d)(Reference Gahl, Finke and Crenshaw34), but somewhat lower than the fivefold value reported by Mambrini & Kaushik(Reference Mambrini, Kaushik, Nunes, Portugal and Costa71) for rainbow trout, Atlantic salmon and European catfish. Unfortunately, very few data are actually available for the Met and TSAA maintenance requirements in fish species and this variation can only partially be explained by differences in experimental conditions or mathematical models adopted to estimate requirements. Anyhow, differences among species in the utilisation of a specific amino acid cannot be excluded as it was the case of arginine maintenance requirement reported for sea bass, sea bream, turbot and rainbow trout(Reference Fournier, Gouillou-Coustans and Métalliller26).
The TSAA requirement for maintenance estimated in the present trial represents 23 % of the total requirement for TSAA (maintenance+accretion), which is similar to the relative scope for maintenance observed in mammals as well as in the fish species studied by Mambrini & Kaushik(Reference Mambrini, Kaushik, Nunes, Portugal and Costa71). Recent studies aimed at evaluating the maintenance requirement of individual amino acids in fish species, as well as the proportion of ingested amino acids used to cover the maintenance requirement, suggest marked differences among individual amino acids(Reference Rodehutschord, Becker and Pack58), making previous assumptions on a negligible proportion of maintenance requirement over the total amino acid requirement in fish questionable(Reference Ogino23).
The relatively high intake and proportion of TSAA required for maintenence in European sea bass as in other animals could possibly reflect their complex metabolism and multiple roles beyond protein synthesis(Reference Baker2). This could also explain the differences in the TSAA requirement value obtained in the present study and previous estimates based on alternative approaches such as whole-body amino acid deposition or pattern relative to lysine requirement(Reference Tibaldi, Tulli, Corsin, Chatain, Saroglia and Sweetman21, Reference Kaushik22) which assume that IAA are utilised with similar efficiency and that maintenance requirements for all IAA are similar.
In conclusion, based on N and weight gain, the requirement of sea bass juveniles for Met was estimated to be 8·0 and 9·1 g/kg diet (1·8–2·0 % of dietary protein) in the presence of 4 g dietary Cys/kg in a diet supplying 45 % protein. The corresponding TSAA requirement resulted to be 12·0–13·1 g/kg diet (2·7–3·0 % of dietary protein). This estimate was corroborated by the response of plasma free sulfur amino acid levels to increasing dietary Met (TSAA). Besides, the response of N gain to increasing TSAA intake allowed us to estimate a TSAA intake for maintenance of 20 mg TSAA/kg AMW per d, which represents 23 % of the total (maintenance+accretion) requirement for the European sea bass juveniles.
Acknowledgements
The authors wish to thank Dr Gianni De Stasio for his helpful support in the HPLC analytical work. The research was funded by the Italian Government, VI Piano Triennale della Pesca e Acquacoltura of Ministero delle Politiche Agricole e Forestali (reference N. 6-C-30).
E. T. and F. T. developed the initial idea and designed the study; M. C. was responsible for the fish trial; M. M. carried out the analytical work and analysed the data. F. T. performed the statistical analysis and drafted the manuscript.
None of the authors had any financial or personal conflicts of interest.


