


Obesity, the accumulation of excessive amount of body fat, is the most common disorder globally, including low- and middle-income countries like Iran(1) and an important cause of morbidity and mortality, which can create enormous socio-economic and public health burdens for poorer nations( Reference Salekzamani, Neyestani and Alavi-Majd 2 ). The distribution of body fat is of great importance as truncal or central obesity is mostly associated with many pathologies, including CVD, hypertension and diabetes. The pathogenesis of central obesity is complex, comprising both genetic and environmental factors. It is estimated that 40–70 % of the variation in BMI and 37–81 % in waist circumference (WC) is heritable, although cultural and social factors may explain at least 30 % of the variations( Reference Hill and Peters 3 , Reference Dennis 4 ). Current literature supports an inverse relationship between 25-hydroxyvitamin D (25(OH)D) and components of the metabolic syndrome, including high blood glucose concentration, insulin resistance, dyslipidaemia, elevated blood pressure and abdominal obesity( Reference Salekzamani, Neyestani and Alavi-Majd 2 ). Obesity is associated with a lower concentration of circulating 25(OH)D, and poor vitamin D status is independently associated with increased BMI and fat mass (FM)( Reference Arunabh, Pollack and Yeh 5 – Reference Parikh, Edelman and Uwaifo 9 ). BMI, although commonly used as an indicator of adiposity, has a limitation of undifferentiating FM from fat-free mass. Furthermore, the ethnicity may have an effect on the relationship between BMI and body FM. For example, Asians are reported to exhibit a higher proportion of body fat for a given BMI than do Caucasians( Reference Hajer, van Haeften and Visseren 10 ). On one hand, vitamin D has lower bioavailability in obese patients due to sequestration of vitamin D in adipose tissue, and, on the other hand, vitamin D may play a causal role in obesity by modulating homoeostasis of intracellular Ca in which a higher intracellular Ca triggers lipogenesis and suppresses lipolysis(11). Recently, a meta-analysis of randomised clinical trials (RCT) showed beneficial effects of vitamin D supplementation on body weight and FM( Reference Soares, Ping-Delfos and Ghanbari 12 ). Nevertheless, prospective studies examining the effects of Ca and vitamin D alone or in combination on body weight and/or abdominal fat have been inconclusive( Reference Young, Engelman and Langefeld 8 , Reference Caan, Neuhouser and Aragaki 13 ).
Both 1,25(OH)2D and vitamin D receptor (VDR) are important contributors in adipocyte differentiation( Reference Wood 14 , Reference Kong and Li 15 ). It has been demonstrated that VDR mRNA concentration affects adipogenesis, that is, it may have inducing or hindering effect( Reference Burton, Guan and Nagarajan 16 ). Moreover, VDR is able to bind to several genes to influence their expression. Among VDR SNP, Cdx-2 is functional and resides in the binding site of transcription factor Cdx-2, upstream of exon 1. Functional analyses showed that the A to G base substitution eliminates the Cdx-2 binding site and reduces transcriptional activity of VDR to 70 % of the A allele( Reference Yamamoto, Miyamoto and Li 17 ). It was suggested that Cdx-2 is associated with decreased risk of fracture with A allele via enhancing VDR expression in the intestine, increasing Ca transport protein transcription leading to increased Ca absorption and increased bone mineral density. On the other hand, epidemiologic data show an inverse association between Ca consumption and body fat (particularly in women) and the risk of becoming obese( Reference Zemel, Shi and Greer 18 ). A few studies have examined the association of various VDR genetic variants with adiposity. Recently, Ochs-Balcom et al.( Reference Ochs-Balcom, Chennamaneni and Millen 19 ) showed a borderline significant association between Cdx-2 polymorphism and adiposity phenotype. Rosenblum et al.( Reference Rosenblum, Castro and Moore 20 ) noted that Ca and/or vitamin D supplementation contributes to a beneficial reduction of visceral adiposity.
Given the potential risk of vitamin D deficiency for major non-skeletal diseases and conditions such as metabolic syndrome, type 2 diabetes (T2D), CVD and obesity, and the role of VDR genetic variants in adiposity, we conducted the current study to investigate the effects of vitamin D intake through fortified Persian yogurt drink (doogh) for 12 weeks on markers of central obesity and whether Cdx-2 SNP could modify the possible effects of vitamin D on central obesity indicators.
Methods
Study design
This was a 12-week single-blind RCT and a part of a larger trial on evaluation of efficacy of vitamin D-fortified doogh (FD) on diabetes outcomes in T2D patients. The protocol of this trial has been published in detail previously( Reference Neyestani, Djazayery and Shab-Bidar 21 ). The RCT was conducted during the period of mid-October 2010 to late March 2011 collaboratively by National Nutrition and Food Technology Research Institute (NNFTRI) and Tehran University of Medical Sciences (TUMS) in Tehran, the capital of Iran. Full information on the study design and objectives had been given to all participants before they gave a signed informed consent. The study protocol was approved scientifically and ethically by both NNFTRI and TUMS. The trial registration number at ClinicalTrials.gov is NCT01236846.
Subjects, inclusion/exclusion criteria
Data from the subjects of our previous trial( Reference Shab-Bidar, Neyestani and Djazayery 22 ) in whom visceral adiposity had been assessed were used for the current study. Participants were recruited from the Iranian Diabetes Society and Gabric Diabetes Society members. Volunteers were invited to attend the Laboratory of Nutrition Research at NNFTRI while they were fasting for 12–14 h.
The inclusion criteria were: (a) fasting blood glucose>7 mmol/l, (b) aged 30–60 years old, (c) willingness to participate and (d) no intake of vitamin, dietary, herbal or n-3 supplements since at least 3 months prior to the intervention. Exclusion criteria were: (a) history of CVD, gastrointestinal, renal and other endocrinological diseases, (b) pregnancy or lactation, (c) receiving insulin and (d) treatment for weight reduction.
Study protocol, randomisation and intervention
A run-in period was considered for 2 weeks during which the subjects were instructed to have a weight maintenance diet according to the American Diabetes Association guidelines( Reference Prevention and TYPE 23 ), including two servings of low-fat dairy products (milk and yogurt) and two to three servings of fruits, and two to three servings’ effects of daily intake of two servings of vitamin D3-FD as compared with plain doogh (PD) on obesity indices were evaluated in T2D patients.
To do the RCT, participants were selected from the original database( Reference Shab-Bidar, Neyestani and Djazayery 24 ) in which the random allocation of participants was done. Then those participants whose visceral adipose tissue (VAT) data were available were enrolled. As fully described earlier( Reference Shab-Bidar, Neyestani and Djazayery 24 ), participants were assigned to one of the treatment groups of either FD (containing 170 mg Ca and 12·5 μg vitamin D3/250 ml; n 1 31) or PD (containing 170 mg Ca and no vitamin D/250 ml; n 2 29), using computer-generated random numbers. The team members involved in the intervention had to be aware of the group assignment; thus, the study was only partly blinded. Laboratory staff did not know the patients’ group assignments. Participants were instructed to consume a bottle of yogurt drink with both lunch and dinner, that is, 500 ml/d equalling 25 μg (1000 IU) vitamin D3/d in the FD group. The intervention period was 12 weeks. In the second part (nutrigenetic study), number of patients in the FD group was extended (n 60) to investigate the possible role of VDR SNP, Cdx-2, in the response of obesity indicators to vitamin D intake.
Compliance and quality control
Every 2 weeks, all subjects were visited to evaluate their compliance and to provide a new package of doogh. Yogurt drinks were identical in colour, size, taste and packaging. Therefore, participants were not aware of their group, nor were all the interviewers and laboratory staff. Compliance was evaluated by checking the consumption tables, counting the empty bottles and by direct enquiry both on biweekly visits and weekly follow-up phone calls. The composition (including vitamin D) of dooghs was determined immediately after production, in the middle and at the end of the storage period, to ensure the stability of the components. The measurements were taken at Maad Laboratory of Foods, Drinks and Cosmetics, accredited by the Food and Drug Organization of the Iran Ministry of Health.
Measurements
Assessment of dietary intakes and other variables
We assessed dietary intakes by employing three 24 h recalls questionnaire (including a weekend day) in the beginning of study, which was repeated in the end of the intervention period, as described earlier( Reference Shab-Bidar, Neyestani and Djazayery 24 ). To translate dietary intake data to the actual amounts of energy and nutrients, food composition tables of US Department of Agriculture with some modifications for Iranian foods were used. Information on demographic, medical history, physical activity, duration of direct sun exposure and smoking habits are gathered using questionnaires and face-to-face interview.
Anthropometrics
Weight was measured with light clothing and without shoes using a digital scale (Seca 808) to the nearest of 0·1 kg. Height was measured without shoes using a stadiometer (Seca) to the nearest of 0·1 cm. Circumferences of the waist and hip were evaluated by a measuring tape to the nearest of 0·1 cm. BMI was calculated using the equation BMI=weight (kg)/height2 (m2).
Assessment of percentage of body fat and visceral fat mass
To evaluate the percentage of body FM, bioelectrical impedance analysis (Quadscan 4000 system; Bodystat) was employed. The percentage of trunk fat (TF) and the degree of VAT were evaluated by the Tanita AB-140 ViScan (Tanita Corporation). All participants were requested to abstain from any food or liquid intake and from any intensive exercise for at least 4 h before evaluation. They were also instructed not to wear any metallic object for the tests. The assessments were conducted in an ambient room temperature, while patients were laid on a non-conductive surface. Participants were in a supine position, without a pillow, while their arms were laid across the chest. According to the manufacturer’s instructions, the ViScan was positioned perpendicular to the participant’s body at the umbilical level. The multi-frequency electrode device was positioned on the abdomen in direct contact with the skin. The evaluations were made in duplicate.
Laboratory investigations
Blood samples were collected after 12 h of overnight fasting and were divided in two tubes either with or without the anticoagulant, EDTA. The anticoagulated tube was used to extract genomic DNA, whereas the sera recovered from clot samples were used for biochemical analyses. Glycaemic status and circulating 25(OH)D were determined as previously described( Reference Neyestani, Gharavi and Kalayi 25 ). In this study, vitamin D status was defined based on serum concentrations of 25(OH)D as: sufficiency≥50 nmol/l, 27·5 nmol/l≤insufficiency<50 nmol/l and deficiency<27·5 nmol/l( Reference Saintonge, Bang and Gerber 26 ). According to the Institute of Medicine, these cutoffs were set based on the fact that the vitamin D requirements of at least 97·5 % of the population can be met with circulating 25(OH)D concentrations of 50 nmol/l( Reference Ross, Manson and Abrams 27 ). Fasting serum glucose (FSG) was determined using enzymatic method by using commercial kits (Pars Azmoon) and an auto-analyzer system (Selectra E; Vitalab). Glycated Hb (HbA1c) was determined using colorimetric method after an initial chromatographic separation (BioSystems). Fasting serum insulin was assayed by immuno-radiometric assay (Biosource) and a gamma-counter system (Gamma I; Genesys). The intra- and inter-assay variations for all tests were <7 and 9 %, respectively. Insulin sensitivity was evaluated by Quantitative Insulin Check Index (QUICKI) calculated as( Reference Hrebicek, Janout and Malinčíková 28 ): QUICKI index: 1/(log (insulin) (μU/ml)+log (glucose) (mg/dl)).
Genotyping
DNA was extracted from anticoagulated blood samples using Genet Bio DNA Isolation kit (Prime Prep) according to the manufacturer’s protocol. The Cdx-2 polymorphism (rs11568820) was amplified with PCR using primers 5′-CAgCATgCCTgTCCT CAgC-3′ and 5′-CCAgTACTgCCAgCTCCC-3′ based on the report of Deng et al. ( Reference Deng, Shen and Xu 29 ) and resulted in a 135 bp product. PCR was performed for thirty cycles and at 68°C annealing temperature. DNA was digested with Cdx-2 enzyme (Fermentas; Thermo Scientific). DNA was digested with Bpu10I (Fermentas; Thermo Scientific), and the products were analysed by electrophoresis on a 1·5 % agarose gel containing ethidium bromide and were visualised in a gel documentation system (UVIdoc; UVItec). Bpu10I digestion reveals genotypes denoted AA (135 bp), GA (135, 72 and 63 bp) or GG (72 and 63 bp).
Statistical analysis
Data were expressed as means and standard deviations. Normal distribution of data was checked using Kolmogrov–Smirnov. Genotype frequencies of Cdx-2 were tested for Hardy–Weinberg equilibrium using the χ 2 test. We used the Cochran–Armitage test for trend (χ 2 linear by linear association)( Reference Yong Zou and Donner 30 ). Differences in proportions were evaluated using χ 2 between treatment groups. Independent sample t tests (for normally distributed variables) or Mann–Whitney U tests (for non-normally distributed variables) were used to test anthropometric and metabolic biomarkers between the PD and FD groups. Correlations between variables were evaluated using either Pearson’s r (for data with normal distribution) or Spearman’s r s (for data with non-normal distribution) equations. Repeated-measures ANOVA was used to evaluate time×group interactions, with time and group as factors. In case of significant time–group interaction, between-group comparison of changes at week 12 was carried out using ANOVA followed by Tukey’s post hoc analysis with polynomial contrast analysis for trend when indicated. When time effect was significant, the within-group comparison of values was performed by paired sample t tests. All statistical analyses were carried out using the Statistical Package for Social Sciences (version 18; SPSS). A P value<0·05 was considered significant.
Results
Patients’ characteristics
A flow chart of subject enrollment is shown in Fig. 1. The subjects included twenty-nine women and thirty-one men aged 52·6 (sd 7·8) years. Mean age (PD: 51·3 (sd 7·7), FD: 54·1 (sd 8·0) years), duration of disease (PD: 7·2 (sd 5·8), FD: 8·6 (sd 5·5) years) and sex ratio showed no significant difference between the groups (Table 1). Comparison of dietary data between the PD and FD groups showed no significant difference in the initial and final values of Ca intake (595·6 (sd 270·0) v. 530·8 (sd 216·4) mg/d; P=0·140 and 615·5 (sd 311·0) v. 640·4 (sd 315·1) mg; P=0·660, respectively). Nor was there any significant difference in the initial and final vitamin D intakes, excluding the amount consumed with the fortified dooghs in the FD group (0·39 (sd 0·34) v. 0·35 (sd 0·34) μg/d; P=0·607; 0·44 (sd 0·55) v. 0·40 (sd 0·48) μg/d; P=0·670, respectively).

Fig. 1 Protocol of the study. BP, blood pressure; FD, fortified doogh; PD, plain doogh.
Table 1 Some selected individual characteristics of the subjects enrolled in the randomised clinical trial (RCT) study and Cdx-2 (rs11568820) genotypic groups for the nutrigenetic study (Mean values and standard deviations; percentages)
PD, plain doogh; FD, vitamin D-fortified doogh.
* Very low physical activity.
In our study population, the observed genotype frequency distributions for Cdx-2 were in Hardy–Weinberg equilibrium. Distribution of age, sex, duration of disease and sun exposure did not differ significantly among the genotypic groups (Table 1).
Intervention study
At baseline, vitamin D concentrations and other biomarkers were not significantly different between the two groups (Table 2). There were significant time effect between weeks 0 and 12 in serum 25(OH)D. Serum concentrations of 25(OH)D increased significantly in the FD group compared with baseline (P<0·001) and with PD (+35·4 nmol/l in FD v. −4·8 nmol/l in PD; P<0·001) (Table 2). Accordingly, vitamin D status in FD, as compared with PD, improved significantly after 12 weeks’ intervention (Table 3). There were also significant time effects between weeks 0 and 12 for HbA1c, FM% and VAT. Although in the FD group, HbA1c (P<0·001), FM% (P<0·001) and VAT (P<0·001) all decreased significantly after 12 weeks, in the PD group these variables tended to increase except for HbA1c that slightly but significantly decreased (P=0·03). There were also significant time×treatment interaction for 25(OH)D, QUICKI, WC, waist:hip ratio (WHR), FM%, VAT and TF%. Analysis of changes within groups revealed a significant decrease in WC (P=0·02), WHR (P=0·05), FM% (P<0·008), VAT (P<0·001) and TF% (P=0·003) in the FD group compared with the PD group, whereas 25(OH)D and QUICKI significantly increased in the FD group compared with the PD group (P<0·001 for both) (Table 2). Weight, BMI and FSG did not change significantly either within or between groups after 12 weeks (Table 2). We found a significant negative correlation between changes in serum 25(OH)D and changes of WC (r −0·29; P=0·35), FM% (r −0·45; P=0·001), TF% (r −0·32; P=0·015) and VAT (r −0·44; P=0·001).
Table 2 Comparison of the initial and final values of the variables under study in the randomised clinical trial (RCT) (Mean values and standard deviations)

P 1, probability level by repeated-measures ANOVA for difference in time course; P 2, probability level by repeated-measures ANOVA for difference between types of yogurt drink; P 3, probability level by repeated-measures ANOVA for interaction between time course and type of yogurt drink; 25(OH)D, 25-hydroxyvitamin D; FSG, fasting serum glucose; HbA1c, glycated Hb; QUICKI, Quantitative Insulin Check Index; WC, waist circumference; WHR, waist:hip ratio; FM, fat mass; VAT, visceral adipose tissue.
* Sample size=thirty subjects in the fortified doogh group.
Table 3 Comparison of the vitamin D status between plain doogh (PD) and vitamin D-fortified doogh (FD) groups (Numbers and percentages)
* Deficiency<27·5 nmol/l; 27·5 nmol/l≤insufficiency<50 nmol/l and sufficiency≥50 nmol/l.
Nutrigenetic study
There was no significant difference in any of the initial variables among the genotypic groups. However, a significant time effect was observed between weeks 0 and 12 for serum 25(OH)D. Although in the AA group, serum 25(OH)D increased significantly after 12 weeks (P<0·001), in the other groups (AG and GG), no significant change was observed (P=0·15 and 0·63, respectively) (Table 4). Reanalysis of data among Cdx-2 variants revealed no significant trend for distribution of vitamin D deficiency through Cdx-2 genotypes (χ 2=0·03; P trend=0·86) at baseline. However, after intervention, trend test was significant (χ 2=29·1; P trend<0·001) showing >60 % of subjects in the GG genotype, and 98 % of subjects in AG genotype were deficient after 12 weeks’ intervention (Table 5). There were also significant time effects between weeks 0 and 12 for HbA1c and FM%. Although in the AA group, both HbA1c (P<0·001) and FM% (P=0·01) decreased significantly after 12 weeks, in AG (P=0·18 for HbA1c and P=0·09 for FM%) and GG (P=0·06 for HbA1c and P=0·56 for FM%) groups, these variables did not change (Table 4). There were significant time×treatment interaction for 25(OH)D, QUICKI, WC, FM%, VAT and TF% among Cdx-2 genotypes (Table 4). Post hoc Tukey’s test revealed that the AA group had significantly higher 25(OH)D compared with that of AG (P<0·001) and GG (P=0·006) after 12 weeks. Circulating 25(OH)D was unexpectedly raised only in the AA group compared with the other groups (P<0·001). This difference was accompanied by a significant difference for other obesity markers such as WC, FM% and TF%, which significantly decreased in AA genotype (P=0·004, <0·001 and <0·001, respectively). When changes of the variables were compared using ANOVA followed by Tukey’s post hoc test, a significant difference in 25(OH)D was observed between AA and AG (P<0·001) and AA and GG (P<0·001), but the differences between AG and GG (P=0·77) were not statistically significant. As for FM%, AA differed significantly from both AG (P<0·001) and GG (P=0·05), but there was no significant difference between AG and GG (P=0·60). In addition, TF% showed a significant difference between AA and AG (P=0·008), but there was no significant difference between AA and GG (P=0·24) or between AG and GG (P=0·69). In addition, we observed significant difference in VAT among Cdx-2 genotypes in which the AA group showed significant decrease in VAT compared with AG (P=0·001). Again here, AG and GG as well as AA and GG did not differ significantly (P=0·11 and 0·61). Moreover, the AA group had significantly higher difference in QUICKI compared with AG (P=0·02) and GG (P=0·001). However, there was no significant difference between AG and GG in QUICKI changes (P=0·35).
Table 4 Comparisons of the variables among the Cdx-2 (rs11568820) genotypic groups with type 2 diabetes (T2D) before and after 12 weeks’ intervention in the nutrigenetic study (n 60) (Mean values and standard deviations)
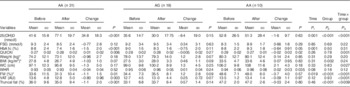
P, before and after study in each genotypic group; P 1 for trend, between-group comparison at baseline; P 2 for trend, between-group comparison after 12 weeks; P 3 for trend, between-group comparison of changes after 12 weeks; 25(OH)D, 25-hydroxyvitamin D; FSG, fasting serum glucose; HbA1c, glycated Hb; QUICKI, Quantitative Insulin Check Index; WC, waist circumference; WHR, waist:hip ratio; FM, fat mass; VAT, visceral adipose tissue.
* Sample size=thirty subjects in AA genotype.
Table 5 Vitamin D status among the Cdx-2 genotypic subgroups before and after the intervention (Numbers and percentages)
Vitamin D status definition based on serum 25-hydroxyvitamin D as deficiency<27·5 nmol/l; 27·5 nmol/l≤insufficiency<50 nmol/l and sufficiency≥50 nmol/l.
Discussion
This study showed that an intake of 25 μg/d vitamin D through FD has beneficial effects on the central obesity indicators, including TF and visceral adiposity in subjects with T2D, and these effects were more pronounced in those patients who were carrier of AA genotype of VDR-Cdx-2 polymorphism.
Emerging data from observational studies showed an inverse association between 25(OH)D status and adiposity. More specifically, two published studies have shown an inverse association between vitamin D and visceral adiposity( Reference Freedman, Wagenknecht and Hairston 31 ) and between baseline BMI and subcutaneous adipose tissue (SAT)( Reference Young, Engelman and Langefeld 8 ) in Hispanic and African-Americans, but 25(OH)D was not associated with 5-year change in adiposity( Reference Young, Engelman and Langefeld 8 ).
The relationship between vitamin D status and adiposity has been under the effect of racial differences. For instance, the inverse association between body fat (assessed by bioelectrical impedance) and serum 25(OH)D varied by race and was stronger in whites compared with blacks( Reference Looker 32 ). Moreover, the association of FM with vitamin D was consistent irrespective of the body fat location, and the correlation of vitamin D deficiency with body fat parameters was stronger than with BMI or WC. In other words, BMI and WC were not independent factors related to the vitamin D status( Reference Rajakumar, de Las Heras and Chen 33 ).
Moreover, the prevalence of poor vitamin D status (25(OH)D<50 nmol/l) was 3-fold higher in subjects with high SAT and high VAT than in those with low SAT and low VAT( Reference Cheng, Massaro and Fox 34 ). Caron-Jobin et al. have found that both high dietary vitamin D intakes and serum 25(OH)D were significantly associated with lower VAT area. Additionally, serum concentration of 25(OH)D was also closely associated with overall adiposity measured using BMI or total body FM( Reference Caron‐Jobin, Morisset and Tremblay 35 ).
Our finding of decrease in FM and VAT mediated by vitamin D supports earlier randomised trials in which after 16 weeks significant reduction was observed in VAT, following daily intake of Ca-vitamin D-fortified orange juice (350 mg and 100 IU/d). Similar to our findings, they did not observe any significant effect on BMI and weight( Reference Rosenblum, Castro and Moore 20 ). Nevertheless, in a longitudinal study, Ca plus vitamin D had a small effect in the prevention of weight gain over 3 years( Reference Caan, Neuhouser and Aragaki 13 ). Similarly, two clinical trials showed no significant changes in body weight, percentage FM or waist:hip ratios after high vitamin D supplementation levels in overweight and/or obese subjects( Reference Sneve, Figenschau and Jorde 36 , Reference Zittermann, Frisch and Berthold 37 ).
Our findings are in accord with some other studies that reported most of vitamin D-induced adiposity reduction is related to VAT changes( Reference Caron‐Jobin, Morisset and Tremblay 35 ). The relationship among adipocyte size, dietary intakes of vitamin D and Ca and 25(OH)D concentrations has been reported only in the omental depot( Reference Caron‐Jobin, Morisset and Tremblay 35 ). It is suggested that range of BMI could be an important predictor of reduction rate and site of reduction in adipose tissue( Reference Caron‐Jobin, Morisset and Tremblay 35 ). In our population, mean of BMI was in overweight and obesity range (88·3 % of our patients were obese and the remaining were overweight). The hypothesis is that, in this range of BMI, variance of SAT is lower than that of VAT, which may lead to more efficacy of supplementation on VAT measures( Reference Caron‐Jobin, Morisset and Tremblay 35 ).
Mechanistically, 1,25(OH)2D induces intestinal Ca absorption, controls bone remodelling, suppresses parathyroid hormone synthesis and favours renal Ca re-absorption( Reference Zemel 38 ). All of aforementioned mechanisms then modulate the intracellular Ca, which involves in alteration of lipolysis or lipogenesis( Reference Zemel 38 ). Moreover, it was suggested that low dietary intakes of vitamin D can induce production of 1,25(OH)2D, which then could induce cortisol production by activating 11β-hydroxysteroid dehydrogenase. The increase in the activity of this enzyme in humans can induce accumulation of FM in visceral area( Reference Veilleux, Rhéaume and Daris 39 , Reference Veilleux, Laberge and Morency 40 ). Whereas vitamin D and its metabolites could be sequestered in fat tissue( Reference Wortsman, Matsuoka and Chen 7 ), following vitamin D supplementation, the activity of the enzyme might reduce, which later can induce lipolysis.
We found the differences of genotype frequencies of VDR-Cdx-2 between patients from Iranian and the other countries, including European( Reference Wehr, Trummer and Giuliani 41 ), Chinese( Reference Gu, Xiao and He 42 ) and South Asian( Reference Jain, von Hurst and Stonehouse 43 ), previously reported (Table 6). For example, while the relative genotype frequencies of Cdx-2 polymorphism in Iranian patients were AA 51·6, AG 31·7 and GG 16·7 %, the genotype frequencies in South Asians were AA 18, AG 55·2 and GG 26·8 %( Reference Jain, von Hurst and Stonehouse 43 ), whereas the frequencies determined on European were AA 04·0, AG 32·0( Reference Wehr, Trummer and Giuliani 41 ) and GG 64·0 %. Moreover, a study in Chinese men( Reference Gu, Xiao and He 42 ) showed that the genotype distributions for Cdx-2 was AA 26·0, AG 44·4 and GG 29·6 %. It is possible that racial differences are involved in environmental or genetic factors.
Table 6 The differences of genotype frequencies of Cdx-2 VDR gene between patients from Iranian and the other countries (Numbers and percentages)
We observed that Cdx-2 polymorphism significantly modified the efficacy of 25 μg/d vitamin D supplementation for increasing 25(OH)D and changing obesity indices. The circulating 25(OH)D was unexpectedly raised only in AA group compared with the other genotypic groups. This difference was accompanied by a significant difference of other obesity indices such as WC, FM% and TF% that significantly decreased in AA genotype.
It is noteworthy that the GG group had higher body weight and FM%. In interventional studies, actually the baseline levels of variables are critical determinant of response to the intervention. However, we did not observe any significant changes in FM and body weight in this group. It is well accepted that the A allele is more ‘active’ than the G allele by binding the Cdx-2 transcription factor more strongly and by having more transcriptional activity. Then, the A allele seems to cause increased VDR expression in the intestine leading to an increased transcription of Ca transport proteins such as calbindin that finally enhance the intestinal absorption of Ca and, thereby, result in increased BMD( Reference Arai, Miyamoto and Yoshida 44 ). Cdx-2 polymorphism has previously been associated with clinical outcomes and Ca absorption. Our results support previous findings of observational and molecular studies( Reference Ochs-Balcom, Chennamaneni and Millen 19 , Reference Arai, Miyamoto and Taketani 45 ). Recently, Ochs-Balcom et al.( Reference Ochs-Balcom, Chennamaneni and Millen 19 ) observed a positive association of Cdx-2 with WC and abdominal height, and a borderline significant association between Cdx-2 and BMI. Later on, in a longitudinal study it was shown that Cdx-2 did not increase the odds of central obesity( Reference Beydoun, Tanaka and Beydoun 46 ). In another study, the Cdx-2 SNP was associated with BMI and FM in Chinese men( Reference Gu, Xiao and He 42 ). Arai et al.( Reference Arai, Miyamoto and Taketani 45 ), have shown that this polymorphism (an A–G transition in the intestine-specific binding site of transcription factor Cdx-2 in the 5′ promoter region of VDR) results in a 30 % reduction in transcriptional activity of the promoter, decreases intestinal VDR expression and affects Ca absorption in the intestine.
Another finding is that in the GG genotype group the baseline level of 25(OH)D was higher than that of the other genotype groups, without any significant changes after vitamin D intake for 12 weeks. However, this is an unusual finding without any decisive explanation. The only explanation is that mutation at this site (Cdx-2) may lead to lower production of mRNA and then lower production of active VDR protein( Reference Uitterlinden, Fang and van Meurs 47 ).
Limitations of our study should be acknowledged. Extension of the changes observed after 12 weeks’ intervention to longer periods of time and, above all, their possible protective effect against long-term diabetes complications requires well-designed longitudinal controlled studies. Additionally, the sample size was relatively small, and the subjects recruited were mainly middle-aged and elderly, limiting the ability to generalise these findings to the more heterogeneous population. Finally, the majority of BIA equations underestimated percent body fat as body fat increased( Reference Newton, Alfonso and White 48 ).
In conclusion, the key findings of the present study point to an efficacy of intake of 25 μg/d vitamin D through FD on the central obesity markers, including TF and visceral adiposity in the subjects with T2D. To our knowledge, this is the first study to examine the interactive effects of VDR-Cdx-2 polymorphism and vitamin D intake on central obesity indices of diabetes host response. According to the high prevalence of vitamin D deficiency in Iran and a rather high proportion of non-responders in Cdx-2 genotypes (AG and GG) to vitamin D intake, stakeholders may need a better policy for the proportion of the community in whom up to 25 μg/d vitamin D may not be effective enough to improve insulin resistance and related morbidities. Further, nutritional support may be ‘tailored’ individually according to their genotype. However, further research is needed to replicate those findings in different populations, including populations of other racial and ethnic groups, in order to confirm the biological significance of Cdx-2 polymorphism in relation to central obesity phenotype.
Acknowledgements
The authors thank the Iranian Diabetic Society and Gabric Diabetic Society for their collaborations. The authors sincerely appreciate all the subjects for their participation in this study.
This study was funded by NNFTRI (grant no. 035360), TUMS (grant no. 10533) and Iran National Science Foundation (grant no. 8800420), in order of their financial contributions.
T. R. N. designed and supervised the study, was involved in laboratory analyses and wrote the finalised manuscript. A. D. and S. S.-B. both helped intellectually in finalising the study design. S. S.-B. performed most of the laboratory analyses, wrote the preliminary manuscript and was actively involved in the field work.
There are no conflicts of interest to declare.


