


Introduction
The analysis of morphological changes in small structures present within living cells often approaches the limits of light microscopy resolution. While some live cell super-resolution imaging modes have been developed to circumvent the diffraction-limited resolution of light microscopy [Reference Godin1], many laboratories do not have access to these relatively new systems. Moreover, all special methods based on super resolution (for example, STED, PALM, STORM, MINFLUX) are based on fluorescence techniques, so the only fine structures that can be revealed have been dyed with a fluorescent dye. Other surrounding details remain invisible even in these methods. Thus, software-based approaches are still required to improve visualization of structures that are near the resolution limits of standard light microscopy. In the example presented below we demonstrate a software-based approach to analyze fine structural changes in an in vitro model of thrombocyte activation and pseudopodia formation.
Thrombocytes, also called platelets, participate in the formation of a blood clot when a vessel is damaged. In normal situations the number of circulating thrombocytes ranges between 150,000 and 400,000 per μl of blood, and they are typically seen as 2–3 µm polygonal fragments in stained blood smears (Figure 1) [Reference Daly2]. When responding to an injury thrombocytes become activated, adhere to the site of damage, and undergo rapid morphological changes, including the formation of variously shaped projections or evaginations called pseudopodia [Reference Warren3]. The pseudopodia attach to sites of vessel damage and to other thrombocytes, forming an initial thrombocyte clot (primary hemostasis). Subsequently, fibrin fibers are generated that organize into a three-dimensional network (Figure 2) so that a fibrin clot is added to the pre-existing thrombocyte clot (secondary hemostasis).
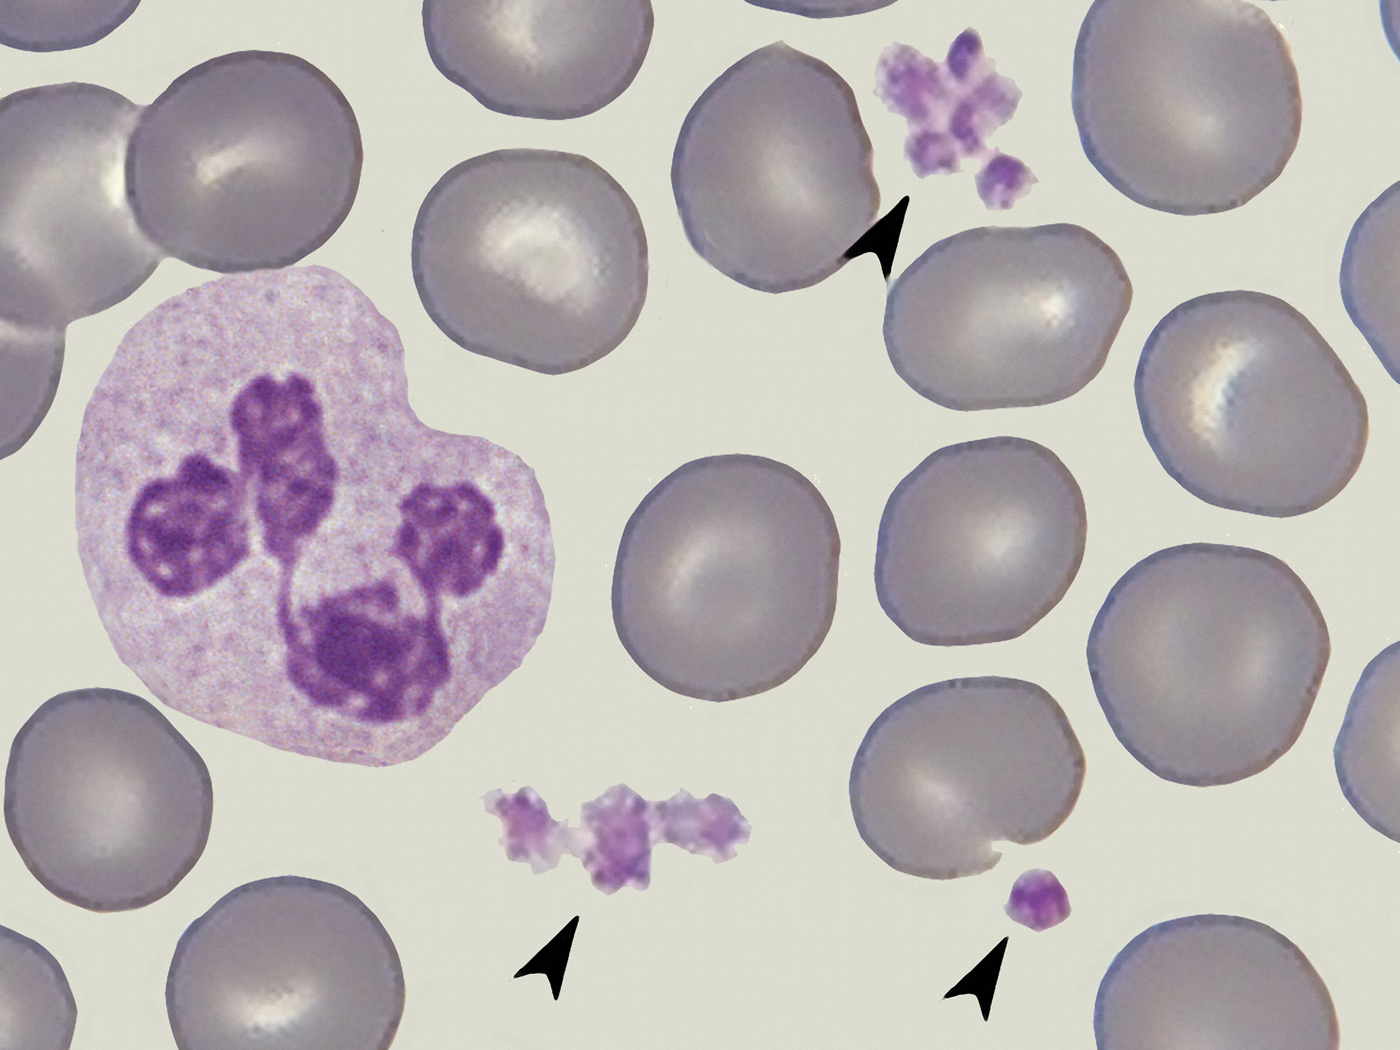
Figure 1: Thrombocytes (arrows) surrounded by erythrocytes and a neutrophil granulocyte, blood smear fixed and stained. Image collected with an oil immersion 100/1.32 bright-field objective (arranged image based on photomicrographs taken by Ronald Schulte, Netherlands). Image width = 40 µm.

Figure 2: Fibrin fibers taken from a thin-layer coverslip preparation of whole-blood. (a) Initial precipitation, (b) complex network. Images collected with an oil immersion 100×/1.32 phase contrast objective. Image width = 60 µm (a), 50 µm (b).
Platelets can also become activated when they contact a glass surface, such as a coverslip. In physiological circumstances and in cases of injuries, activation of platelets will be started within a very short time (< 1 minute), and the primary and secondary hemostasis are accelerated by several tissue components and tissue factors. When a blood smear is made, however, the thin layer becomes dry within some seconds. Moreover, accelerating tissue factors are absent in a blood smear. After drying, the air-dried smear is stained and fixed according to standard protocols. Thus, in normal circumstances, no pseudopodia can be seen in such smears when platelets are examined, neither in stained or unstained smears examined in standard bright-field illumination nor in high resolving illumination modes used for examination of very small structures and thin layers such as reflection contrast (Leitz) or immersion contrast (Zeiss). On the other hand, platelets are successively activated when they remain in a living state for a longer time during a fresh cover slip preparation. When platelets come in contact with glass surfaces, outside of the body, they are activated within circa 8–16 minutes [Reference Kraus4]. This provides a mechanism to study the process of activation and morphological modifications in living platelets using a light microscope equipped with a high-resolution oil immersion lens as well as an oil immersion dark-field condenser. However, scanning electron microscopy (SEM) and corresponding light microscopy measurements (the latter ones carried out by ourselves) indicate that the diameter of a pseudopodium is approximately 0.25 to 0.5 µm. Thus, visualization of morphological changes and fine detail in pseudopodia is often a difficult task with wide-field light microscopes since the image resolution in these instruments is limited to about 0.2 µm in standard applications.
Additional problems may result from the camera used during collection of digital images if the size of the sensor, and the resulting size and number of pixels in the image are restricted. In many devices used for live cell image acquisition, video modes for slow-motion studies are especially affected because of restrictions on available sensor sizes. In images taken at the resolution limit of the optical system and/or the sensor used, several software-based strategies can be helpful for enhancement of visual information. In this article, various methods of image reconstruction are presented and demonstrated using high-magnification images of activated thrombocytes in live cell preparations.
Material and Methods
Image acquisition
Thin-layer coverslip preparations were made from human thrombocytes gathered from thrombocyte concentrates and examined with a dark-field microscope employing an oil immersion lens (100×/1.32-0.60) fitted with an iris diaphragm [Reference Krauss5]. Time-lapse video clips were taken with a CCD camera (sensor: 1600 × 1200 pixels). In still images extracted from these video clips smaller partial images (667 × 491 pixels), showing a rectangular area of 140 × 103 µm (= 4.76 pixels per μm) containing about 50 single thrombocytes per image, were cropped out. The author also received several variants of still images from Dr. M. J. Kraus, University of Koblenz, Germany. From these partial images, squares (80 × 80 pixels) corresponding to 16.8 × 16.8 µm were cropped out. Each of these squares showed one single thrombocyte in an activated stage. In these thrombocytes the average diameter of pseudopodia was about 0.5 µm, corresponding to 2.38 pixels. All cropped images sized to 80 × 80 pixels were rendered by multi-step post-processing in order to improve final image quality and fidelity of fine structures as described below.
Image processing
The following software-based procedures were used for successive rendering: zooming and interpolation (Photozoom Pro, BenVista Ltd.; http://www.benvista.com/), focus stacking and deconvolution (Picolay: http://www.picolay.de/; Combine ZP: https://combinezp.software.informer.com/download/; Fitswork: https://www.fitswork.de/software/softw_en.php), high-dynamic range (HDR) rendering (Photomatix Pro: https://www.hdrsoft.com), and contour rendering (Sobel operator). Finally, additional procedures were carried out by use of standard image editing software: conversion to a grayscale image, digital inversion, equalization of the background, and adjustment of brightness, contrast, histogram, and gradation.
With zooming software, small images can be “blown up” so that fine details and contours appear with improved clarity and precision, especially with use of the S-spline algorithm [Reference Piper6,Reference Piper7]. A series of several images of the same feature (that is, the same specimen and equipment) taken at different focal planes are needed for focus stacking. These images were superimposed so that only in-focus zones were selected for reconstruction of the final image, and any out-of-focus regions were discarded. Out-of-focus regions were further eliminated by repetitive stacking using different software and/or algorithms and/or by use of deconvolution software, which is also based on iterative superimposition [Reference Swift8,Reference Sibarita9]. In over- or under-exposed zones fine details can be lost. In this case, images were duplicated for a series of different brightness/exposures so that each specimen zone was well exposed in at least one of the duplicates. The differentially exposed images were superimposed and rendered with HDR software so that a final image was generated that was free from incorrect exposure setting [Reference Piper10,Reference Piper, Hewitson and Darby11]. Thus, even in dark and bright zones, fine details were revealed. The Sobel operator was then used for edge detection so that fine marginal lines were accentuated [Reference Piper, Hewitson and Darby11,Reference Russ12]. With this combination of techniques, fine details in small pseudopodia of living thrombocytes were examined. All reconstructed images were further optimized by the common procedures mentioned above.
Workflow
In principle, the workflow described can be carried out in two ways:
Variant 1: All single-shot images selected for focus stacking are firstly “blown up” (that is, zoomed) by use of the S-spline algorithm. In a seconded step, the corresponding images resulting from this zooming are superimposed to a focus stack. In the case that this stack is affected with over- and under-exposed zones, duplicates may be made based on different brightness in order to be rendered with HDR techniques. The resulting image reconstruction can be rendered further with the Sobel operator and other standard techniques if necessary.
Variant 2: All single-shot images selected for focus stacking are firstly superimposed to a focus stack. The resulting image characterized by optimized distinctness is zoomed based on the S-spline algorithm. The remaining procedures can be carried out as described in Variant 1.
Note that even in flat or thin specimens that appear completely in focus, focus stacking can lead to a higher level of distinctness when several images or duplicates of one original image are superimposed by use of appropriate stacking software.
Results
In an original still image (667 × 491 pixels) extracted from a video clip (Figure 3), circa 50 thrombocytes were captured in the specimen area (140 × 103 µm). Figure 4 shows the right part of the image cropped out and digitally inverted. In the inverted grayscale image (Figure 4, right) small pseudopodia were seen at higher contrast when compared against the bright background. A “thrombocyte of interest” (marked by a red arrow in Figures 3 and 4) was selected for further processing. This single thrombocyte was cropped out again and presented in an 80 × 80 pixel square showing a 16.8 × 16.8 µm area. It is clear that fine details were lost in this cropped image (Figure 5a). By zooming and re-interpolation with Photozoom Pro (S-spline algorithm) followed by successive focus stacking (carried out with Picolay and Combine) fundamental improvements of image quality were achieved so that all the pseudopodia can be clearly seen (Figure 5b). Contours can be further accentuated by the Sobel operation implemented in the deconvolution software Fitswork (Figure 5c).

Figure 3: Activated thrombocytes taken from a platelet concentrate on a coverslip preparation. Images collected with an oil immersion 100×/1.32-0.60, dark-field objective and extracted from a video clip. Specimen area is 140 × 103 µm; size of the original image: 667 × 491 pixels, arrow: thrombocyte of interest (photograph taken by Dr. M. J. Kraus, University of Koblenz, Germany). Image width = 140 µm.

Figure 4: Section from Figure 3 showing the right part. (a) Original grayscale image, (b) digital inversion. The arrow indicates the thrombocyte of interest. Image width = 77 µm.

Figure 5: Close-up view of a single thrombocyte cropped from Figure 3. The size of the original section was 80 × 80 pixels, and the specimen area imaged was 16.8 × 16.8 µm. (a) Resized version was 1700 × 1700 pixels; (b) multi-step post-processing with Photozoom, Picolay, and Combine; (c) edge detection with Sobel operator. Image widths = 16.8 µm.
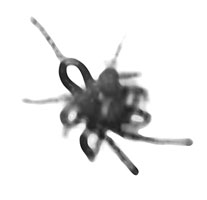
Different morphological types of pseudopodia could be distinguished in the reconstructed images: sausage-shaped (Figure 6a), spike-shaped (Figure 6b), with discoid apices (Figure 6c), and loop-shaped (Figure. 6d). These fine structural nuances were only resolved in a clear and distinct manner by the multi-step post-processing described. By digital inversion of the grayscale images, the fine tails of pseudopodia could be further accentuated (Figure 7).

Figure 6: Variability of morphologic appearance in several activated thrombocytes. All images were rendered with Photozoom, Picolay, and Combine. Additional HDR rendering was performed in images a–c, including Photomatix Pro and Details Enhancer. In b, Tone Compressor was also used. Image width = 16.8 µm

Figure 7: Images from Figure 6 digitally inverted.
Discussion
The various morphological types of pseudopodia observed following digital reconstructions may lead to several functional considerations. In activated thrombocytes, pseudopodia (projections) are required for locomotion, interaction with other pseudopodia and damaged areas of vessels, and aggregation and adhesion with other thrombocytes. Sausage-shaped pseudopodia are the most often observed and described type (Figure 6a) and may play a primary role in clot formation. Spike-shaped pseudopodia (Figure 6b) may give enhanced stability when thrombocytes are fixed on a smooth matrix, and discoid apices (Figure 6c) may promote strong adherence to flat surfaces. Previous electron microscopy studies [Reference Warren3,Reference Dharampal13–Reference Warren15] have shown that the apical regions of thrombocyte pseudopodia may also act as reservoirs of various mediators deposited in small granules. Loop-shaped pseudopodia (Figure 6d) may serve as “connectors” when several thrombocytes connect in string-like aggregates. Of course, based on the static images presented here, these considerations are hypothetical. However, they may provide insight into the functional roles of the various thrombocyte morphologies. The shape of pseudopodia shown here correspond with their morphological appearance documented in SEM images [Reference Zilla16]
The software-based processing described here leads to substantial improvements in the global visual information and quality in images, especially when small structures are documented and sized at the given resolution limit. These improvements may also be of clinical interest. Recently, the first prototypes of systems have been developed which can be used for automatic and standardized morphological analyses of living thromboccytes [Reference Kraus4,Reference Kraus17]. Thus, the process of activation can be documented and quantified in healthy persons and in patients treated with a singular or dual antiplatelet therapy. In dual antiplatelet therapy (DAPT) two different antiplatelet drugs are combined with each other (ASS plus P2Y12 receptor antagonist). Unfortunately, some patients treated with antiplatelet drugs are non-responders so that the respective drugs are not effective and patients are not protected against cardiovascular and cerebral complications. In current clinical routine, the effect of such antiplatelet therapies can be measured with indirect methods (VASP test or “verify now” [Reference Harrison18], for instance) so that non-responders can be detected. But the sensitivity and specificity of these tests are limited so that they are not yet generally accepted. The kinetics of platelet activation measured in healthy persons based on cover slip preparations and automatic image analysis is shown in Figure 8 (derived from [Reference Kraus4]). When platelets are activated and pseudopodia are formed out, the platelet's area increases and its circularity decreases. This model promises a new way for detecting responders and non-responders in antiplatelet therapies based on direct morphological findings (instead of indirect methods). Figure 8 shows some hypothetical curves pointing to effective antiplatelet therapy.

Figure 8: Morphological changes and kinetics of platelet activation in cover slip preparations (derived from [Reference Kraus4]). Hypothetical graphs of normal individuals (red) and patients treated with antiplatelet therapy (green). Sketches of thrombocyte shape indicate that pseudopodia projections appear after about 15 minutes elapsed time and begin to disappear after about 40 minutes.
Of course, the correctness of each sort of image analysis is influenced by the clarity and correctness of the images analyzed. Thus, the precision of such analysis systems might be improved further when appropriate algorithms of image processing, along the lines of the descriptions here, can be implemented in the future.
Conclusions
Pseudopodia of thrombocytes are near the resolution limits of light microscopy and contain significant detail, making them an ideal sample type for testing software-based image enhancement protocols. The software-based strategies presented here are capable of fundamental improvement of visual information and precision in revealing fine details sized at the resolution limit of the microscope system and/or digital sensor used. Clarity and distinctness of fine contours in thrombocytes were enhanced, as well as the focal depth and fidelity of small structures and zones affected by poor image exposure. Activated thrombocytes are easily cultured and imaged, making them well suited for demonstration of these software enhancement effects in living samples. The software-based methods described could be implemented in image analyzing systems.
Acknowledgements
The author thanks Dr. Max-Joseph Kraus, University of Koblenz, Germany, for several still images obtained from video clips which were used for multi-step image rendering. He also thanks Mr. Ronald Schulte, Netherlands, for images used as material for the arrangement shown in Figure 1.


