Introduction
Globally, rapeseed (Brassica napus L.), also known as canola, is an economically important oilseed crop and one of the most important multipurpose edible crops (Zhu et al., Reference Zhu, Monroe, Suhail, Villiers, Mullen, Pater, Hauser, Jeon, Bader, Kwak, Schroeder, McKay and Assmann2016). It is the third largest source of vegetable oil in the world after soybean and perennial oil palm (FAO, 2021). As a relatively new oilseed plant with more than 40% seed oil, rapeseed is considered as one of the most important plants, producing about 13% of the world's edible oil. Rapeseed oil contains less than 2% of erucic acid and its meal has less than 30 μg of glucosinolate (Thiyam-Holländer et al., Reference Thiyam-Holländer, Eskin and Matthäus2012). Due to its suitable agricultural characteristics, including high water consumption efficiency and relative tolerance to drought stress, rapeseed can be used as an alternative crop for grain-based crop rotations, especially in areas with arid and semi-arid climates (Hegewald et al., Reference Hegewald, Wensch-Dorendorf, Sieling and Christen2018). Iran is among the hot and dry countries of the world, receiving a third of the global precipitation rate (240 mm per year), and drought is considered as one of the most important factors limiting production (Sabzevar et al., Reference Sabzevar, Rezaei and Khaleghi2021). Oil is the most important quality characteristic of oilseeds and the amount of oil in oilseeds is influenced by environmental conditions including drought. Therefore, understanding the effects of drought on morpho-physiological traits and identification of drought-tolerant genotypes is necessary.
Assessing genetic diversity which is a valuable component of plant breeding based on morphological characteristics is widely used, but these characteristics are affected by environmental factors and plant growth stages (Govindaraj et al., Reference Govindaraj, Vetriventhan and Srinivasan2015). To overcome this issue, molecular markers can provide effective and precise means of selection and provide detailed information about genetic variation. This information is essential for future breeding programmes aiming to better protect and use genetic resources (Shaygan et al., Reference Shaygan, Etminan, Majidi Hervan, Azizinezhad and Mohammadi2021). DNA-based markers are the most widely used and have broad applications for genotyping to improve plant selection. Among these, inter simple sequence repeat (ISSR) markers are widely used in genetic diversity research due to their ease of use, high reproducibility and polymorphism. The main advantage of ISSRs is that no sequence data for primer construction are needed. And for the analytical procedures like polymerase chain reaction (PCR), only low quantities of template DNA are required. Furthermore, ISSRs are randomly distributed throughout the genome (Godwin et al., Reference Godwin, Aitken and Smith1997). Assessing the effect of drought stress on 10 rapeseed genotypes using ISSR markers and morphological traits, Nemati stated that these markers revealed high genetic diversity for the studied rapeseed genotypes that can be used for breeding programmes (Nemati et al., Reference Nemati, Asghari, Sofalian, Rasoulzadeh and Mohamaddoust Chamanabad2012). Moreover, there are several reports in which DNA-based markers were used. For example, in the study by Tian the genetic diversity of 127 genotypes of B. napus, Brassica rapa and Brassica juncea species was investigated by using genome-specific SSR primers. The results showed that 36.86% of the variance was due to a significant difference between species populations, suggesting a high genetic variation among B. napus, B. rapa and B. juncea genomes (Tian et al., Reference Tian, Channa and Hu2017). Safari and Mehrabi (Reference Safari and Mehrabi2015) also studied the genetic diversity among 45 rapeseed genotypes by 15 ISSR markers.
This preliminary investigation aimed to identify rapeseed genotypes with resistance to drought and tolerance to low temperatures, suitable for cultivation in the mountainous and arid regions of northern Iran. The study investigates the genetic relationships and differentiation of 14 new genotypes, preselected from a larger screen of rapeseed utilizing molecular markers (ISSR), in addition to screening and analysing the degree of variation in morpho-physiological features and oil content between different rapeseed genotypes in response to drought stress. This is the first time that an investigation has specifically focused on drought effects in rapeseed for cultivation in northern Iran.
Materials and methods
Study location and plant materials
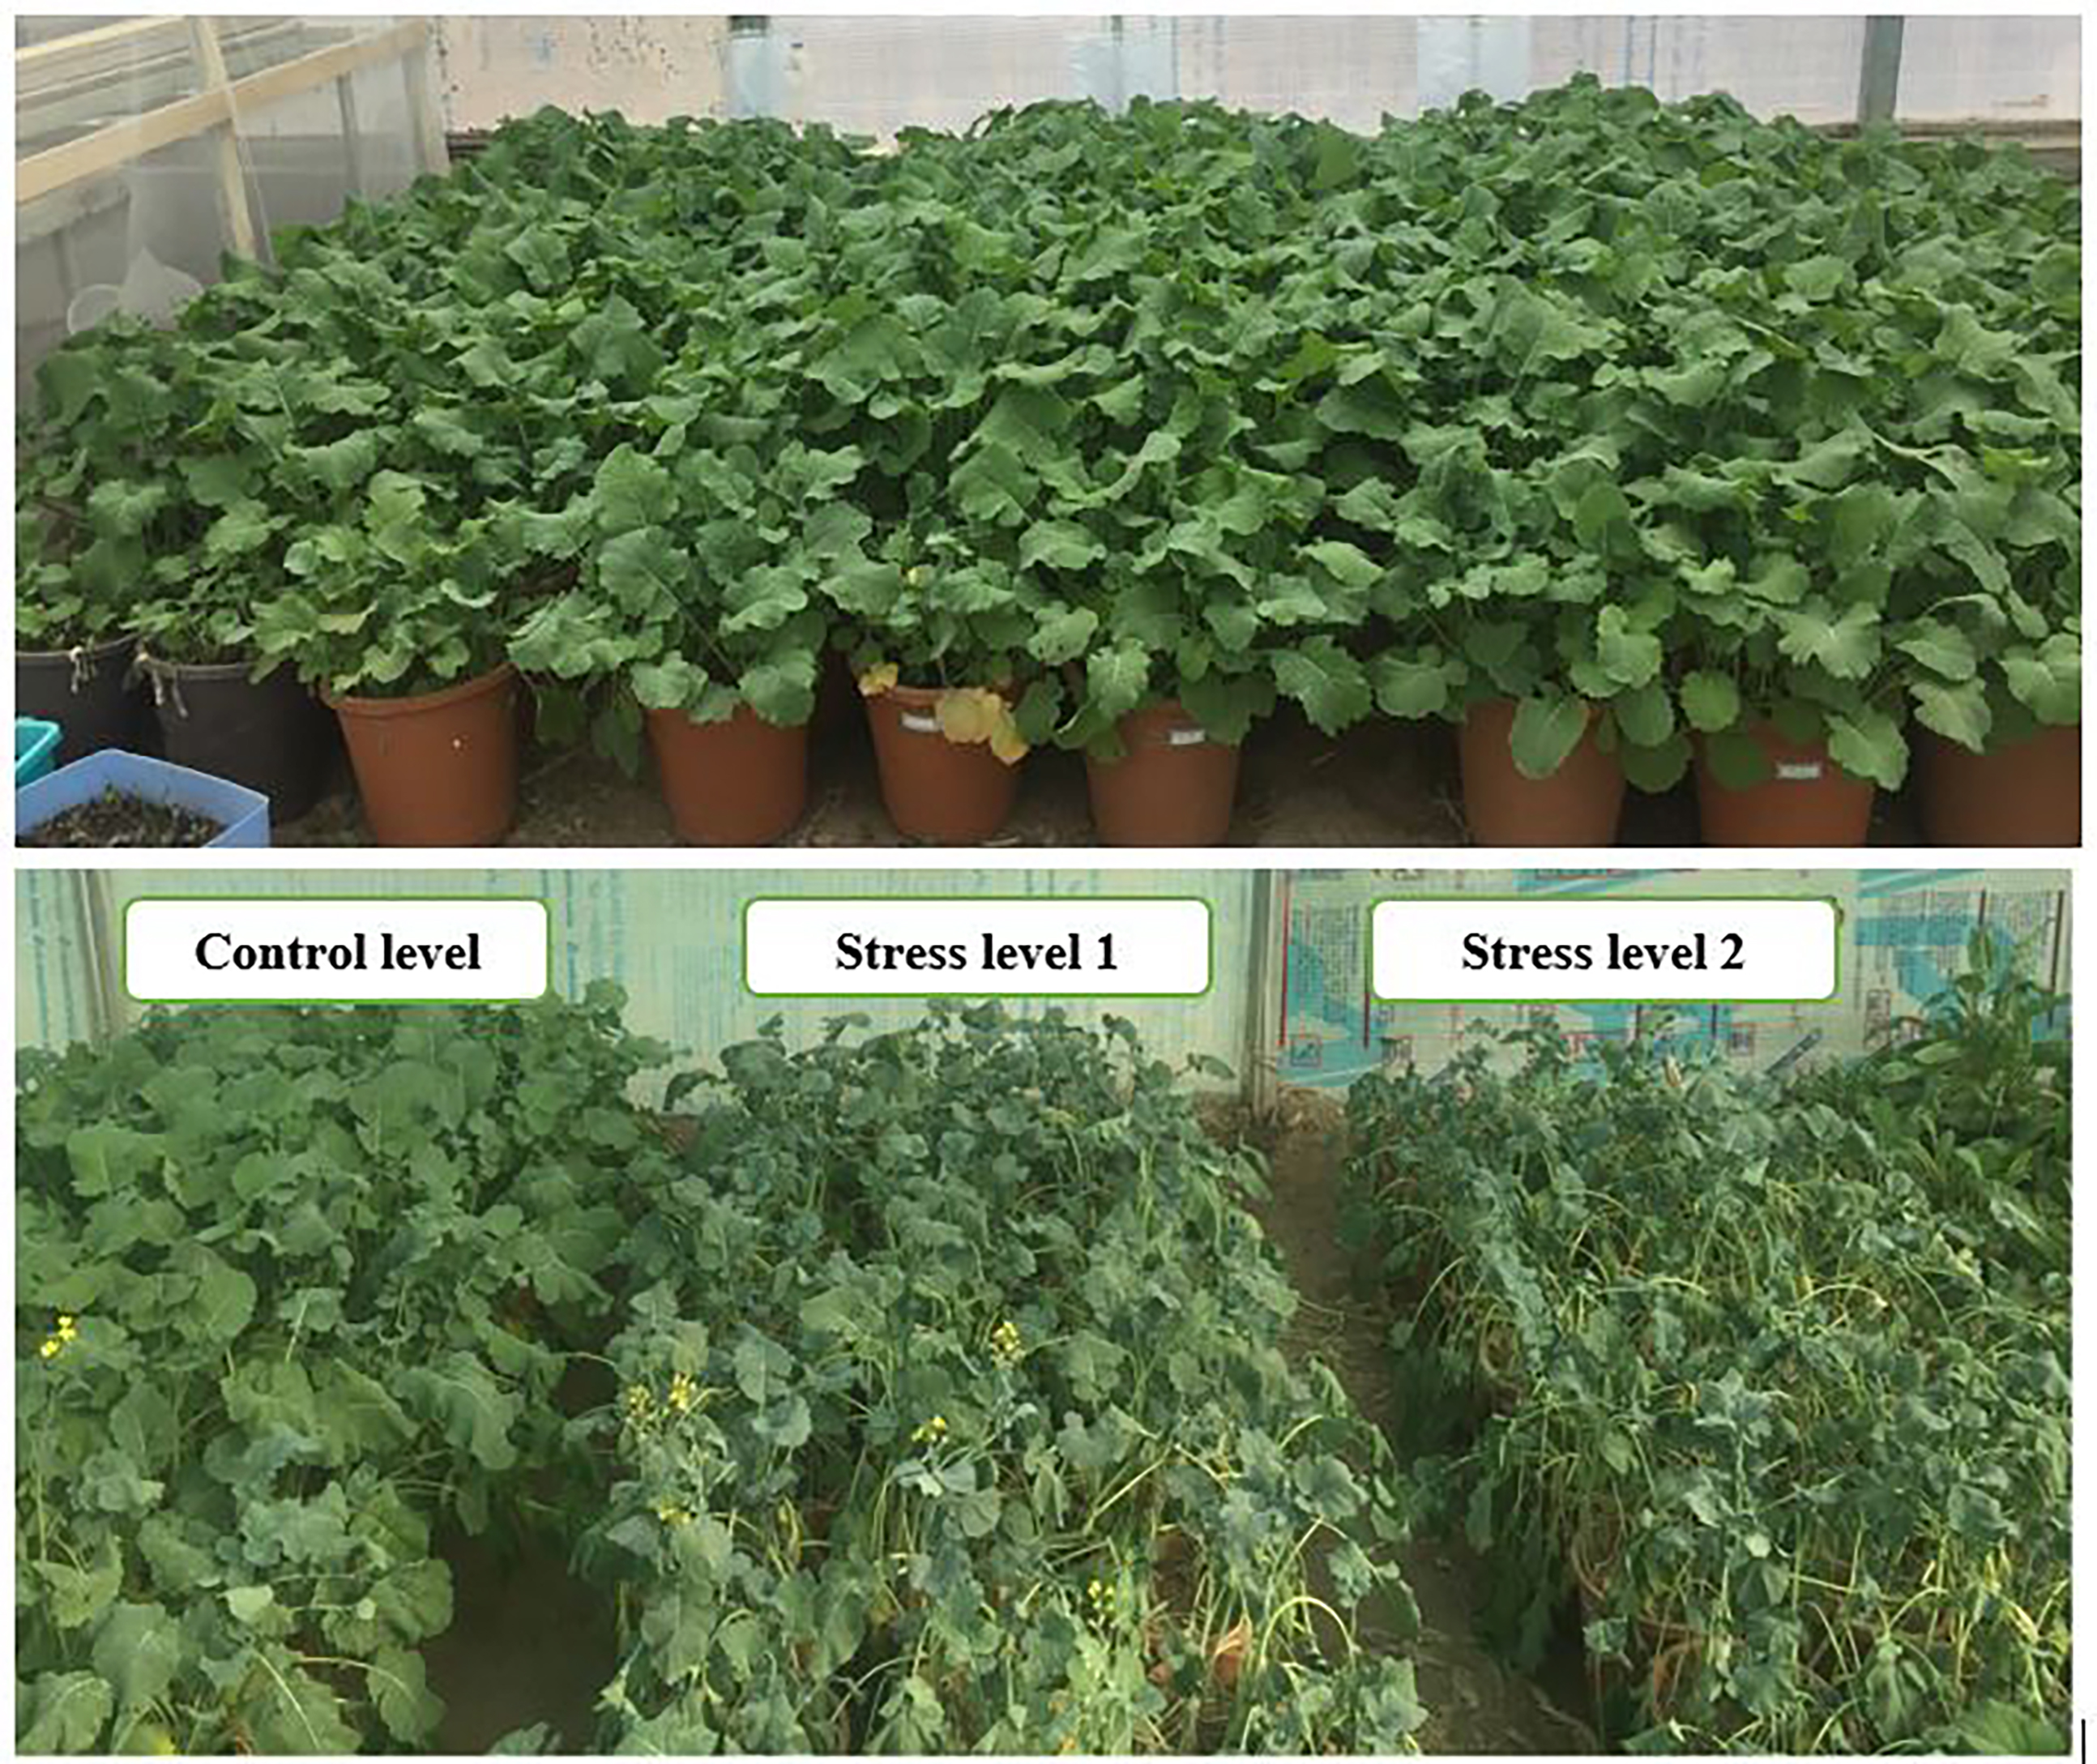
The present study was conducted in the greenhouse of Mohaghegh Ardabili University under controlled conditions including a 14 h photoperiodism (14 h of light and 10 h of darkness) at a temperature of 18–25°C using a factorial completely randomized design with three replications per treatment (online Supplementary Table S1). Each replicate was considered as a pot (14 litres) with six canola seedlings. A total of 14 winter rapeseed genotypes (obtained from Gene Bank of Iran) (Table 1), were evaluated for water-stress tolerance. Different levels of irrigation were evaluated, including complete irrigation (field capacity) as control and irrigation after 60 and 85% depletion of available soil moisture as two levels of stress, respectively. The moisture content was measured using a Moisture Probe Meter (MPW-160-B [12-bit resolution], Sydney, Australia). The device was calibrated before use. Leaf samples were collected on the 10th day after imposition of the stress in three levels and stored in a freezer at −70°C. FAO Irrigation and Drainage Paper No. 56 was used to determine stress levels (Allen et al., Reference Allen, Pereira, Raes and Smith1998). The experiment was performed twice and the results obtained from either experiment were the same. All the data related to measured traits are shown in the Supplementary files.
Table 1. Name, origin and growth types of oilseed rape genotypes

Morpho-physiological evaluation
Ten days after applying the stress, leaf samples were collected from all the pots at three levels and stored in a refrigerator at −70°C. The following morphological traits were measured: days to flowering and plant height during flowering and grain yield. Two genotypes (Okapi 0 and Okapi 31) did not reach the flowering stage. Therefore, morphological traits were measured in 12 genotypes.
Photochemical activity of photosystem II characterized by F v/F m and F v/F 0 values were measured by a chlorophyll fluorometer (Opti-Sciences OS-30p+ Fluorometer, Hudson, NH, USA; Tsimilli-Michael and Strasser Reference Tsimilli-Michael, Strasser and Varma2008). Soil plant analysis development (SPAD) values were monitored by a SPAD-502 meter (Konica Minolta Inc., Osaka, Japan).
The following physiological parameters were measured as well: photosynthetic pigments by the method of Lichtenthaler (Reference Lichtenthaler1987), relative water content (RWC) of leaves by the method of Ritchie et al. (Reference Ritchie, Nguyen and Holaday1990), anthocyanins by the method of Wagner (Reference Wagner1979), total carbohydrates by the method of Irigoyen et al. (Reference Irigoyen, Einerich and Sánchez-Díaz1992), proline using the method of Bates et al. (Reference Bates, Waldren and Teare1973) and the total protein from the youngest leaves using the Bradford (Reference Bradford1976) method.
Before the analysis of variance, a data normality test was performed using Kolmogorov and Smirnov methods for all traits. Statistical analysis was performed using SPSS 19 and SAS software and the mean comparison was calculated with the Duncan test at 5% probability level.
Oil extraction
B. napus seed samples were collected and stored in paper envelopes in a refrigerator. The seeds were powdered using a mill and then used for oil extraction. Oil content samples were extracted according to the method of Azadmard-Damirchi et al. (Reference Azadmard-Damirchi, Alirezalu and Fathi Achachlouei2011). And to determine the oil percentage, the weight of the oil obtained from 100 g of rapeseed samples by the Soxhlet method (Uquiche et al., Reference Uquiche, Jerez and Ortiz2008) was used.
Molecular evaluation
DNA was extracted from young leaves using the cetyltrimethylammonium bromide (CTAB) method with slight changes (Saghai-Maroof et al., Reference Saghai-Maroof, Soliman, Jorgensen and Allard1984). The quality and concentration of the DNA were confirmed by electrophoresis on 1% agarose gel and spectrophotometry. Twenty-three primers (Metabion, Seoul, Korea) (Table 2) were selected for ISSR analysis. Eighteen primers marked with an asterisk (*) created the polymorphic bands. PCR amplification was carried out on the Techne PCR instrument and the reaction programme comprised an initial 5 min at 94°C; 40 cycles of 60 s at 94°C, 60 s annealing at the appropriate temperature for each primer and a 60 s extension at 72°C; finishing with a final extension of 5 min at 72°C and storage at 4°C. Agarose gel electrophoresis (1.5%) and subsequent staining with ethidium bromide were used for the identification of PCR products. Each DNA fragment was scored as a discrete variable, using 1 to indicate the presence and 0 for the absence of bands in each sample, and the analysis of molecular data was performed using NTSYSpc2, Popgen 1.32 and GenAlex 6.3 software.
Table 2. Sequence and annealing temperature of ISSR primers

To determine the efficiency of ISSR markers and to estimate the genetic divergence of the selected rapeseed genotypes, the performance of the markers was analysed using five parameters: PIC: polymorphism information contents, MRP: mean resolving power, RP: resolving power, MI: marker index and EMR: effective multiplex ratio.
The PIC value for each locus (band) was measured as follows:

where fij is the frequency of the jth pattern of the ith band as presence (1) or absence (0), in case of dominant markers. After this, the PIC of every ISSR marker was measured as:

where n is the total number of polymorphic bands for that marker (Chesnokov and Artemyeva, Reference Chesnokov and Artemyeva2015).
MRP is a parameter which is used to characterize the capacity of the marker integration to analyse the differences among a number of genotypes. For the calculation of RP, information of a band (BI) is measured as:

where BIi is the informative of the amplicon and p is the percentage of the 14 species having ith amplicon. The RP of each primer was measured as:


where n is the number of polymorphic loci.
The EMR is defined as the number of polymorphic loci multiplied by the proportion of polymorphic loci:

where np and n are the number of polymorphic loci and the total number of loci, respectively.
The marker index (MI) is the product of the information polymorphism value and the effective multiplex ratio:

Results
Analysis of morphological traits
The results of variance analysis (online Supplementary Table S2) showed that the effects of drought stress, genotype and their interaction were significant in all the studied traits at 1% probability level. Hayola 401 had the least days to flowering in all control and stress levels, while Talaye and SLMO 46 had the highest plant height and grain yield under stress conditions, respectively. General heritability of traits varied from 0.8146% for days to flowering to 81.09% for grain yield. The effectiveness of phenotypic selection is affected by the genotype × stress (E) interaction (Sallam et al., Reference Sallam, Alqudah, Dawood, Baenziger and Börner2019).
Analysis of physiological traits
The variance analysis (online Supplementary Table S3) showed that the effect of water stress affected all the traits significantly at 1% probability level except for chlorophyll b. The studied genotypes showed significant differences in chlorophyll content, RWC, chlorophyll a, total chlorophyll, carotenoid, carbohydrate and proline. The interaction effect of genotype × stress was also significantly different in chlorophyll content, maximum fluorescence, relative content of water, chlorophyll b, total chlorophyll, carotenoid and carbohydrate. General heritability also varied from 0.185 in the fluorescence trait up to 65.52 in the chlorophyll content trait. The results related to mean comparison of the morphological and physiological traits showed that all traits except for plant height, seed yield, maximum fluorescence, RWC and chlorophyll b increased under stress conditions. Cluster analysis was performed by the Ward method using Euclidean distance, based on the arithmetic averages of morphological and physiological traits. The dendrograms obtained from cluster analysis divided the genotypes into two groups at the control and the second level of stress. Also, at the first stress level, the genotypes were divided into three groups (Fig. 1). At the control level, the first group had higher levels of fluorescence compared to the other group. And the second had high levels of chlorophyll, photosynthetic pigments and proline. The genotypes with a high genetic distance are suitable for hybridization and access to high heterozygous hybrids.

Figure 1. Grouping of canola genotypes based on the measured traits under control, first and second stress levels using the Ward method.
Discriminant analysis (online Supplementary Table S4) showed that genotypes in the three drawn dendrograms were correctly grouped based on the studied traits (control level, stress levels 1 and 2).
ISSR molecular analysis
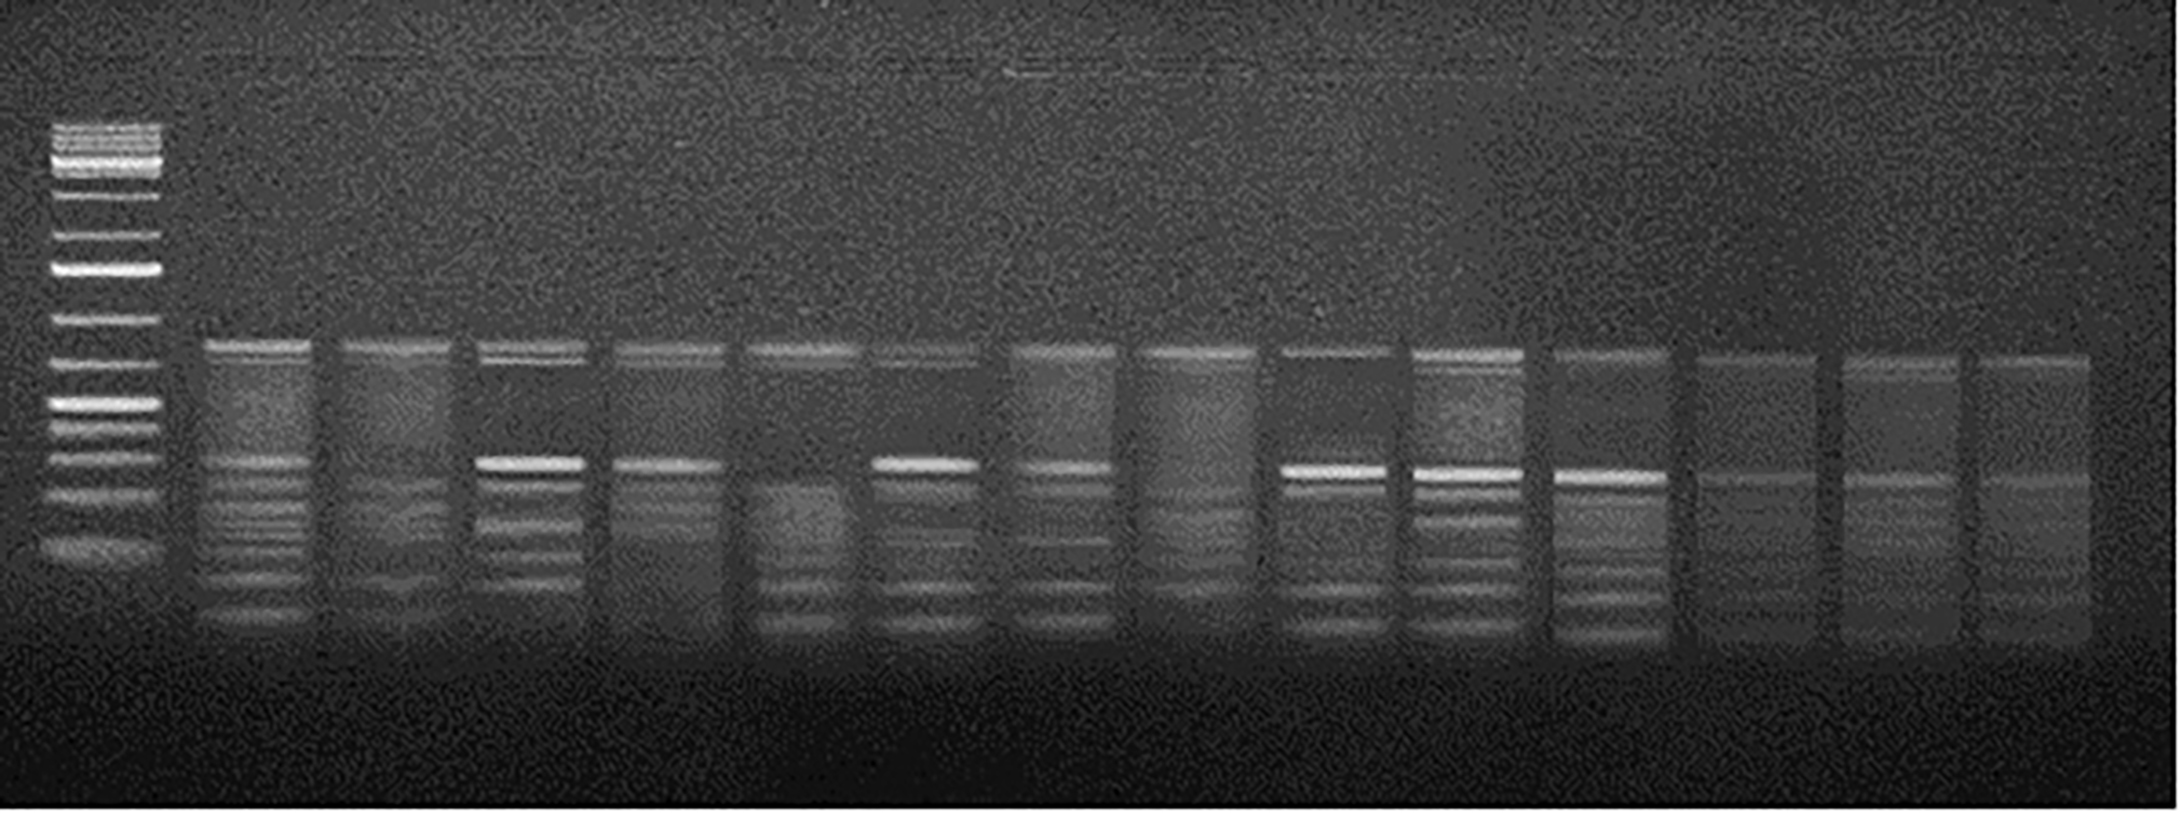
In this study, in order to detect and evaluate the diversity between rapeseed genotypes, ISSR molecular primers were used. After screening 23 primers, 18 primers produced clear patterns of multiple bands. A total of 106 clear and scalable loci were amplified, of which 60 bands (56.6%) were polymorphic (Table 3). An example of ISSR primer banding pattern (no. 17) is presented in online Supplementary Fig. S3. The polymorphism metrics (EMR, MRP, PIC, RP and MI) of the 16 ISSR primers are summarized in Table 3. Primer no. 9 revealed the highest PIC (0.365) and MI (1.881). The EMR ranged from 5.14 for primer no. 9 to 0.2 for primer no. 4 (mean: 2.09). Three primers (17, 9 and 5) with high RP values (4.46, 3.92 and 3.78) were introduced as the most efficient markers. Shannon's information index was 0.325 in our study. The primer no. 9 revealed pronounced discrimination of 85.7% polymorphism. On the other hand, primer no. 4 recorded the lowest polymorphism of 20%. Moreover, the observed and effective numbers of alleles were 1.56 and 1.38, respectively (Table 4). Considering sub-populations as groups, the average genetic variation (H s) was 0.1344 and the total genetic variation (H t) was 0.1982. The average degree of gene differentiation (G st) among rapeseed genotypes was 0.3218 in all locations. This result suggests that a larger share of the total variation is related to the diversity within the genotypes. The genetic distance between the genotypes based on the genetic distance of Nei (Nei, Reference Nei1987) ranged from 0.109 between Karun and Adriana up to 0.400 between Sarigol 32 and Tassillo.
Table 3. ISSR primers and their indices

PIC, polymorphism information contents; MRP, mean resolving power; RP, resolving power; MI, marker index; EMR, effective multiplex ratio.
Table 4. Genetic diversity parameters based on ISSR markers

Three different genetic distance coefficients (Dice, simple matching and Jacard) and three different clustering methods (unweighted pair group method with arithmetic mean [UPGMA], single linkage and complete linkage) were used in this analysis. Based on the highest cophenetic correlation coefficient, Jacard's genetic distance coefficient and UPGMA method were selected. Based on the results of the Mantel test, the cophenetic correlation coefficient (r = 0.81) was obtained, which indicates a high correlation between similarity matrices and final cluster diagrams. In this analysis, 14 rapeseed genotypes were divided into three groups (Fig. 2).

Figure 2. Grouping of canola genotypes based on ISSR data using Jacard similarity coefficient and UPGMA method.
Moreover, principal coordinate analysis indicated that the first three principal coordinates explained 64.67% of the molecular variations among the genotypes (online Supplementary Table S5).
Oil content
By applying stress, oil content decreased in all genotypes. There was no noticeable difference between the two levels of water stress (moderate and severe). Therefore, the t-test was used for comparison. There was a significant difference (0.01) between the amount of oil in the two levels of control and water stress (online Supplementary Table S6). Among the genotypes, Adriana with 36.47% had the highest amount and Karaj 2 with 27.82% had the lowest oil content in the control level. Among the genotypes, Karaj 1, Karaj 2, Sarigol 32 and Hayola 401 had the lowest decrease in oil content, which is a sign of better stability under stress conditions. Cooper, on the other hand, had the highest decrease in oil content.
Results of canonical correlation analysis
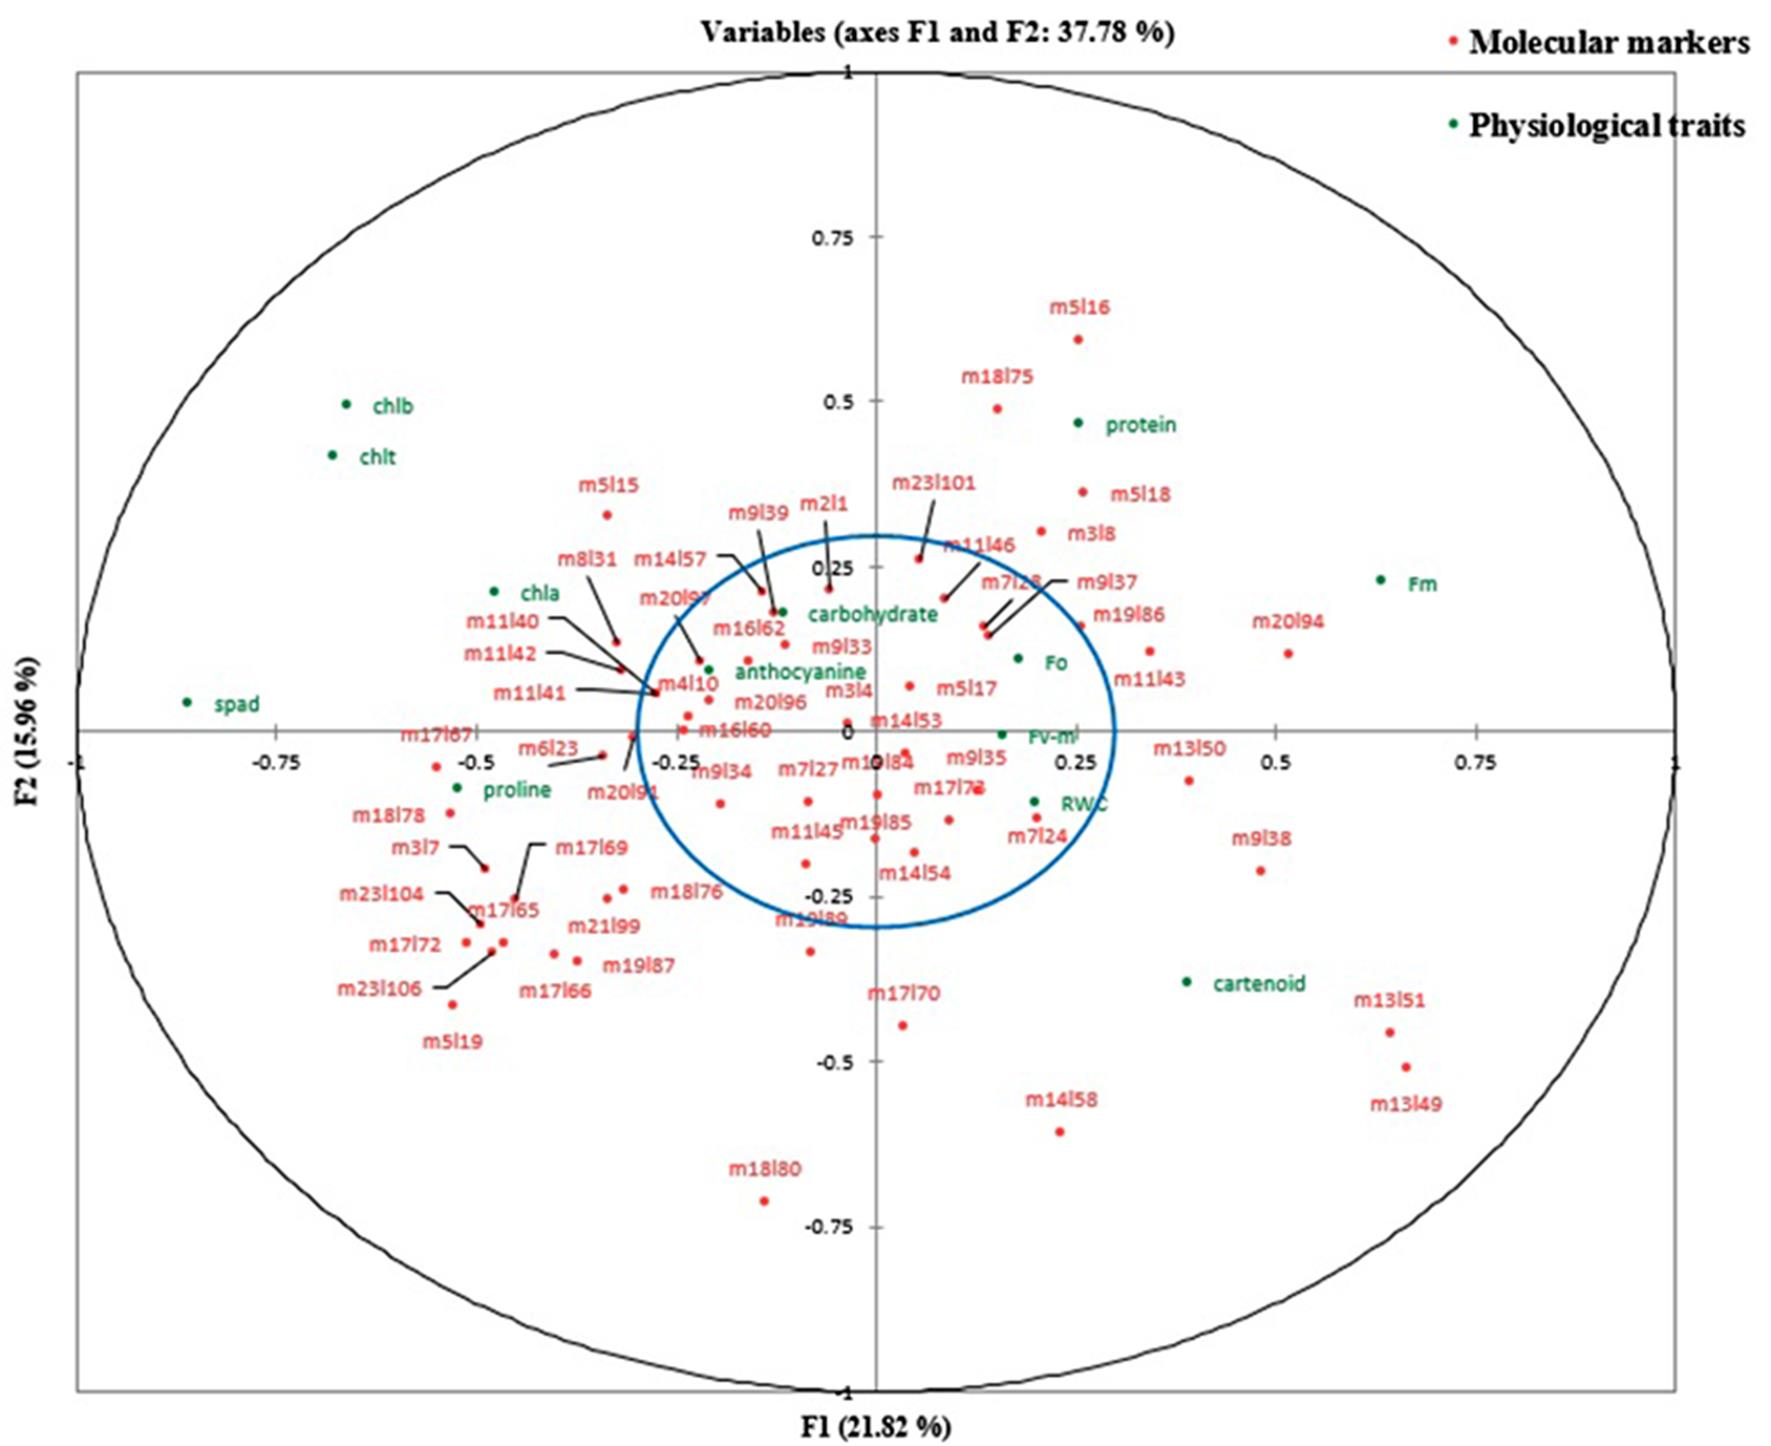
Canonical correlation analysis was used to find out the potential relationship between the measured traits and genetic parameters in the studied population. Canonical correlations of physiological traits and molecular markers and the proportion of variability explained by each pair of canonical variates were calculated at the control level and two stress levels separately.
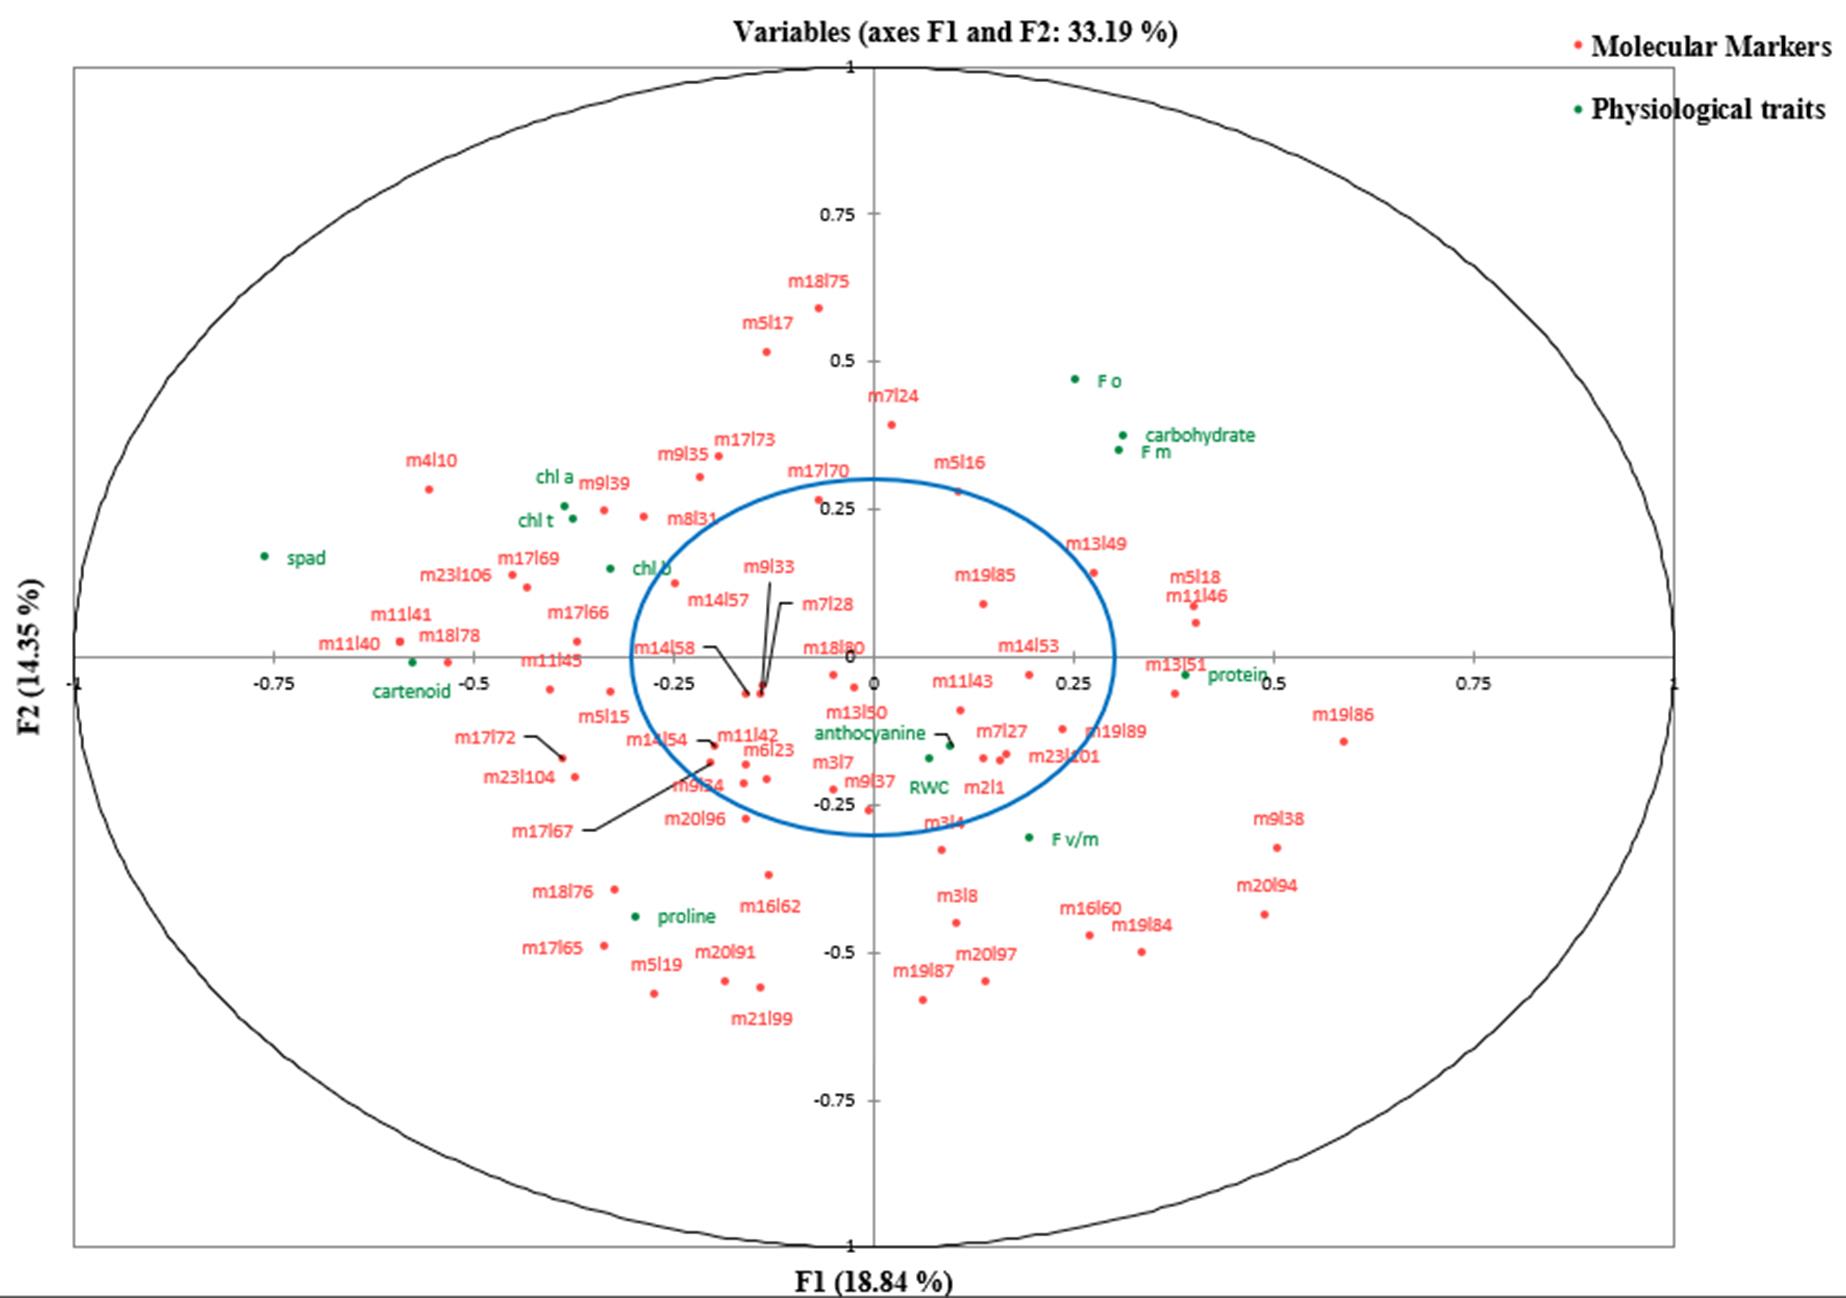
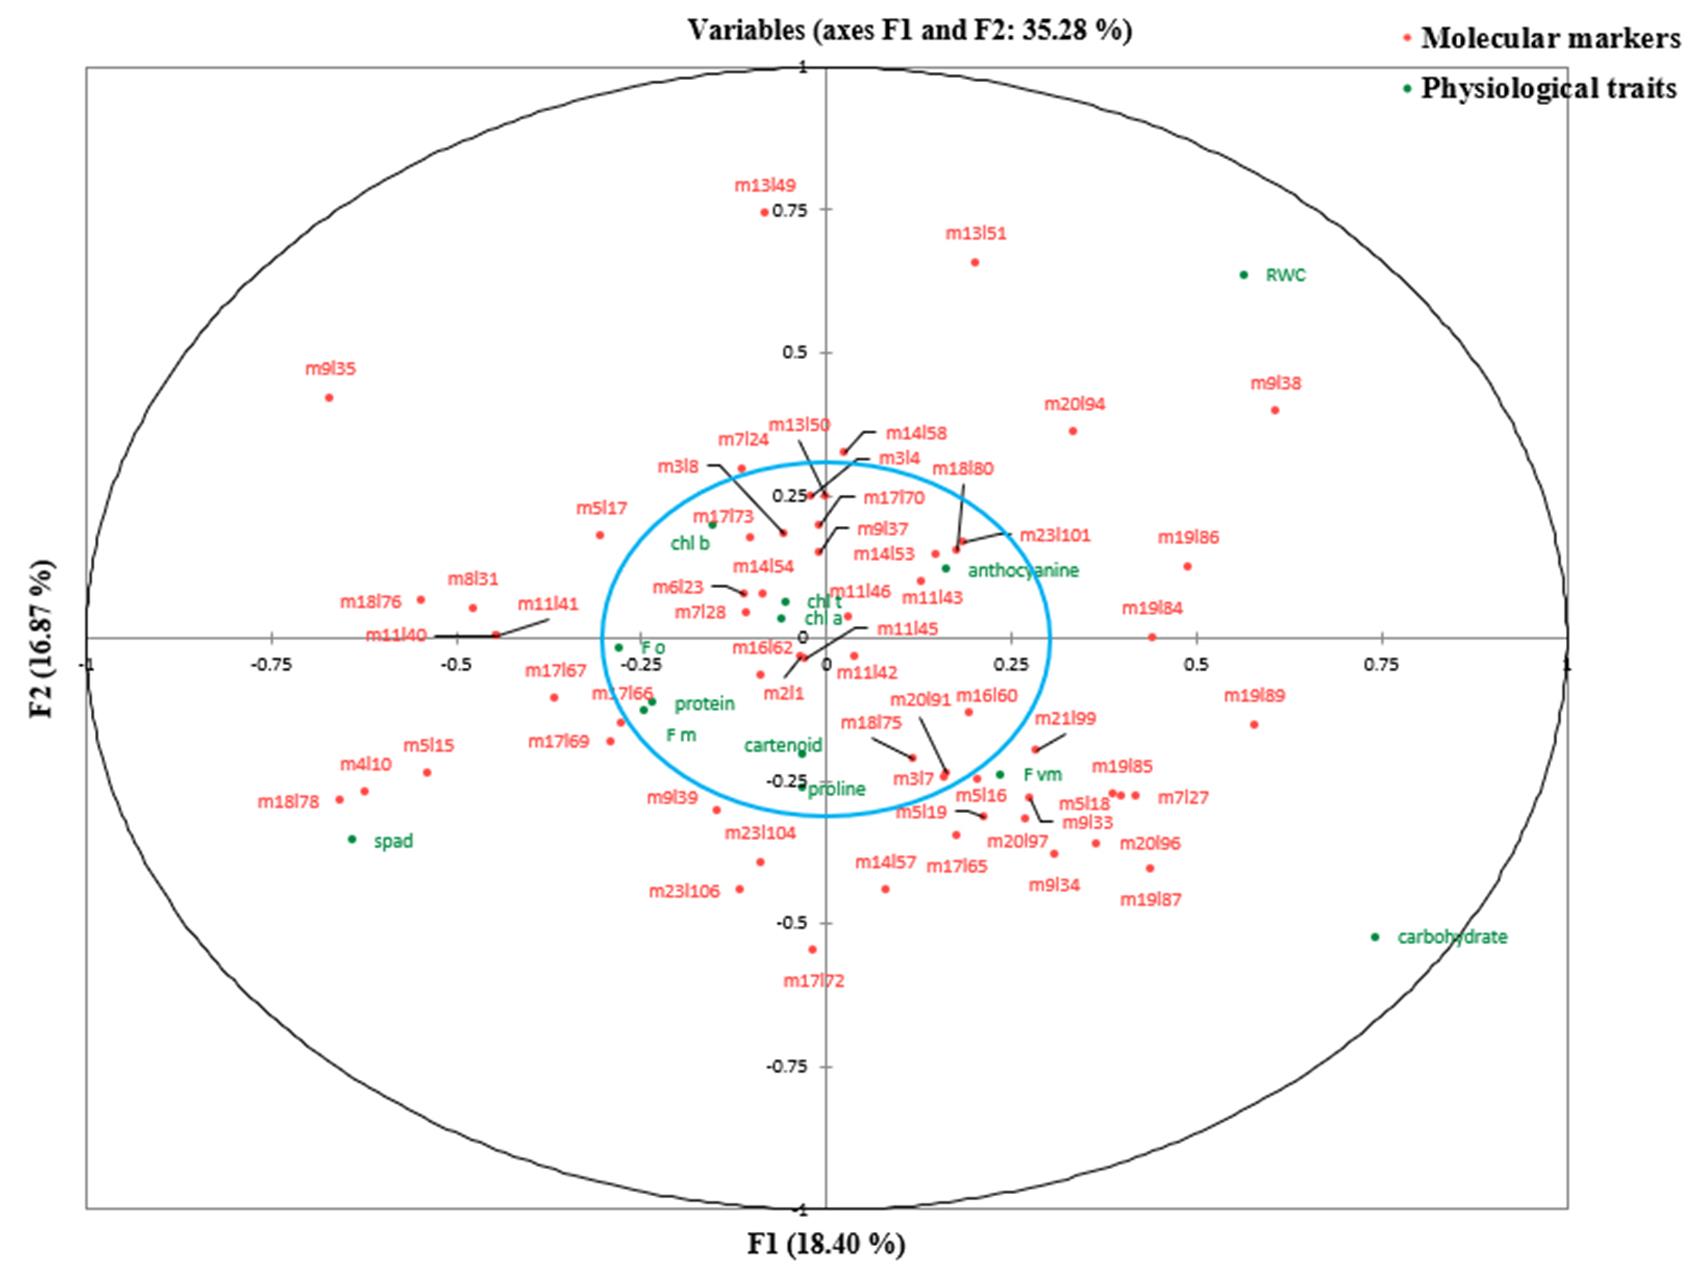
At the control level and the first level of stress (online Supplementary Table S7), the first canonical correlations (0.977 and 0.9629, respectively) between the first canonical variates (V1U1) were significant (P < 0.01). But, at the second level of stress, both the first (0.9662) and second (0.9446) canonical correlations between the first two canonical variates (V1U1 and V2U2) were found significant, so these functions were used to interpret the results of canonical correlation analysis at different treatment levels (online Supplementary Table S8). According to Tabachnick and Fidell (Reference Tabachnick and Fidell2001), correlations between the canonical variates and main variables that are greater than 0.300 are interpreted regardless of their positive or negative sign (±). At the control level, it was found that the first canonical variate of physiological traits (V1) positively correlated with chlorophyll content (SPAD), chlorophyll a, chlorophyll b, total chlorophyll, proline and anthocyanin, whereas high-negative correlations were observed between that of physiological traits (V1) and maximum fluorescence, carotenoid and the percentage of protein (online Supplementary Table S8). The first canonical variate of molecular markers (U1) had high-positive correlations with loci m3l7, m5l15, m5l19, m6l23, m8l31, m11l42, m17l65, m17l66, m17l67, m17l69, m17l72, m18l76, m18l78, m19l87, m20l91, m21l99, m23l104 and m23l106. High-negative correlations were obtained between that of molecular markers (U1) and loci m9l38, m11l43, m13l49, m13l50, m13l51 and m20l94. The degree to which the canonical variates of physiological traits can justify the variation in their primary variables is equal to sum of the squared powers of the canonical structures divided by the number of variables within that group (online Supplementary Table S8). However, the redundancy index is defined as a percentage of variance captured by canonical variates of the opposite group (online Supplementary Table S8). Each value presented in online Supplementary Table S9 represents the variability of each variable in one group (the variable in physiological traits) which is explained by the first canonical variate of another group (by the first canonical variate of molecular traits). All data points representing relevant variables on the X and Y axes and lying within a circle (the blue circle) with a radius of 0.3 were ignored (online Supplementary Fig. S5–S7). It means that correlations between the original variables and their canonical variates are less than 0.30. At the first stress level (60% depletion of available soil moisture), the results indicated that the physiological traits including chlorophyll content (SPAD), chlorophyll a, chlorophyll b, total chlorophyll, proline and carotenoid had high-positive correlations with their first canonical variate (V1), whereas negative correlations were observed between quantum yield potential, initial fluorescence, maximum fluorescence, total carbohydrates, the percentage of protein and their first canonical variate (V1). The first canonical variate of molecular markers (U1) presented high-positive correlations with loci m4l10, m5l15, m8l31, m9l39, m11l40, m11l41, m11l45, m17l65, m17l66, m17l69, m17l72, m18l76, m18l78, m23l104 and m23l106 (online Supplementary Table S8). At the second stress level (85% depletion of available soil moisture), it was observed that the first canonical variate of molecular markers (U1) had high-positive correlations with loci m4l10, m5l15, m5l17, m8l31, m9l35, m11l40, m11l41, m17l67, m18l76 and m18l78. On the other hand, there were significant negative correlations between loci m7l27, m9l34, m9l38, m19l84, m19l85, m19l86, m19l87, m19l89, m20l94, m20l96, m20l97 and the first canonical variate of molecular markers (U1). Also, high correlations were observed between the first canonical variate of physiological traits (V1) and chlorophyll content (SPAD), initial fluorescence (F 0), maximum fluorescence (F m), RWC, total carbohydrates and the percentage of protein. However, RWC and total carbohydrate traits had negative correlations with the first function of physiological traits (V1). The results demonstrate that the percentage of protein has significantly increased at the second stress level compared to the other treatment levels.
Discussion
In the present study, three measured morphological traits were reduced under stress conditions. Decreased plant height and grain yield under stress conditions indicate photosynthetic dysfunction due to dehydration, reduced production and distribution of photosynthetic materials. These results are consistent with reports by other researchers (Sinaki et al., Reference Sinaki, Majidi Heravan, Shirani, Noormohamadi and Zarei2007; Nasri et al., Reference Nasri, Khalatbari, Zahedi, Paknejad and Tohidi Moghadam2008; Faraji et al., Reference Faraji, Latifi, Soltani and Shirani Rad2009).
In comparison to the control, flowering time in Tassillo, Likord and Talaye genotypes was hindered by drought stress levels. The flowering time of rapeseed is influenced by a number of genetic factors, including vernalization (Shah et al., Reference Shah, Weinholdt, Jedrusik, Molina, Zou, Große, Schiessl, Jung and Emrani2018) and photoperiod genes (Raman et al., Reference Raman, Raman, Qiu, Yadav, Sureshkumar, Borg, Rohan, Wheeler, Owen, Menz and Balasubramanian2019). Studies have also shown that drought stress can alter the expression level of miRNAs like miR156s, which regulate the expression of flowering time genes in rapeseed. It was found that miR156 genes were differentially expressed under drought stress, possibly in response to altered sugar levels under photosynthetic limitations (Schiessl et al., Reference Schiessl, Quezada-Martinez, Orantes-Bonilla and Snowdon2020).
A significant increase of total carbohydrate content was also observed for all genotypes under drought stress that is consistent with findings reported by Schiessl et al. (Reference Schiessl, Quezada-Martinez, Orantes-Bonilla and Snowdon2020). Karaj 1, Karaj 2, Zarfam, Adriana and Karun had early flowering time phenotypes in response to drought stress, which is regarded as a drought escape strategy to alleviate adverse effects of drought stress on crop productivity (Song et al., Reference Song, Ito and Imaizumi2013; Khanna-Chopra and Singh, Reference Khanna-Chopra, Singh, Tripathi and Müller2015). Therefore, these genotypes can be suitable for areas that experience late season drought (Song et al., Reference Song, Ito and Imaizumi2013; Khanna-Chopra and Singh, Reference Khanna-Chopra, Singh, Tripathi and Müller2015). Several factors can influence the early flowering time in rapeseed during drought stress including genes such as FLC (Cockram et al., Reference Cockram, Jones, Leigh, O'Sullivan, Powell, Laurie and Greenland2007) and VRN-1 (Diallo et al., Reference Diallo, Ali-Benali, Badawi, Houde and Sarhan2012), plant hormones like salicylic acid, brassinosteroids, indoleacetic acid and cytokinin (Diezel et al., Reference Diezel, Allmann and Baldwin2011; Wasternack et al., Reference Wasternack, Forner, Strnad and Hause2013) and epigenetic factors (Zhang et al., Reference Zhang, Zhang and Zhang2011; Pu et al., Reference Pu, Liu, Kim, Chen, Fletcher and Sung2013). No significant difference in days to flowering was observed in the Hyola 401, Sarigol 32 and Cooper suggesting that the flowering time was not influenced by drought stress.
Among the measured physiological traits, the highest RWC was obtained in the control and was significantly higher from the stress levels. It is likely that abscisic acid is involved in signalling from the root under drought stress conditions and causes the pores to close and results in a decrease in photosynthesis (Ritchie et al., Reference Ritchie, Nguyen and Holaday1990). The amount of chlorophyll a and total chlorophyll increased with stress. The application of stress was associated with a decrease in the initial fluorescence and maximum fluorescence, which indicates the decay of the reaction centres of the photosystem ІІ under drought stress conditions.
Carotenoid increased with stress so that the highest amount was observed at the second level of stress. Carotenoids can protect the light-harnessing system of the photosynthetic apparatus from the radical oxygen molecules and indirectly reduce the production of oxygen species. Carotenoids also consume nicotinamide adenine dinucleotide phosphate hydrogen and protect chlorophyll against photo-oxidation through a mechanism called the xanthophyll cycle (Koyro, Reference Koyro2006). Total carbohydrates, anthocyanins, proline and protein levels increased under drought stress conditions, which are consistent with previous studies (Khan et al., Reference Khan, Siddiqui, Mohammad, Khan and Naeem2007; Ebrahimi et al., Reference Ebrahimi, Nikkhah and Sadeghi2010; Nasibi et al., Reference Nasibi, Manuchehri Kalantari and Yaghoobi2011; Karimi and Vafaeezadeh, Reference Karimi and Vafaeezadeh2012; Schiessl et al., Reference Schiessl, Quezada-Martinez, Orantes-Bonilla and Snowdon2020).
All the traits except for anthocyanin, F 0, F m, F v/F m had high heritability. For this reason, the response to selection using marker-assisted selection (MAS) for these traits could be highly effective, as a higher heritability suggests that the traits are more likely to be passed on to the next generation. MAS has several advantages over conventional phenotypic selection, including the ability to select plants based on their genotype which can considerably shorten the time for new crop varieties to be brought to the market (Collard and Mackill, Reference Collard and Mackill2008; Hasan et al., Reference Hasan, Choudhary, Naaz, Sharma and Laskar2021). In the context of stress conditions, such as drought, MAS has been used to identify and validate quantitative trait loci (QTLs) associated with yield traits (Hashem et al., Reference Hashem, Sandhu, Ismail, Börner and Sallam2023).
Techniques to identify the level of genetic diversity in rapeseed are very important (Havlickova et al., Reference Havlickova, Jozova, Rychla, Klima, Kucera and Curn2014) and ISSR markers are one of the most widely used techniques for this purpose. ISSR primers studied in the investigation were mostly dinucleotide repeats with either one or two nucleotide residues anchored at the 3′ terminus. Primer no. 17 with repeats (AC)8 amplified the most frequent number of bands, whereas the second most frequent one belonged to primer nos. 11, 19 and 20 with repeats (TG)8, (AG)8 and (GA)8, respectively. These results are consistent with those previously reported in the literature (Shi et al., Reference Shi, Huang, Zhan, Yu, Wang, Hua, Liu, Liu and Wang2013), where dinucleotides with repeats AT, AG and AC accounted for 23.5% of repeat sequences founded in B. napus genome. According to online Supplementary Table S9 and Table 3, primer nos. 5, 9, 17, 18 and 19 were determined to be informative, as the first canonical variate of physiological traits (V1) explained the majority of the variation in banding pattern amplified by the primers. Numerous studies have indicated that microsatellites are commonly found in genic regions, including cDNA clones (Piquemal et al., Reference Piquemal, Cinquin and Couton2005), expressed sequence tags (Batley et al., Reference Batley, Hopkins and Cogan2007), unique transcript sequences (Wang et al., Reference Wang, Wang, Chen, Xiao, Li, Zhang, Xu, Fu, Huang, Liu, Wu and Liu2012), BAC-end sequences (Ling et al., Reference Ling, Kaur and Burgess2007) and genome survey sequences (Cheng et al., Reference Cheng, Xu and Xia2009). Given that ISSR markers consist of microsatellite core sequences with a few selective nucleotides serving as anchors in the adjacent regions (Amiteye, Reference Amiteye2021), these markers have the capability to amplify partial sequences of microsatellites found in coding or untranslated regions and potentially have associations with specific traits (Parida et al., Reference Parida, Pandit, Gaikwad, Sharma, Srivastava, Singh and Mohapatra2010).
Overall, the results from this study identified rapeseed genotypes suitable for cultivation in northern Iran and provided new insight into the heritability of traits.
Conclusion
The present study showed that Likord, Sarigol 32 and Hayola 401 provide better performance stability under drought stress conditions and would be suitable for incorporating into breeding programmes. The utility of ISSR–PCR marker primer nos. 5, 9, 17, 18 and 19 for discriminating genotypes was demonstrated. The markers identified in this study could be useful for QTL mapping to identify the chromosomal regions for drought tolerance to breed rapeseed genotypes suitable for the dry and mountainous regions in northern Iran.
Supplementary material
The supplementary material for this article can be found at https://doi.org/10.1017/S1479262124000145.