


Diet-related diseases such as CHD, stroke, type 2 diabetes mellitus and some cancers are the leading causes of morbidity and mortality worldwide. The role of diet in disease is probably to work through a number of different mechanisms, and the relative importance of specific foods and pathways is therefore difficult to estimate( Reference Mozaffarian 1 ). Dietary pattern analysis in observational studies on disease outcomes is, to this end, increasingly used( Reference Wirfalt, Drake and Wallstrom 2 ). A single nutrient or food approach is hampered by the fact that we eat combinations of foods, and that the context in which nutrients are consumed – the ‘food matrix’ – may affect their physiological effect( Reference Jacobs and Tapsell 3 , Reference Jacobs and Steffen 4 ). Further, in order to isolate the effect of a single nutrient or food on disease risk, appropriate statistical analysis often requires a long list of other nutrients or foods that may confound the observed association. Statistical modelling in such settings may result in biased or attenuated estimates owing to multicollinearity and inclusion of several covariates with notable measurement errors( Reference Elmstahl and Gullberg 5 ). Reduced rank regression (RRR) has been suggested as an advantageous method for extracting dietary patterns( Reference Hoffmann, Boeing and Boffetta 6 ). RRR combines the exploratory aspect of the commonly used principal component analysis with a priori knowledge of specific biological pathways involved in disease aetiology( Reference Schulze and Hoffmann 7 , Reference Michels and Schulze 8 ). Including information on proposed mediating pathways/risk factors in the derivation of dietary patterns may therefore provide valuable insight into the role of diet in the development of disease. Cardio-metabolic traits, including the components of the metabolic syndrome (MetS), are typically important predictors for CHD and type 2 diabetes, but have also been implicated in carcinogenesis( Reference Alberti, Eckel and Grundy 9 , Reference Stocks, Bjorge and Ulmer 10 ). RRR has previously been applied to identify dietary patterns associated with various components of the MetS( Reference Hoffmann, Zyriax and Boeing 11 – Reference Heidemann, Hoffmann and Spranger 17 ). These studies have in general identified similar patterns or food groups of importance for investigated outcomes. Both RRR-identified dietary patterns and other data-driven approaches (such as principal components analysis) indicate that overall unhealthy dietary patterns (often denoted ‘Western’) are associated with worse cardio-metabolic health( Reference Wirfalt, Drake and Wallstrom 2 , Reference Biesbroek, van der and Brosens 12 , Reference Fung, Rimm and Spiegelman 18 ). However, derivation of dietary patterns using RRR is usually based on cross-sectional data (i.e. with predictors and responses measured at one point in time) without validation of whether the derived patterns are associated with prospective measurements of the response variables. The cross-sectional nature of previous applications of RRR to derive dietary patterns may result in reverse causation in that response variables might have affected reported food habits. The aim of this study was therefore to derive dietary patterns associated with cardio-metabolic traits at baseline, and to further examine whether these dietary patterns may predict prospective changes in cardio-metabolic traits and the risk of developing the MetS.
Methods
Study population
The Malmö Diet and Cancer Study (MDCS) is a population-based prospective cohort study in the South of Sweden, with baseline examinations carried out between 1991 and 1996. The cohort design and representability has been described in detail previously( Reference Berglund, Elmstahl and Janzon 19 , Reference Manjer, Carlsson and Elmstahl 20 ). With a participation rate of approximately 40 %, the MDCS cohort consists of 28 098 men and women with complete data collection, including dietary assessment. Between October 1991 and February 1994 of the baseline examinations, every other participant was invited to join a sub-study on CVD risk (MDC-cardiovascular arm (CVA); n 6103)( Reference Hedblad, Nilsson and Janzon 21 ). All participants in the MDC-CVA donated fasting blood samples. For the current study, we examined only participants of the MDC-CVA with complete information on cardio-metabolic traits and with exclusion of all subjects with a history of CVD (confirmed by local and national registries) and/or diabetes mellitus (based on self-reported diabetes mellitus at baseline and/or use of anti-diabetic drugs). Further, individuals reporting the use of lipid-lowering drugs and/or anti-hypertensive treatment at baseline were excluded. The final study population thus included 4071 subjects (1619 men and 2452 women) with complete data on diet and cardio-metabolic risk factors. In May 2007 to January 2012, all participants of the MDC-CVA who were alive and still living in Sweden (n 4924) were invited to attend a re-examination. Of the final study population, 2704 subjects attended the re-examination (online Supplementary Fig. S1). The average follow-up time was 16·7 years (range 13·3–20·2). In accordance with the Declaration of Helsinki, the MDCS was approved by Ethics Committee at Lund University (LU 51–90), and informed written consent was obtained from all participants.
Dietary assessment
The dietary assessment methodology used in the MDCS was a modified diet history method combining three parts: (1) a 7-d food record of all cooked meals, cold beverages and dietary supplements and drugs; (2) a 168-item quantitative diet history questionnaire covering regularly consumed foods over the past year; and (3) a diet history interview where information from the food record and diet questionnaire was checked for overlap( Reference Wirfalt, Mattisson and Johansson 22 ). The validity and reproducibility of the method has been published previously( Reference Elmstahl, Riboli and Lindgarde 23 – Reference Elmstahl, Gullberg and Riboli 25 ). The average energy-adjusted Pearson’s correlation coefficients when using the same method 1 year apart were 0·70 for men and 0·56 for women( Reference Elmstahl, Gullberg and Riboli 25 ). The energy-adjusted Pearson’s correlation coefficients for estimated mean daily intake of food groups by the MDCS method compared with an 18-d weighed food records were on average 0·59 (range 0·35–0·92) among men and 0·64 (range 0·24–0·92) among women( Reference Elmstahl, Riboli and Lindgarde 23 ). A total of thirty-eight foods or food groups were included in analyses (see online Supplementary Table S1 for the full list of foods). Food grouping was based primarily on origin/type, nutrient profiles and consumption reported within the cohort (i.e. food items with a high number of zero consumers were collapsed with similar food items).
Cardio-metabolic traits: baseline and follow-up measurements
The following cardio-metabolic traits were examined in this study: waist circumference (WC; cm), serum TAG (mmol/l), HDL-cholesterol (mmol/l), LDL-cholesterol (mmol/l), systolic (SBP) and diastolic (DBP) blood pressure (mmHg), fasting glucose (FG; mmol/l) and fasting insulin (FI; mIU/l). At both baseline and follow-up, trained nurses measured WC (midway between the lowest rib margin and iliac crest), and blood pressure was measured using a mercury-column sphygmomanometer after 10 min of supine rest. All blood samples were donated at baseline after an overnight fast (approximately 6 months after diet history assessment) and stored at −80°C. FG, FI, HDL and TAG were measured at the Department of Clinical Chemistry, Skåne University Hospital in Malmö, which is attached to a national standardisation system. LDL was estimated using Friedewald’s formula. FG at baseline was measured in whole blood by a hexokinase-glucose-6-phosphate dehydrogenase method( Reference Hedblad, Nilsson and Janzon 21 ). At follow-up, fasting plasma glucose was measured using Hemocue (HemoCue)( Reference Rosvall, Persson and Ostling 26 ). For comparison of FG between baseline and follow-up, a constant factor of 1·11 was used to convert concentration in whole blood to the equivalent concentration in plasma( Reference D’Orazio, Burnett and Fogh-Andersen 27 ). At the re-examination, 26 and 37 % of the study population reported the use of lipid-lowering drugs and anti-hypertensive treatment, respectively. Cardio-metabolic traits were therefore adjusted to account for the effect of these drugs. Blood pressure was adjusted by adding a correction constant to the blood pressure of those reporting any blood-pressure-lowering medication (SBP +15 mmHg; DBP +10 mmHg)( Reference Tobin, Sheehan and Scurrah 28 ). Correction constants proposed by Wu et al. ( Reference Wu, Province and Coon 29 ) were used to correct TG, HDL and LDL according to the use of different types of lipid-lowering medications. For HMG-CoA reductase inhibitors (statins), the most commonly used drug in this population, correction constants were +0·208 for TAG, −0·060 for HDL and +1·290 for LDL.
Ascertainment of the metabolic syndrome
The MetS was defined according to the National Cholesterol Education Program – Adult Treatment Panel III definition as the presence of at least three out of the five following criteria: (1) central obesity (WC>88 cm for women and >102 for men); (2) elevated TAG concentration (≥1·7 mmol/l) and/or treatment; (Reference Jacobs and Tapsell3) reduced HDL-cholesterol (<1·30 mmol/l in men, and <1·29 mmol/l in women); (Reference Jacobs and Steffen4) high blood pressure (≥130/85 mmHg) and/or anti-hypertensive treatment; and (Reference Elmstahl and Gullberg5) raised FG (≥5·6 mmol/l) and/or physician-diagnosed diabetes mellitus( 30 ). At baseline, 683 individuals (370 of whom participated in the re-examination) were categorised as having the MetS. After exclusion of prevalent cases, there were 1131 cases of incident MetS (iMetS) among 2368 subjects who participated in the re-examination.
Lifestyle and other variables
Age and sex were determined based on the subjects’ individual Swedish personal identification number. Standing height and weight were measured in light indoor clothing and without shoes. Information on lifestyle, socio-economic factors and disease history was retrieved from the extensive baseline questionnaire( Reference Manjer, Elmstahl and Janzon 31 ). Total physical activity level was estimated based on subjects’ reported leisure-time, domestic and work physical activity( Reference Drake, Sonestedt and Gullberg 32 ), and ranked into sex-specific tertiles. Smoking status was classified as current (including irregular smoking), former and never smoking. Educational level was categorised on the basis of the level of attained education including elementary, junior high school, high school, continued education or university/college degree. Past food habit change was classified as yes/no based on the questionnaire item ‘Have you substantially changed your food habits in the past due to illness or other reason?’( Reference Sonestedt, Gullberg and Wirfalt 33 ). Subjects were classified as energy misreporters if they had a ratio of energy intake to BMR outside the 95 % CI limits of the calculated physical activity level( Reference Mattisson, Wirfalt and Aronsson 34 ).
Statistical analysis
RRR for deriving dietary patterns has been described in detail previously( Reference Hoffmann, Zyriax and Boeing 11 , Reference Hoffmann, Schulze and Schienkiewitz 35 ). RRR was implemented using the PLS procedure in SAS version 9.1 for Windows (SAS Institute). All predictor variables (foods or food groups) were ln-transformed and adjusted for total energy intake (ln-transformed), age and sex in a linear regression model. All response variables (cardio-metabolic traits) were ln-transformed and adjusted for age and sex. To identify the optimal number of factors to retain for further analysis, random sample cross-validation and van der Voet’s test were applied( Reference van der Voet 36 ). Pearson’s correlation coefficients between the dietary pattern scores and the predictor and response variables were computed. Further, the correlation coefficients between the individual predictor variables with highest absolute factor loadings (top twelve food items) and the response variables were computed. Differences in baseline characteristics by quartiles of the dietary patterns were examined using ANOVA (continuous variables) and chi-square tests (categorical variables). The age- and sex-adjusted mean values of the response variables at baseline and at follow-up were computed by quartiles of dietary patterns, and the associations between dietary patterns and response variables were examined using a linear regression model adjusting for age and sex. Among subjects with both baseline and follow-up data (n 2704), we calculated the % change (Δ) in cardio-metabolic traits ((corrected follow-up value−baseline value)/baseline value× 100) and examined the differences across quartiles of dietary patterns with adjustment for age, sex and baseline cardio-metabolic traits (ln-transformed). Among individuals without the MetS at baseline, we estimated hazard ratios (HR) and 95 % CI for iMetS using Cox proportional hazards regression with adjustment for putative confounders identified from the literature. The Schoenfeld residuals were used to test for deviations from the proportional hazards assumption (none noted). The multivariable model included adjustment for age, sex, total energy intake, height, smoking status, educational level, total physical activity level and co-habiting status. Effect modification by the included variables was tested by including the cross-products in the model one by one. No effect modification was detected (all P>0·10). Non-linear associations were assessed by fitting restricted cubic splines and tested using the likelihood ratio test. To further examine the robustness of the dietary patterns, we carried out several sensitivity analyses. We stratified the derivation of dietary patterns by sex owing to differences in relative validity of food intakes between men and women and because food habits are known to differ between the sexes. To investigate the effect of energy misreporting and unstable food habits, we also derived dietary patterns after excluding subjects classified as under-reporters or over-reporters of energy intake and those reporting substantial food habit changes in the past. These analyses did not materially alter the results (data not shown), and therefore the presented results are for men and women combined and without the earlier-mentioned exclusions. Extraction of dietary patterns using unadjusted predictor and response variables was carried out in order to compare the explained variation in the main analysis with that of the unadjusted analysis. As alcohol may have distinct effects on disease risk, we carried out a post hoc analysis excluding alcohol (beer, wine, spirits) in the RRR procedure. Not all subjects participated in the re-examination, which may result in selection bias. We therefore also extracted dietary patterns using only subjects with complete follow-up (n 2704). Finally, we examined the use of RRR in deriving dietary patterns explaining variation in response variables measured at the re-examination and compared them with those derived using response variables measured at baseline.
Stata/SE version 14.2 for Mac (StataCorp) was used for all analyses apart from the RRR procedure in SAS. All tests were two-sided, and P values <0·05 were considered statistically significant. The original MDCS power calculation for examining dietary hypotheses in relation to disease outcomes reported that sufficient statistical power (i.e. 80 % and α=0·05) to observe a risk gradient of 1·00–1·79 over quintiles of nutrient intake (given a relative validity coefficient of the dietary variable of 0·6 and a true risk gradient of 1·00–3·00) was achieved with 283 cases (assuming three controls per case).
Results
Two derived dietary patterns were retained, and these explained 3·2 % of the variation in responses and 7·9 % of the variation in predictors (Table 1). Notably, the extracted dietary patterns explained little variation in SBP, DBP and LDL-cholesterol. Additional factors were not examined further as they did not significantly add to explaining the variation in the specified response variables.
Table 1 Explained variation in response variables using reduced rank regression to extract dietary patterns in the Malmö Diet and Cancer Study (n 4071)Footnote *
* All eight factors explained 4·0 % of variation in response variables; that is the disregarded six factors explained an additional 0·8 % of variation in response variables. The two first factors explained 7·9 % of variation in predictor variables (26·4 % explained by all eight factors).
† Variation explained in addition to factor 1.
‡ Total variation of each respective response variable explained by the first two factors jointly.
§ Total variation explained in all response variables considered simultaneously by the first two factors, separately and jointly.
Description of the derived dietary patterns and associated characteristics
Food item factor loadings for the derived dietary patterns are shown in Fig. 1 and 2, respectively. On the basis of factor loadings, the dietary patterns were labelled as ‘Western’ and ‘Drinker’ dietary patterns. Pearson’s correlation coefficients between the dietary patterns, food items with highest absolute factor loadings and response variables are shown in the online Supplementary Tables S2 and S3. The ‘Western’ dietary pattern was positively correlated with intakes of sugar-sweetened beverages, milk (reduced fat), artificially sweetened beverages, red and processed meat and sweets. This pattern was negatively correlated with intakes of wine, beer, cream, cheese, tea and vegetables (online Supplementary Table S2). Further, this pattern was negatively correlated with HDL but positively with all other response variables. The ‘Drinker’ dietary pattern explained much less of the variation in response variables, except for HDL-cholesterol (Table 1). This pattern loaded strongly on all types of alcoholic beverages. It was also positively correlated with red and processed meat, fish and shellfish and eggs, and negatively correlated with sugar, cakes and biscuits and marmalade. The ‘Drinker’ dietary pattern was positively correlated with WC, HDL, SBP, DBP and FG (online Supplementary Table S3).
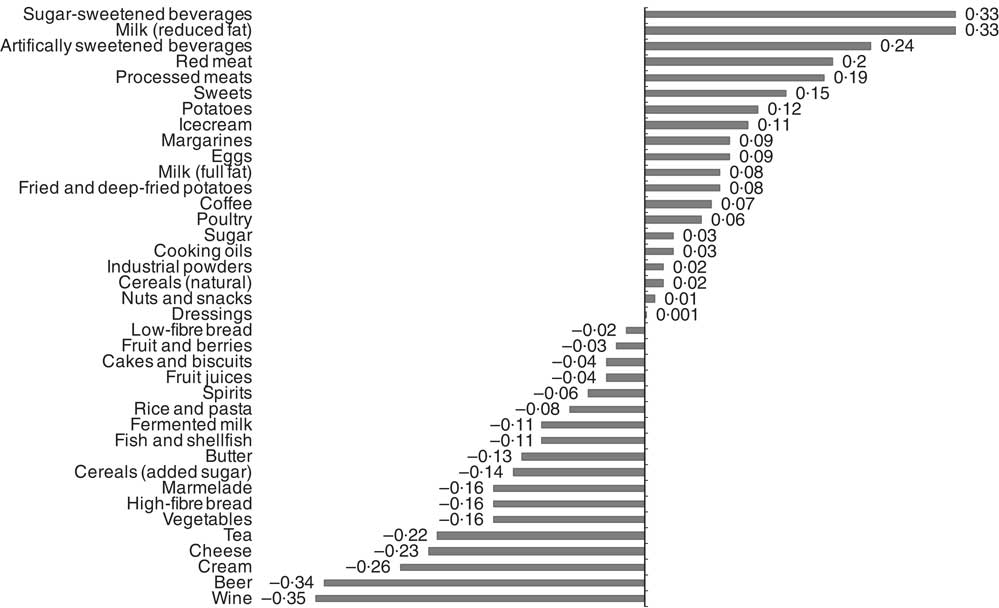
Fig. 1 Food item factor loadings for the ‘Western’ dietary pattern (factor 1) derived using reduced rank regression in the Malmö Diet and Cancer Study (n 4071). ![]() , Factor loadings.
, Factor loadings.
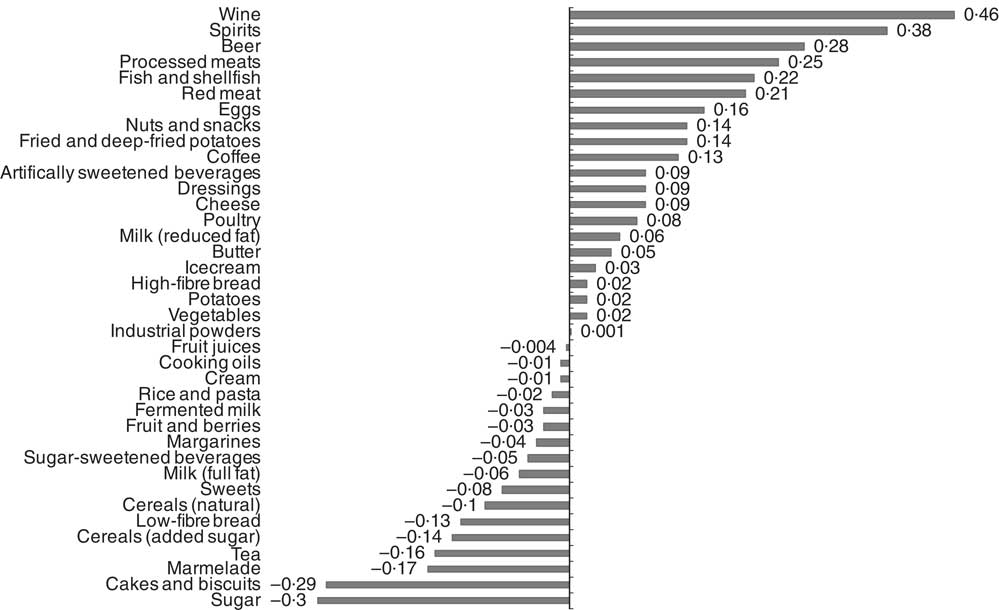
Fig. 2 Food item factor loadings for the ‘Drinker’ dietary pattern (factor 2) derived using reduced rank regression in the Malmö Diet and Cancer Study (n 4071). ![]() , Factor loadings.
, Factor loadings.
Table 2 shows the baseline characteristics of the study population by quartiles of the two dietary patterns. Subjects in the highest quartile of the ‘Western’ dietary pattern were more likely to be current smokers, have higher total physical activity and lower educational level. The ‘Drinker’ dietary pattern was associated with current smoking, lower physical activity level and higher educational level (Table 2).
Table 2 Baseline characteristics of men and women in the Malmö Diet and Cancer Study 1991–1996 (n 4017) by quartiles of dietary pattern scores (Mean values and standard deviations; percentages)
MetS, metabolic syndrome.
* P for linear trend across quartiles of scores (age) and Pearson’s χ 2 test for categorical variables.
Dietary patterns, change in cardio-metabolic traits and incidence of the metabolic syndrome
The age- and sex-adjusted means of cardio-metabolic traits at baseline and after 16 years of follow-up, as well as the %Δ (for subjects with both baseline and follow-up measurements) by quartiles of the dietary patterns, are shown in the online Supplementary Tables S4 and S5. The ‘Western’ dietary pattern was significantly associated with all cardio-metabolic traits at baseline (inverse association with HDL-cholesterol) and, with the exception of LDL, all associations remained for traits measured after 16·7 years of follow-up (all P<0·0001). Notably, this pattern associated significantly with change over time for all the cardio-metabolic traits, except for LDL and SBP (online Supplementary Table S4). The ‘Drinker’ dietary pattern showed consistent associations with baseline and follow-up measurements of WC, HDL, SBP, DSP and FG (online Supplementary Table S5). This pattern was not associated with LDL-cholesterol or FI, neither at baseline nor at follow-up. After adjustment for confounders, the HR for iMetS among subjects in the highest quartile of the ‘Western’ dietary pattern compared with the lowest quartile was 1·47 (95 % CI 1·23, 1·77; P trend=1·5×10−5). The ‘Drinker’ dietary pattern was not associated with iMetS (Table 3).
Table 3 Incident metabolic syndrome (iMetS) among men and women without the metabolic syndrome at baseline (1991–1994) by quartiles of two dietary patterns obtained by reduced rank regression in the Malmö Diet and Cancer Study (n 2368)Footnote * (Hazard ratios (HR) and 95 % confidence intervals)
Ref., referent values.
* HR and 95 % CI estimated using a Cox proportional hazards model with follow-up time (years) as the time scale. Model 1 adjusted for age, sex and total energy intake. Model 2 adjusted for age, sex, total energy intake, height, smoking status, educational level, total physical activity level and co-habiting status.
† Linear trend across quartiles of pattern scores.
‡ P non-linearity tested using the likelihood ratio test comparing models with and without a fitted restricted cubic spline for the association between pattern scores and iMetS.
Sensitivity analyses
Using unadjusted predictor and response variables, fairly similar dietary patterns were derived (data not shown); however, the explained variation in response variables was substantially higher (i.e. 5·2 % explained by the first two factors). When alcoholic beverages were excluded from the analysis, only one factor contributed significantly to explaining variation in responses and was retained for further analysis (online Supplementary Fig. S2). Food items had similar factor loadings compared with the ‘Western’ dietary pattern derived in the main analysis. This pattern was also significantly associated with iMetS after adjustment for alcohol consumption and other confounders (Q4 v. Q1: OR=1·45; 95 % CI 1·22, 1·73; P trend= 7·2×10−5; data not tabulated). In subjects attending the re-examination, derived dietary patterns were very similar to those derived in the full study population (data not shown). Using follow-up measurements as response variables, one dietary pattern significantly contributed to explaining variation in cardio-metabolic traits (online Supplementary Fig. S3). This pattern was positively correlated with high intakes of red and processed meats, spirits, sugar-sweetened beverages and fried/deep-fried potatoes, and low intakes of fruit and berries, and fermented milk. Positive associations with WC, TAG, SBP, DBP, FG and FI and an inverse association with HDL were observed, but there was no association with LDL-cholesterol (online Supplementary Table S6).
Discussion
Main findings
In this study, we identified a ‘Western’ dietary pattern characterised by high consumption of sugar-sweetened and artificially sweetened beverages, low-fat milk, red and processed meat and sweets, and lower consumption of beer, wine, cream, cheese, tea and vegetables, which was consistently associated with adverse effects on cardio-metabolic traits at baseline and at follow-up after approximately 16 years. A ‘Drinker’ dietary pattern defined primarily by high intakes of alcoholic beverages and a positive association with HDL-cholesterol was not prospectively associated with the risk of developing the MetS.
Strengths and limitations
The main strengths of this study include the prospective cohort design, the access to high-relative validity dietary data and the direct measurements of response variables using standardised procedures at two time points. Dietary pattern analysis is an attractive and complementary approach in nutritional epidemiology, but several methodological issues remain, including the use of self-reported dietary data measured with error. If there are correlated measurement errors, this may affect the extracted dietary patterns as error correlation may increase the likelihood that food/nutrients are found in the same pattern( Reference Michels and Schulze 8 ). The use of dietary data with high-relative validity in our study, which combined two different parts (i.e. diet history questionnaire and diet record), is likely to reduce the chance that the resulting dietary patterns would be explained by correlated measurement errors. Limitations of this study include potentially poor external validity of the findings, as the results suggesting an association between the ‘Western’ dietary pattern and iMetS are based on subjects who were alive and healthy enough to attend the re-examination after 16 years. However, this selection will probably result in smaller range in dietary exposures and an attenuation of observed associations. During follow-up, a large proportion of participants reported the use of lipid-lowering and anti-hypertensive drugs. Constants were added to account for the effect of these drugs on the respective traits. Excluding subjects using drugs or including a dummy variable could have introduced additional selection bias, as well as might not have been able to appropriately account for the effects on measured traits( Reference Tobin, Sheehan and Scurrah 28 ). It should also be noted that a substantial part of the study population was deceased at the re-examination (approximately 1/6 of the original MDC-CVA), which may have introduced a survivor bias that is likely to attenuate associations seen with cardio-metabolic traits at follow-up( Reference Rosvall, Persson and Ostling 26 ). Although the extracted patterns were still significantly associated with %Δ in most traits, these associations were in general not as strong as those for the patterns in relation to baseline values.
As diet is so strongly related to a wide range of lifestyle-related factors, we further cannot exclude residual confounding as a potential explanation for the observed associations. In addition, using food groups typically entails subjective grouping of foods that may affect the extracted dietary patterns( Reference McCann, Marshall and Brasure 37 , Reference Ocke 38 ). Although we aimed to retain as much information as possible and limit food grouping, there is a possibility that some food groups load high or low on extracted dietary patterns owing to only some of the included foods of a specific group.
Comparison with previous studies and interpretation of findings
The identified ‘Western’ dietary pattern is similar to previously identified ‘Western’ dietary patterns derived using different data-driven methods( Reference Wirfalt, Drake and Wallstrom 2 , Reference Biesbroek, van der and Brosens 12 , Reference Fung, Rimm and Spiegelman 18 ). This type of dietary pattern has been linked to increased risk of cardio-metabolic diseases, and to colon cancer( Reference Wirfalt, Drake and Wallstrom 2 ). Although definitions vary, such patterns are often characterised by high consumption of soft drinks, red and processed meat and refined cereals, with concurrently low intakes of fish and shellfish, fruit and vegetables and whole grain ( Reference Wirfalt, Drake and Wallstrom 2 ). The amount of explained variation in cardio-metabolic traits by the extracted patterns in our study was modest (i.e. 3·2 % by the two main factors). However, the true variation explained may be attenuated by dietary measurement errors. In previous studies using similar response variables (i.e. including at least one of the studied cardio-metabolic traits), the explained variation by the first extracted factor ranged between 2·8 and 7·8 %( Reference Hoffmann, Zyriax and Boeing 11 – Reference Heidemann, Hoffmann and Spranger 17 ). The between-study differences may be attributed to the selection of both predictors and responses. Another plausible explanation is that we opted to adjust both predictor and response variables for age and sex in order to avoid derivation of patterns that are reflected by age- and sex-specific differences in dietary habits. Indeed, without adjustment for these factors, the explained variation by the first two factors was 5·2 %. This suggests that using unadjusted predictor and response variables in RRR may overestimate the variation explained by predictor variables. The ‘Western’ dietary pattern extracted in our study is consistent with previous observations in this cohort linking high intakes of red and processed meats, and high intake of low-fat dairy to increased risk of type 2 diabetes( Reference Ericson, Hellstrand and Brunkwall 39 , Reference Ericson, Sonestedt and Gullberg 40 ). High consumption of cream and cheese has also been linked to a lower risk of type 2 diabetes in this cohort( Reference Ericson, Hellstrand and Brunkwall 39 ). On the basis of our findings, some high-fat dairy products could be part of an overall healthy dietary pattern. However, the use of low-fat milk may be a marker of attempts at weight loss, as suggested by the reduced factor loading for low-fat milk when using predictors measured at follow-up. Sugar-sweetened beverages have consistently been linked to increased risk of cardio-metabolic diseases( Reference Malik and Hu 41 ). Not all studies using data-driven methods to derive dietary patterns have included alcoholic beverages. The main reason is often dependent on the disease outcome; if alcohol is an established risk factor, it is preferably treated as a confounding factor in subsequent analysis. In our study, the second dietary pattern (Drinker) loaded high on alcoholic beverages, but the ‘Western’ dietary pattern was also defined by low consumption of beer and wine. The ‘Drinker’ dietary pattern seemed to add mostly to explaining additional variation in HDL-cholesterol. It is well established that alcohol consumption increases HDL-cholesterol and that moderate consumption associates with lower risk of CVD( Reference Suh, Shaten and Cutler 42 ). However, it is important to note that participants of cohort studies are usually more health conscious and generally do not include the sub-group of the population with heavy alcohol consumption, and thus the ‘Drinker’ dietary pattern, as well as ‘high’ intake of alcohol consumption associated with the ‘Western’ dietary pattern, is likely to reflect only moderate consumption levels. Apart from alcohol, the ‘Drinker’ dietary pattern was defined by low sugar consumption (potentially beneficial) and high meat consumption (potentially detrimental), which might explain the null association with iMetS. Post hoc analyses excluding alcoholic beverages resulted in a dietary pattern similar to the ‘Western’ dietary pattern in relation to food items other than alcoholic beverages and was associated with iMetS after adjustment for potential confounders. Validating the association between RRR-derived dietary patterns with response variables over time may strengthen conclusions regarding the mediating effects of the selected responses on disease outcomes, and exclude reverse causation (i.e. that responses affect predictors) as a driver of the extracted patterns. Our results suggest that dietary patterns derived using predictors and responses measured at baseline also associate with response variables over time. Using cardio-metabolic traits measured at follow-up as response variables also identified a ‘Western’ dietary pattern similar to that derived in the main analysis. This pattern was characterised by high intakes of red and processed meats, spirits, sugar-sweetened beverages and fried and deep-fried potatoes, but low intakes of fruit and berries, and fermented milk. The major difference between this pattern and the ‘Western’ dietary pattern derived in the main analysis was the lower positive factor loadings for artificially sweetened beverages and low-fat milk. This suggest that these food items may not have a strong effect on cardio-metabolic factors but may be reflective of dietary choices aimed at (e.g.) reducing body weight. Applying RRR with prospectively assessed response variables may thus reduce the effect of reverse causation and strengthen the results of dietary pattern studies. The identified ‘Western’ dietary pattern found to associate with an increased risk of iMetS may exert its adverse effects via a number of putative biological pathways. On the basis of the degree of explained variation in the specific response variables, the link between this type of dietary pattern and WC (i.e. increased weight gain and central adiposity) may be the most important pathway whereby the ‘Western’ dietary pattern (defined partly by high consumption of sugar-sweetened beverages) may affect overall cardio-metabolic health.
Conclusions
Comparable dietary patterns associated with cardio-metabolic traits were derived using both a cross-sectional and longitudinal study design. The most consistent finding was an association between a ‘Western’ dietary pattern with adverse effects on cardio-metabolic health. Overall, the explained variation in cardio-metabolic traits by diet was modest, suggesting that other factors may be more important for the prevention of the MetS and related diseases. However, this study does highlight the strength of dietary pattern approaches to examine the association between diet and intermediate markers of disease as dietary patterns can be more easily adopted to food-based dietary guidelines. Results of this study support the current dietary guidelines, suggesting to, for example, limit consumption of sugar-sweetened beverages, red and processed meat and sweets, and increasing the consumption of fruit and vegetables. Findings from this study also suggest that RRR may be more appropriately applied using longitudinally measured response variables in order to limit the possibility of reverse causation.
Acknowledgements
The authors thank all the Malmö Diet and Cancer Study (MDCS) participants. Further, the authors thank the principal investigators of the MDCS re-examination, including Peter Nilsson, Olle Melander and Margaretha Persson.
The MDCS was funded by the Swedish Research Council and the Swedish Heart and Lung Foundation. The MDCS re-examination was funded by (among others) the Swedish Research Council (grant K2011-65×-20752-04-5), the Region Skåne County Council and the Ernhold Lundström Foundation. The current study was funded by the Swedish Research Council, The European Research Council (consolidator grant no. 649021, M. O.-M.), the Swedish Heart and Lung Foundation, the Novo Nordic Foundation, the Swedish Diabetes Foundation, the Dir. Albert Påhlsson Foundation, the Region Skåne, Skåne University Hospital and the Linnéus Foundation for Lund University Diabetes Center. The funding agencies had no role in the design, analysis or interpretation of the data.
I. D. and M. O.-M. designed the research. I. D. performed the statistical analyses, wrote the paper and had primary responsibility for the final content. E. S., U. E., P. W. and M. O.-M. contributed to interpretation of the results and commented on manuscript drafts. All authors approved the final version of the paper.
The authors declare that there are no conflicts of interest.
Supplementary material
For supplementary material/s referred to in this article, please visit https://doi.org/10.1017/S000711451800079X


