


The mammalian circadian clock, a feedback loop of core clock gene expression, precisely controls various physiological processes, including energy metabolism(Reference Jiang and Turek1). The CLOCK/BMAL1 transcriptional complex also binds the functional E-box element of the promoter region of PPAR(Reference Canaple, Rambaud and Dkhissi-Benyahya2). PPARα has been shown to play an important role in controlling the β-oxidation of fatty acids (FA) in peroxisomes and mitochondria(Reference Sonoda, Pei and Evans3). On the other hand, PPARα regulates the transcription of BMAL1 and REV-ERBα via binding to response element for PPAR (PPRE) in their respective promoter regions(Reference Canaple, Rambaud and Dkhissi-Benyahya2,Reference Wang, Yang and Jia4) . Therefore, the circadian clock and energy metabolism, particularly lipid metabolism, are essentially coupled. Experimentally induced circadian misalignment between behavioural cycles (fasting/feeding and the sleep wake cycle) and endogenous circadian rhythms resulted in abnormalities in glucose and lipid metabolism, decreased insulin sensitivity, increased blood pressure and low-grade inflammation(Reference Scheer, Hilton and Mantzoros5–Reference Morris, Purvis and Hu7). Therefore, the synchronisation of biological rhythms and energy metabolism is a fundamental prerequisite for metabolic health.
Epidemiological evidence suggests a relationship between excessive fat intake and the prevalence of obesity and also that the amount of dietary fat is associated with the degree of obesity(Reference Astrup and Sci8). The two most prevalent FA in Western-style diets are palmitic acid (PA; C16:0) and oleic acid (OA; C18:1), with each being present in approximately equal amounts as a percentage of dietary energy(Reference Elmadfa and Kornsteiner9). Diets rich in PA are associated with a higher risk of obesity, type 2 diabetes and CVD than those enriched in OA(Reference Astrup, Dyerberg and Elwood10,Reference Kien11) . Animal studies revealed that a high-fat meal shifts the phase of circadian clock gene expression, and the underlying mechanism for this effect of a high-fat meal on circadian rhythms may be related to the FA composition of the meal, which is often summarised as the palmitic acid to oleic acid ratio (the PA/OA ratio). Other studies revealed that feeding, sleep patterns and clock oscillations in the hypothalamus and peripheral tissues were more strongly affected by meals with a high PA/OA ratio than by those with a low PA/OA ratio(Reference Kohsaka, Laposky and Ramsey12–Reference Ding, Liu and Zhou16). In experiments with human hepatocytes, PA, a SFA, inactivated PPARα (Reference Popeijus, van Otterdijk and van der Krieken17) and disrupted clock gene expression(Reference Gil-Lozano, Wu and Martchenko18), while OA, a MUFA, reduced lipotoxicity caused by SFA(Reference Lago-Sampedro, Ho-Plagaro and Garcia-Serrano19). In a clinical trial, a switch from a high-carbohydrate, low-fat diet to a low-carbohydrate, high-fat isoenergetic diet affected the diurnal oscillations of core clock genes (PER1, PER2, PER3 and Thyrotroph embryonic factor) and inflammatory genes in human leukocytes(Reference Pivovarova, Jürchott and Rudovich20). Clock gene expression and function in the human skeletal muscle were altered by obesity, coincident with changes in plasma FA levels(Reference Laura, Puig, Pillon and Näslund21). PA exposure disrupted clock gene expression in myotubes.
The effects of dietary FA composition on biological rhythms, including the expression of clock genes, have not yet been examined in clinical trials. Therefore, the present study investigated the potential role of the composition of dietary FA in the regulation of biological rhythms, such as the sleep architecture, core body temperature and leukocyte clock gene expression, in subjects fed meals rich in PA or OA. To blind subjects to the dietary FA intervention, muffins made with either palm or rapeseed oil were used as the staple food with different FA compositions as part of the experimental meal.
Materials and methods
Subjects
In our previous study, we recruited ten healthy young males to examine the effects of high-fat meals on energy metabolism(Reference Yajima, Iwayama and Ogata22). By applying the same inclusion and exclusion criteria, eleven healthy young men were newly recruited for the present study. Body composition was measured using the bioimpedance method (BC-118E, TANITA Co.). Exclusion criteria were BMI < 18·5 kg/m2, BMI ≥ 25·0 kg/m2, food allergies, smoking, chronic diseases, the regular use of medications and dietary supplements, shift workers or trans-meridian travel within 1 month and an extreme chronotype (Japanese version of Morningness–Eveningness Questionnaire score < 30 or > 70). The Consolidated Standards of Reporting Trials (CONSORT) flow chart shows the passage of subjects through the different stages of the present trial, including enrolment, allocation to the interventions and analysis (online Supplementary Fig. 1). The present study was conducted according to the guidelines laid out by the Declaration of Helsinki, and all procedures involving human subjects were approved by the Ethics Committee of the University of Tsukuba (approval number 27–71). All subjects provided written informed consent before study commencement and the protocol was registered with Clinical Trials UMIN, ID no.: 00 028 960.
Study protocol
This was a randomised, single-blind, cross-over analysis including 24 h of indirect calorimetry with three meals rich in PA or OA. An outline of the study protocol is shown in Fig. 1. A washout period of 5–10 d was included between trials. Between days 1 and 4 before measurements, subjects were asked to keep regular sleep (23.00)/wake (07.00) and meal schedules (breakfast at 07.00, lunch at 12.30 and dinner at 19.00), which were confirmed by a self-reported diary. On day 5, subjects were asked to abstain from exercise and the consumption of alcohol and caffeine. Subjects entered the metabolic chamber on the day before the 24-h indirect calorimetry session (day 5, 22.00). Once in the metabolic chamber, subjects slept for 8 h, from 23.00 to 07.00. On day 6, three experimental meals (breakfast at 08.00, lunch at 12.30 and dinner at 19.00) were provided. At 21.00, subjects left the metabolic chamber and the electrodes of a polysomnographic recording system were attached. Subjects then re-entered the metabolic chamber and slept for 8 h, from 23.00 to 07.00. Energy metabolism was measured from 07.00 on day 6 until the next morning at 07.00, except for 1 h when subjects exited the metabolic chamber to attach the electrodes of the polysomnographic recording system. Core body temperature and autonomic nervous system activity were measured from 07.00 on day 6 until 07.00 the next morning. Urine was collected in two batches: from 07.00 to 23.00 on day 6 and in the subsequent 8 h until 07.00 on day 7, including the first urine awakening. Nitrogen and acylcarnitines were assessed as 24-h excretion and 6-sulphatoxymelatonin as excretion during sleep. Sleep electroencephalography was performed during sleep (from 23.00 to 07.00) and blood sampling at 8 time points over 24 h (at 07.00, 09.00, 12.00, 15.00, 18.00, 21.00 and 23.00 on day 6 and at 07.00 on day 7) to assess the composition of NEFA, glucose and insulin concentrations in plasma and clock gene expression in leukocytes.
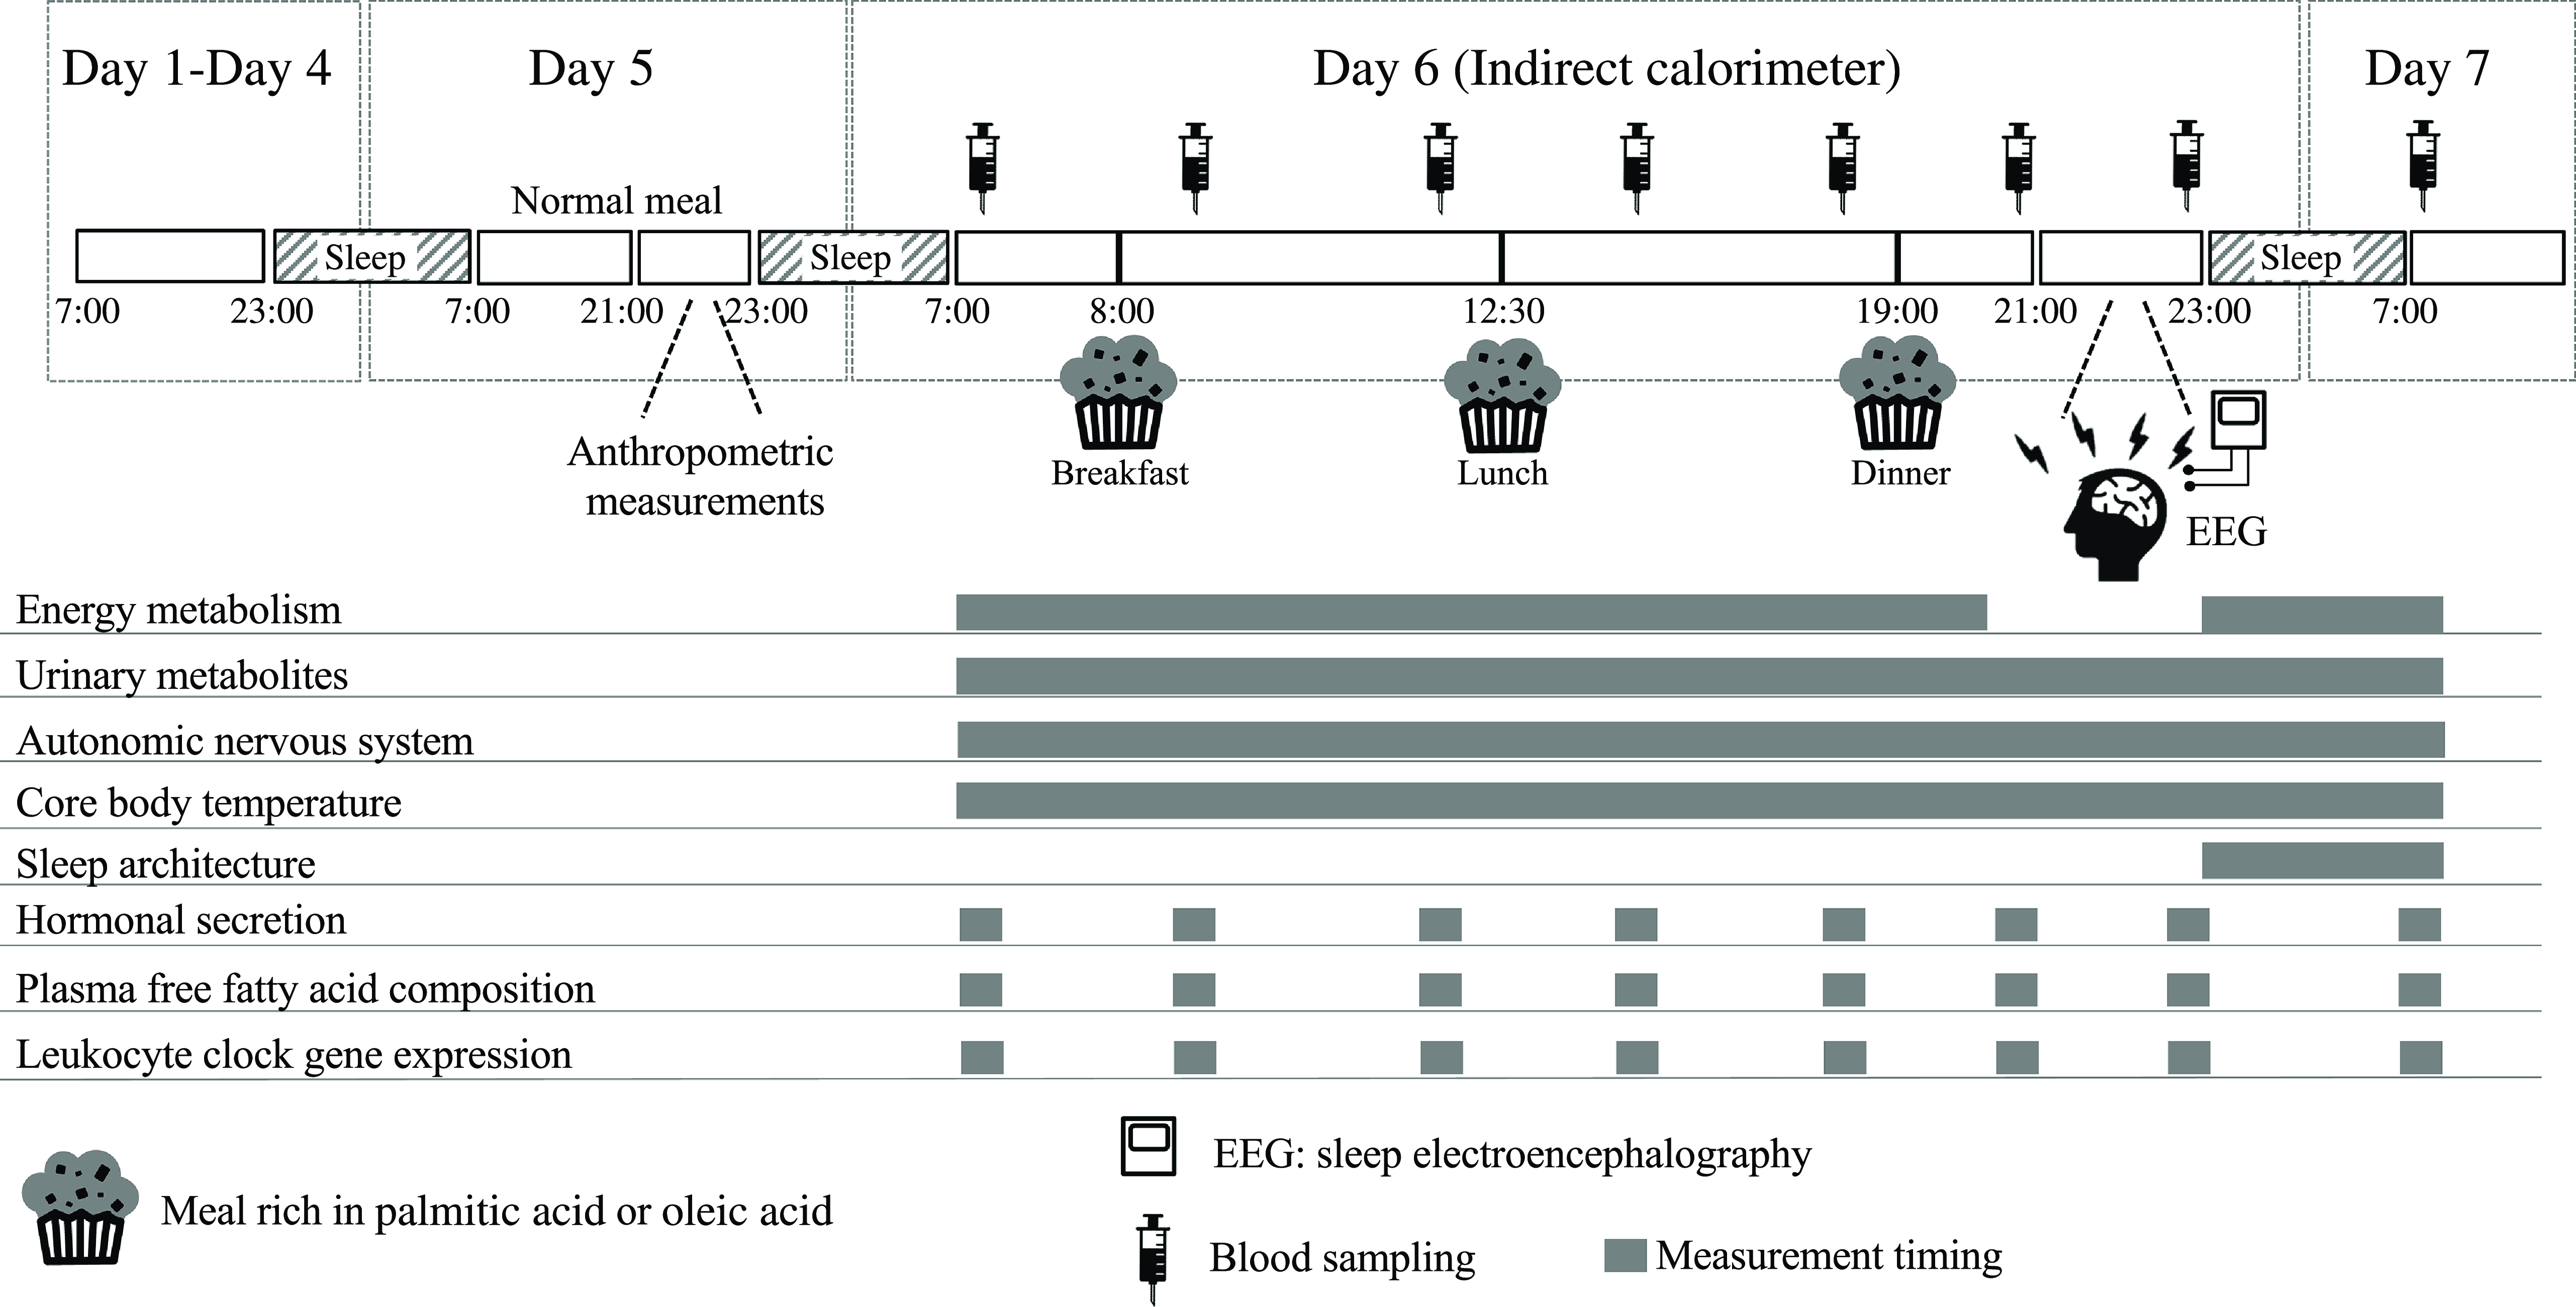
Fig. 1. Schematic overview of the study protocol and time schedule during indirect calorimetry. During each 7-d session, subjects were asked to keep regular sleep (23.00)/wake (07.00) and meal (breakfast at 07.00, lunch at 12.30 and dinner at 19.00) schedules. Physical activity was monitored from days 1 to 7. A washout period of 5–10 d was included between the two trials. One day before indirect calorimetry (day 5 of each session), normal meals were provided for breakfast, lunch and dinner. At 21.00 on day 5 of the session, subjects wore sensors for heart rate, swallowed a core body temperature sensor and then entered the whole-room metabolic chamber, where they slept for 8 h from 23.00 to 07.00. On day 6 of the session, experimental meals were provided as breakfast at 08.00, lunch at 12.30 and dinner at 19.00. Indirect calorimetry was interrupted from 21.00 to 23.00 on day 6 in the session to prepare for polysomnographic measurements. Urine samples were collected over 24 h and blood samples were collected eight times over 24 h (at 07.00, 09.00, 12.00, 15.00, 18.00, 21.00 and 23.00 on day 6 and at 07.00 on day 7). PA trial, the session with meals rich in palmitic acid trial; OA trial, the session with meals rich in oleic acid trial.
Normal and experimental meals
On day 5, normal meals were individually standardised based on the estimated energy requirement for Japanese adults(23), assuming a physical activity factor of 1·75. The staple food of normal meals was rice and the average energy content was 639 (sem 9) kJ/d. Expressed as a percentage of total energy, meals contained 14 % protein, 25 % fat and 61 % carbohydrate.
On day 6, experimental meals were prepared assuming a physical activity factor of 1·3. The staple food of experimental meals was a muffin made with palm oil (a meal rich in PA) or rapeseed oil (a meal rich in OA). Palm or rapeseed oil (8 g) was mixed with wheat flour (20 g), egg (11 g), sugar (3 g) and water (8 g) and baked in an oven at 180°C for 25 min. Subjects were provided with side dishes in addition to muffins as the staple food. Expressed as a percentage of total energy, experimental meals had a macronutrient profile of 11 % protein, 45 % fat and 44 % carbohydrate. The energy content of experimental meals was 495 (sem 13) kJ/d and the FA composition is shown in Table 1.
Table 1. Composition of experimental meals
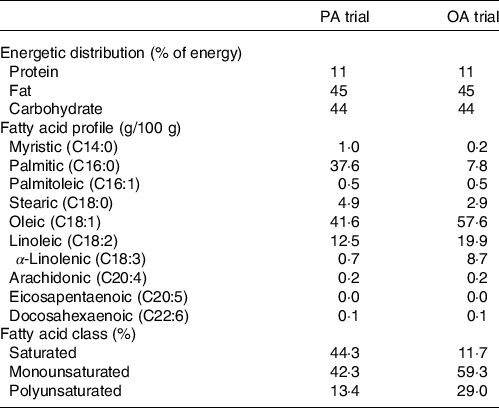
PA trial, the session with meals rich in palmitic acid trial; OA trial, the session with meal rich in oleic acid trial.
Measurements
Indirect calorimetry
Energy metabolism was measured using a whole-room metabolic chamber (Fuji Medical Science). The airtight chamber measured 2·00 × 3·45 × 2·10 m, with an internal volume of 14·49 m3. The temperature and relative humidity of incoming air were controlled at 25·0 (sem 0·5)°C and 55·0 (sem 3·0) %, respectively. The concentrations of oxygen (O2) and carbon dioxide (CO2) in outgoing air were measured using an online process mass spectrometer (VG Prima δB, Thermo Electron). The precision of the mass spectrometer, defined as standard deviations for the continuous measurement of the calibration gas mixture (O2 15 % and CO2 5 %), was 0·0016 and 0·0011 % for O2 and CO2, respectively. O2 consumption (VO2) and CO2 production (VCO2) rates were calculated every minute using an algorithm for an improved transient response(Reference Tokuyama, Ogata and Katayose24). The metabolic chamber was calibrated by the ethanol combustion test and intermittent gas infusion test(Reference Tokuyama, Ogata and Katayose24).
Macronutrient oxidation and energy expenditure were calculated from VO2, VCO2 and urinary nitrogen excretion. The rates of nitrogen excretion (N), an index of protein oxidation, were assumed to be constant during calorimetry. Equations for glucose, fat and protein oxidation rates were as follows:
Glucose oxidation (g/min) = 4·55 VCO2 (l/min) − 3·21 VO2 (L/min) − 2·87 N (g/min)
Fat oxidation (g/min) = 1·67 VO2 (l/min) − 1·67 VCO2 (L/min) − 1·92 N (g/min)
Protein oxidation (g/min) = 6·25 N (g/min)
Once the rates of glucose, fat and protein oxidation were computed, the total rate of energy production was estimated by taking into account the energetic equivalent of the three substrates. Conversion factors for energetic equivalents were 4·10 kcal/g for protein (25·625 kcal/g for urinary N), 3·74 kcal/g for carbohydrate and 9·50 kcal/g for fat(Reference Ferrannini25).
Activity and sleep recording
Physical activity was measured with a uniaxial accelerometer activity monitor (ActiGraph, Ambulatory Monitoring Inc.). All subjects wore the wristwatch accelerometer in the zero-crossing mode(Reference Ancoli-Israel, Cole and Alessi26). The gross motor activity of the accelerometer was estimated at 1-min intervals. Sleep was recorded polysomnographically using PSG-1100 (Nihon Kohden). Electrodes were attached to record electroencephalograms (F3/M2, F4/M1, C3/M2, C4/M1, O1/M2 and O2/M1), electrooculograms and electromyograms. Records were scored every 30 s to stage N1, stage N2, slow wave sleep (SWS) and stage rapid eye movement(Reference Berry, Budhiraja and Gottlieb27). Measurements during sleep onset latency were classified as stage wakefulness.
Core body temperature and autonomic nervous system activity
Core body temperature was continuously recorded using an ingestible core body temperature sensor that wirelessly transmits core body temperature to the recorder (CorTemp, HQ Inc.). The sensor, which was calibrated using hot water before use, is accurate to ± 0·1°C.
R–R intervals of the electrocardiogram were continuously monitored using a telemetric heart rate monitor (LX-3230, Fukuda Denshi Co., Ltd.) and the power spectrum of heart rate variability was estimated using the maximum entropy method. The spectra measured were computed as amplitudes (i.e. areas under the power spectrum) and were presented in milliseconds squared (ms2). Parasympathetic and sympathetic nervous system activities were estimated as high frequency (HF; 0·15–0·40 Hz) and as a power ratio of low frequency (LF; 0·04–0·15 Hz) to HF (LF/HF), respectively(Reference Stein and Kleiger28).
Quantification of clock gene expression
The protocol for assaying clock gene expression was previously described(Reference Ogata, Horie and Kayaba29,Reference Tanaka, Ogata and Kayaba30) . Blood samples (2·5 ml) were taken into PAXgene Blood RNA vacutainer tubes (PreAnalytiX) and stored at −20°C until total RNA extraction. The PAXgene Blood RNA Kit (Qiagen) was used to extract total RNA according to the manufacturer’s protocol. RT (PrimeScript RT reagent Kit, Takara-Bio) and DEPC-Treated Water (Thermo Fisher Scientific) were mixed, and random prime reverse transcription was performed using a Takara PCR Thermal Cycler Dice Gradient (Takara-Bio). Real-time PCR was conducted using a CFX384 Touch Real-Time PCR Detecting System (Bio-Rad), and data were analysed using CFX Manager Software 3.1. Real-time PCR was performed using TaqMan Gene Expression Assays (NR1D1 Assay ID; Hs00253876_m1, CLOCK Assay ID; Hs00231857_m1, PER1 Assay ID; Hs00242988_m1, ARNTL Assay ID; Hs00154147_m1, CRY1 Assay ID; Hs00172734_m1 from Applied Biosystems, Thermo Fisher Scientific). The TATA-box binding protein was used as the endogenous control. Clock gene expression levels were normalised to the expression level of TATA-box binding protein at each time point and evaluated using a calibration curve method.
Plasma NEFA, insulin and glucose
NEFA were separated from plasma total lipids using Waters Sep-Pak Vac RC (500 mg) C18 cartridges. The internal standards 0·005 % BHT/Methanol and tricosanoic acid were added to each plasma sample and stored at –30°C. Samples were heated at 98°C for 1 h after the addition of acetyl chloride. Samples were shaken for 3 min after the sequential addition of 0·5 M sodium hydroxide/10 % sodium chloride and octane. Samples were then centrifuged at 2000 rpm at 20°C for 10 min and the top layer was collected. The protocol for assaying plasma NEFA was previously described(Reference Muramatsu, Akimoto and Hashimoto31). The composition of NEFA in plasma was measured using GC (GC-2014, Shimadzu) equipped with a flame ionisation detector and automatic sampler (AOC-20i, Shimadzu). A gas chromatographic analysis was performed using a capillary column (DB-WAX 30 m × 0·53 mm × I.D 3 μm); the split method was used with a split ratio of 10·0 for sample injection and nitrogen gas was used as the carrier gas. Method validation was performed in terms of inter-assay and intra-assay accuracy and precision, linearity and correlations (online Supplementary Table 1). Column temperature was maintained at an initial temperature of 100°C for 4 min, was increased to 200°C in 15°C steps of 1 min and was maintained for 5 min. Column temperature was then increased to 260 °C in 2·5°C steps of 1 min and maintained for 10 min. The run time per sample was set to 50 min. Plasma insulin (Insulin ELISA, ALPCO) and glucose (LabAssay Glucose Kit, FUJIDILM) concentrations were measured by ELISA.
Urinary metabolites
Urinary samples were stored at –30°C for later analyses. Acylcarnitines were assayed using a liquid chromatograph coupled with a Shimadzu LCMS-8050 tandem mass spectrometer (Shimadzu) equipped with an electrospray ionisation source. The liquid chromatograph system was equipped with a CTO-40C column oven (kept at 40°C, Shimadzu), LC-40D XS pumps (Shimadzu), a SCL-40 system controller (Shimadzu), and InertSustain C18 column (3 µm, 2·1 × 150 mm i.d., GL Sciences). A full validation of the analytical method was conducted according to FDA guidelines on the validation of bioanalytical methods(32). Method validation was performed in terms of inter-assay and intra-assay accuracy and precision, linearity and correlations (online Supplementary Table 2). Analytes were provided by the NeoSMAAT AC kit and were analysed for C2, C3, C4, C5, C6, C8, C10 and C12 for method performance. Mobile phases were (A) 100 % water and (B) 100 % acetonitrile, containing 0·1 % formic acid. After an isocratic step of 2 min at 98 % phase A, a linear gradient from 0 to 100 % B was run over the next 11·0 min with a mobile phase flow of 0·2 μl/min. Returning to 100 % A at 15·5 min, the column was then allowed to equilibrate for 3·5 min, leading to a total run time of 19·0 min. Acylcarnitines were quantified using Shimadzu LC Solution Software (Version 1.22 SP1 software, Shimadzu). All acylcarnitines were assayed using 13C acetyl-carnitine (Sigma-Aldrich) as the internal standard and then normalised to urinary creatinine excretion to control for variations in urine excretion(Reference Bonsnes and Taussky33).
The protocol for assaying 6-sulphatoxymelatonin, the chief metabolite of melatonin, was previously described(Reference Ishihara, Park and Suzuki34). Briefly, urinary 6-sulphatoxymelatonin was assayed by fluorometric HPLC(Reference Minami, Takahashi and Inagaki35) comprising an LC-20AD pump system (Shimadzu) equipped with a RF-10-A spectrofluorometer (Shimadzu), Inertsil ODS-3 analytical column (5020- 01732 GL Sciences) and column oven kept at 40°C (GL Science). 6-Sulphatoxymelatonin was quantified using Shimadzu LC Solution Software (Version 1·22 SP1 software, Shimadzu). Indole-3-acetamide was used as the internal standard, and 6-sulphatoxymelatonin excretion was normalised to urinary creatinine excretion to control for variations in urine excretion(Reference Bonsnes and Taussky33). Urinary nitrogen excretion (N) was measured using the Kjeldahl method.
Analysis
Analysis of circadian rhythms
The time courses of clock gene expression, core body temperature, heart rate and autonomic nervous system activity were evaluated using a cosinor analysis. The cosinor technique was applied to each subject’s data using the least-squares regression method to estimate the phase of the circadian variation based on the time of the maximum in the fitted cosine function, the amplitude (half the difference between the minimum and maximum in the fitted cosine function) and mesor (the rhythm-adjusted mean).
Statistical analysis
Results are expressed as the mean with their standard error of the mean. A study group of ten subjects was required for a power of 80 % at a two-sided α of 0·05. We performed a power analysis; the actual power was greater than 80 % for each comparison. The effects of the experimental meals on the time courses of energy metabolism, sleep stages, body temperature, autonomic nervous system activity, clock gene expression and plasma NEFA were analysed using a linear mixed-models ANOVA with repeated measures. When ANOVA revealed a significant interaction (diet × time), Bonferroni post-hoc tests were used to correct for multiple comparisons. The paired t test was used for comparisons of urinary metabolites (acylcarnitines, 6-sulphatoximelatonin and nitrogen) between the two trials.
Periodicity in the peak times of the cosinor curves was assessed by the Rayleigh test, which is an angle statistic and the most powerful invariant test for non-uniformity. Based on non-uniformity in the peak time of the cosinor curves, differences between the two trials were analysed using the paired t test. Differences in the amplitude and mesor were analysed using the paired t test.
Pearson’s correlation analysis was conducted to investigate the relationship between variables. All statistical analyses were performed using SPSS statistical software (version 23·0; SPSS Japan), with the level of significance set at 5 %.
Results
Physical characteristics of subjects
All subjects completed the two trials and no significant differences were observed in BMI, % body fat, fat-free mass or physical activity between the two trials (online Supplementary Table 3). The Morningness–Eveningness Questionnaire score ranged between 44 and 63, suggesting that all subjects had a non-extreme chronotype.
NEFA, glucose and insulin concentrations in plasma and expression profiles for circadian clock genes in leukocytes
Figure 2(a) and (b) shows the 24-h profiles of plasma PA and OA as percentages of total NEFA in the two trials. Plasma PA (C16:0) was significantly higher, while plasma OA (C18:1) was significantly lower in the session with meals rich in PA. The percentage of PA showed the significant effects of diet and interaction. The percentage of PA was significantly lower at 15.00 and 18.00 (all ps < 0·05) (Fig. 2(a)), while the percentage of OA was significantly higher at 12.00 and 18.00 (all ps < 0·05) (Fig. 2(b)) in the session with meals rich in OA than in that with meals rich in PA.
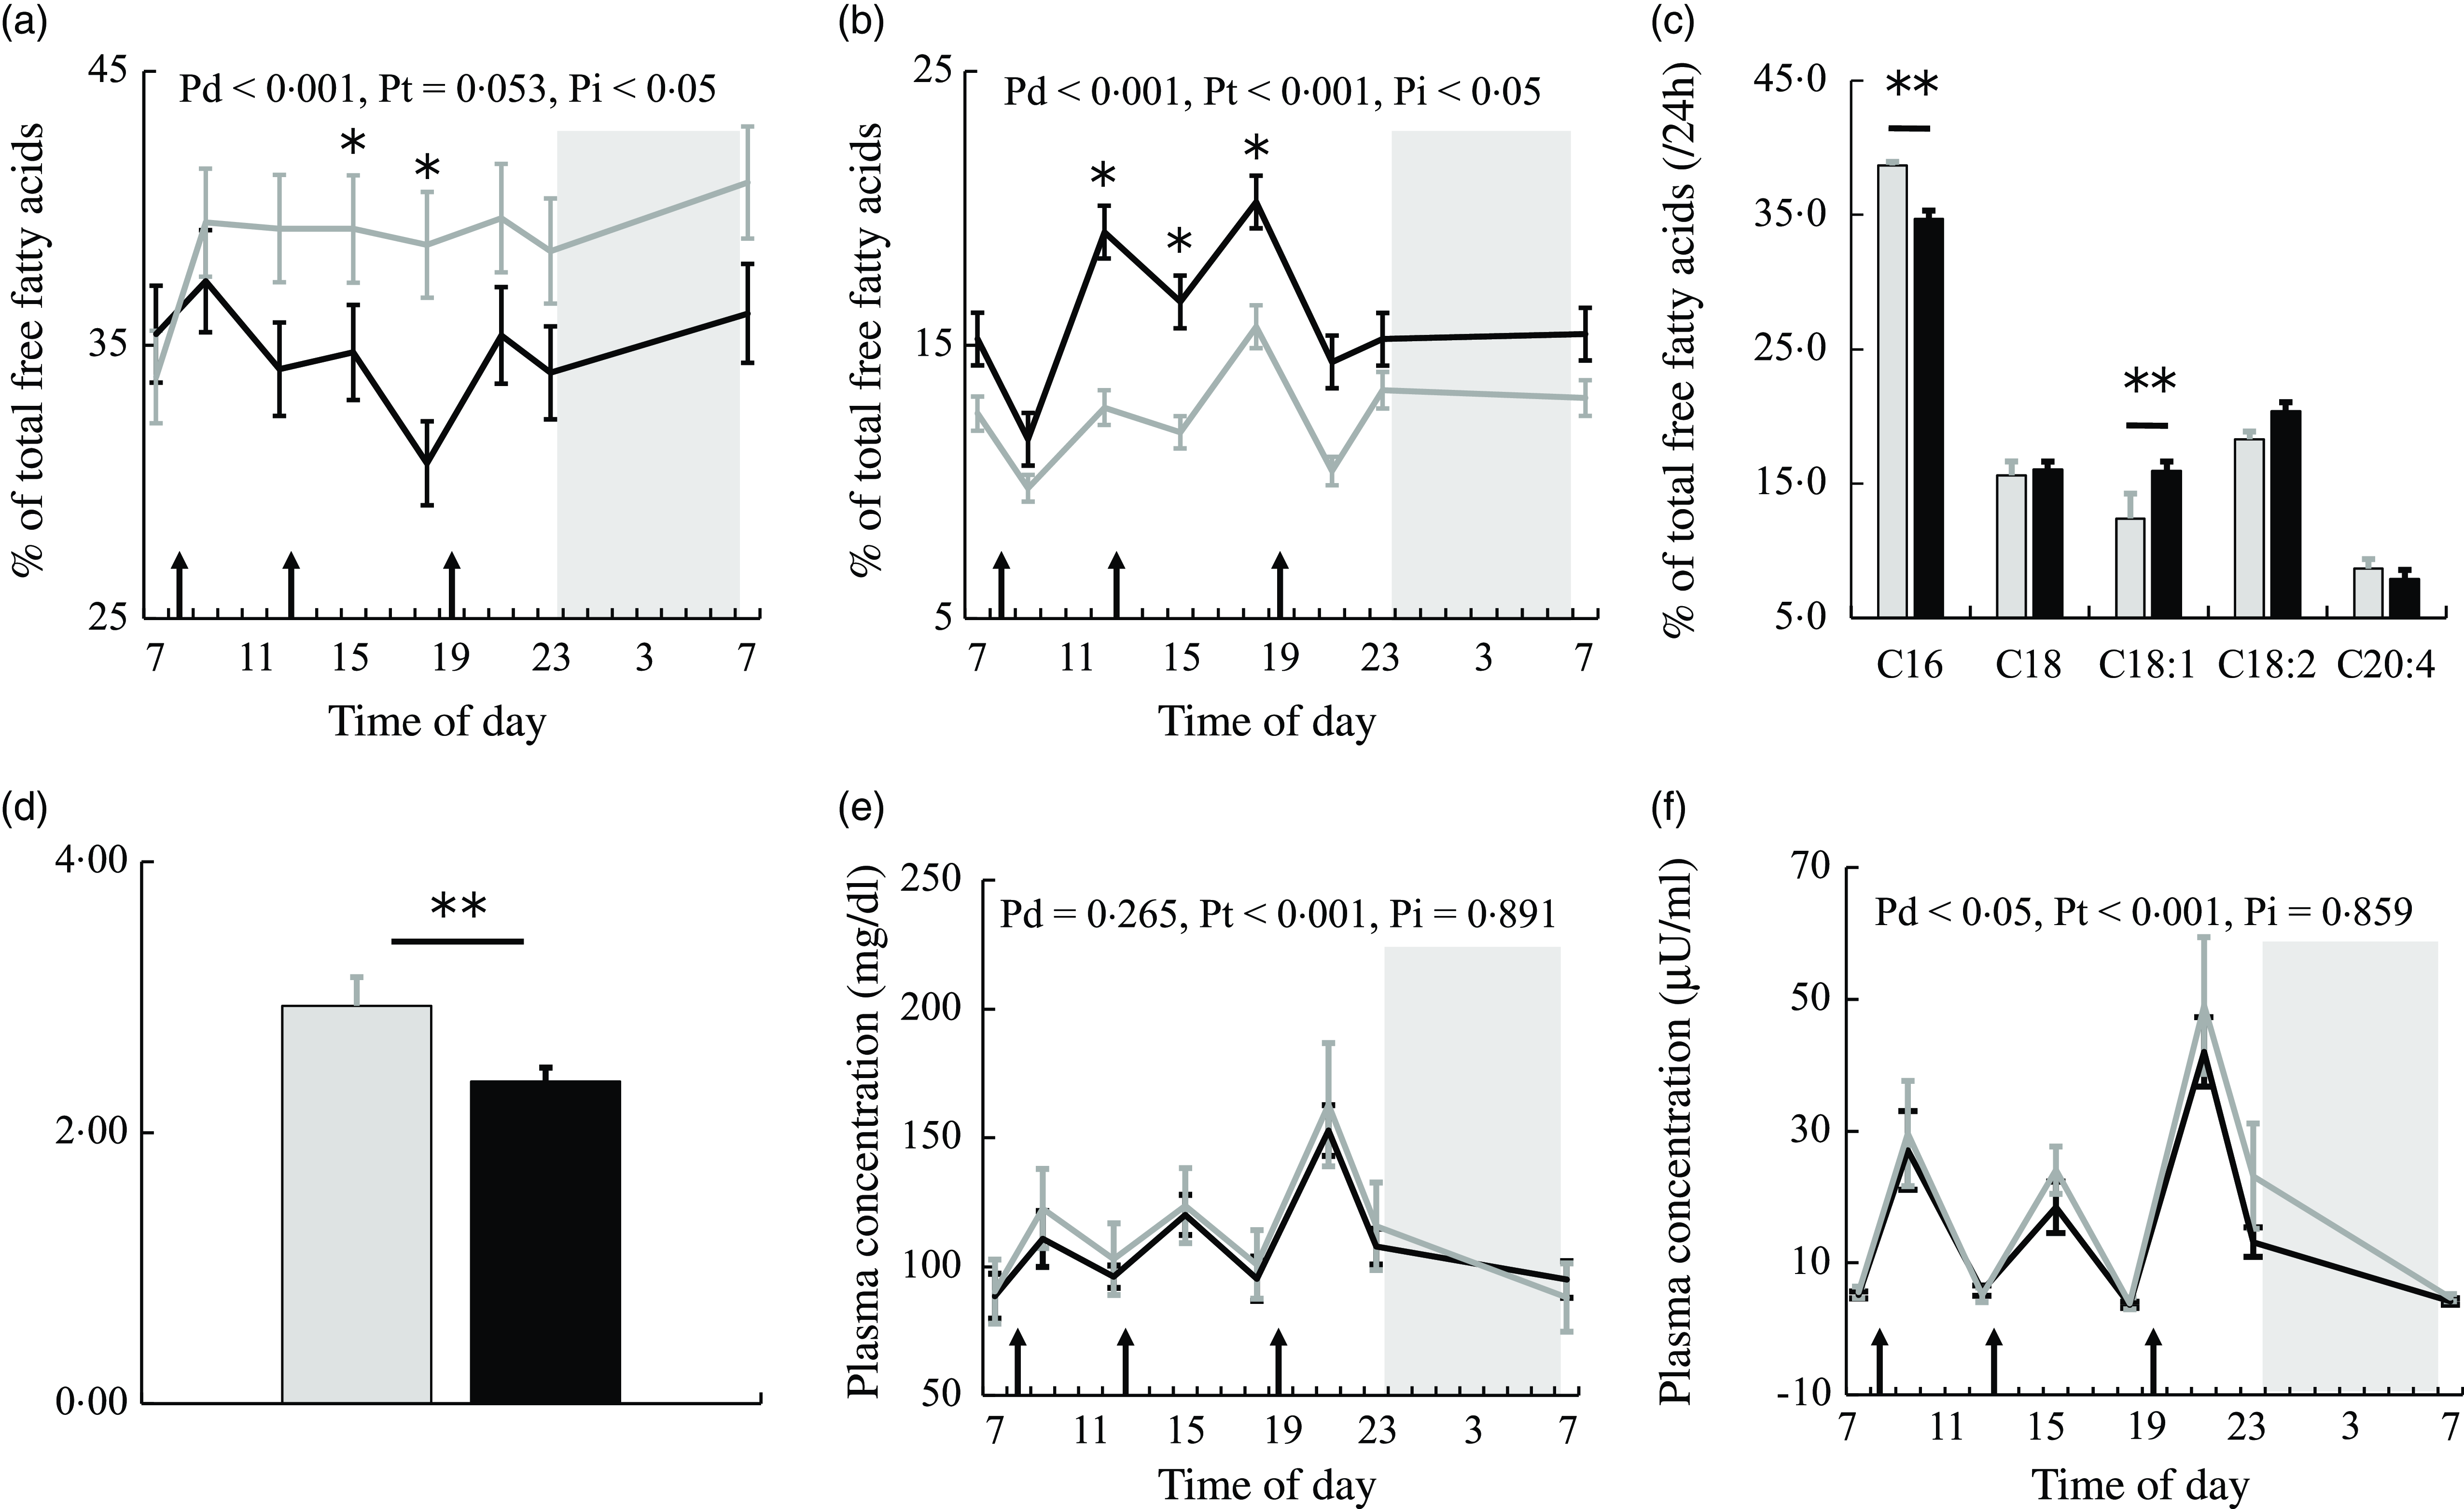
Fig. 2. NEFA, glucose and insulin concentrations in plasma. The time courses of changes in (a) palmitic acid and (b) oleic acid percentages and (e) glucose and (f) insulin concentrations in the session with meals rich in palmitic acid (grey) and oleic acid (black) are shown as the mean with their standard error of the mean (n 11). Average values of (c) NEFA compositions and (d) the PA/OA ratio at eight sampling points are also shown. A prescribed meal was provided as breakfast (08.00), lunch (12.30) and dinner (19.00), the times of which are indicated as arrows. Subjects slept for 8 h from 23.00 to 07.00 (grey bars). Significant differences in NEFA percentages and the PA/OA ratio in plasma between the two trials were assessed by the paired t test. The time courses of changes in NEFA percentages and glucose and insulin concentrations over 24 h were assessed by a linear mixed-models ANOVA with repeated measures. When ANOVA revealed a significant interaction (diet × time), Bonferroni post-hoc tests were used to correct for multiple comparisons. The P-values of a linear mixed model ANOVA were shown as Pd for the main effect of diet, Pt for the main effect of time and Pi for the interaction. *, P < 0·05 v. the palmitic acid trial. **, P < 0·01 v. the palmitic acid trial.
Average values over eight sampling points expressed as a % of total plasma NEFA showed that PA was significantly lower and plasma OA was significantly higher (all ps < 0·01) (Fig. 2(c)) in the session with meals rich in OA than in that with meals rich in PA. The ratio of palmitic acid to oleic acid concentrations in plasma (PA/OA) over 24 h was significantly lower in the session with meals rich in OA than in that with meals rich in PA (P < 0·01) (Fig. 2(d)).
Glucose showed the significant effect of time only (Fig. 2(e)). Insulin showed the significant effect of diet (Fig. 2(f)). Plasma insulin concentrations were higher in the session with meals rich in PA than in that with meals rich in OA.
The time course of the expression of each clock gene is shown as a z-score (Fig. 3(a)–(d)). Expression profiles for circadian clock genes in leukocytes did not significantly differ at any time point between the two trials. Figure 3(e)–(h) shows the peak expression times of these clock genes and the results of the Rayleigh test in the two trials. The results of the Rayleigh test indicated a significant difference in the peak time of expression and amplitude (P < 0·05) (Table 2 and Fig. 3(h)) of CRY1 in the two trials; however, the peak expression times of the other genes (CLOCK, BMAL1 and PER1) did not significantly differ. Furthermore, the mesor of these clock genes did not significantly differ between the two trials (Table 2).

Fig. 3. Expression profiles and the peak time of circadian clock gene expression in leukocytes. The time courses of (a) CLOCK, (b) BMAL1, (c) PERIOD (PER)1 and (d) CRY1 expression levels are shown as the mean standardised z-score value with their standard error of the mean(n 11) for relative expression in the session with meals rich in palmitic acid (grey) and oleic acid (black). A prescribed meal was provided as breakfast (08.00), lunch (12.30) and dinner (19.00), the times of which are indicated as arrows. Subjects slept for 8 h from 23.00 to 07.00 (grey bars). The peak times of expression for circadian clock genes were evaluated using a cosinor analysis, and its circular statistics are presented: (e) CLOCK, (f) BMAL1, (g) PERIOD (PER)1 and (h) CRY1 for the session with meals rich in palmitic acid (grey cycles) and oleic acid (black cycles). Grey arrows indicate the distribution width of the session with meals rich in palmitic acid and the black arrows that of oleic acid. The time courses of changes in the expression of circadian clock genes during 24 h were assessed by a linear mixed-models ANOVA with repeated measures. The P-value in the pie chart was the result of the paired t test. The radius of the pie chart = 1. *, P < 0·05 v. the palmitic acid trial.
Table 2. Comparison of clock gene expression, core body temperature, heart rate and autonomic nervous system by cosinor fitting (n 11)
(Standard error of the means)

PA trial, the session with meals rich in palmitic acid trial; OA trial, the session with meals rich in oleic acid trial; CBT, core body temperature; HF, high frequency; LF/HF, the power ratio of low frequency to high frequency. P values for peak times, amplitude and mesor were analysed by the paired t test.
* P < 0·05 v. the palmitic acid trial.
Energy metabolism
Energy intake during indirect calorimetry was similar in the two trials (Table 3). Data for one of the participating subjects were not measured due to issues with the expiratory gas analyser. Diet significantly affected energy expenditure, the respiration quotient and fat oxidation over 22 h, at the wake time and during sleep (Table 3). Energy expenditure and fat oxidation were significantly higher in the session with meals rich in OA than in that with meals rich in PA trial over 22 h, at the wake time and during sleep (Table 3 and Fig. 4(a) and (d)). The respiration quotient was significantly lower in the session with meals rich in OA than in that with meals rich in PA over 22 h, at the wake time and during sleep (Table 3 and Fig. 4(b)).
Table 3. Energy metabolism in male subjects during wake and sleep periods of calorimetry (n 10)
(Standard error of the means)

PA trial, the session with meals rich in palmitic acid trial; OA trial, the session with meals rich in oleic acid trial.
* P < 0·05 v. the palmitic acid trial.
** P < 0·01 v. the palmitic acid trial.
† Denominator df and F for a linear mixed-models ANOVA, and P-values for the main treatment effect of trial.

Fig. 4. Energy metabolism. Time courses of changes in (a) energy expenditure, (b) the RQ, (c) fat oxidation and (d) carbohydrate oxidation over 24 h are shown as the mean with their standard error of the mean (n 10) for the session with meals rich in palmitic acid (grey line) and oleic acid (black line). The mean with their standard error of the mean of energy metabolism was plotted at 30-min intervals, except for 21.00–23.00 of day 6 in the session for the preparation of polysomnographic measurements. A prescribed meal was provided as breakfast (08.00), lunch (12.30) and dinner (19.00), the times of which are indicated as arrows. Subjects slept for 8 h from 23.00 to 07.00 (grey bars).
Urinary nitrogen excretion as an index of protein catabolism was similar between the two trials (PA trial: 9·4 (sem 0·7) v. OA trial: 8·5 (sem 0·6), g/d, P = 0·512).
Sleep architecture
The durations of the sleep stages did not significantly differ between the two trials; however, the latency of SWS was longer in the session with meals rich in PA than in that with meals rich in OA (P < 0·05) (Table 4). The total duration of sleep (480 min) was divided into five equal periods (96 min for each period) to assess the rhythms of the appearance of the sleep stages. An analysis of each sleep period revealed significant interactions (diet × time) in the SWS duration. The SWS duration was significantly longer in the first period in the session with meals rich in OA than in that with meals rich in PA (P < 0·05) (Fig. 5(f)).
Table 4. The sleep architecture and nadir of core body temperature after bedtime (n 11) (Mean with their standard error of the means)
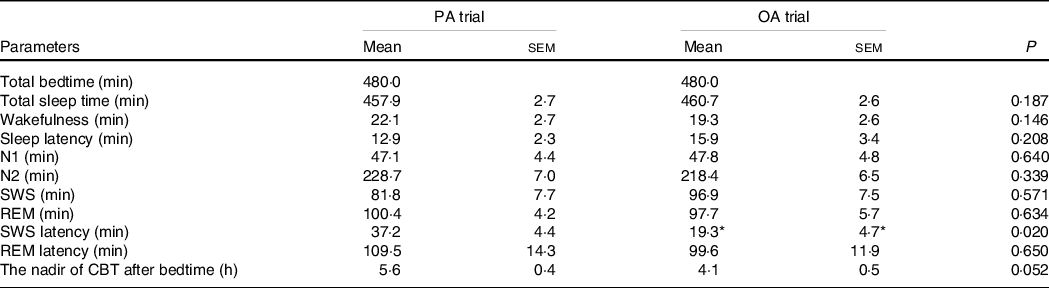
PA trial, the session with meals rich in palmitic acid trial; OA trial, the session with meals rich in oleic acid trial. Parameters are indicated as follows: SWS, slow-wave sleep; REM, rapid eye movement; N1, non-rapid eye movement sleep stage 1; N2, non-rapid eye movement sleep stage 2; SWS latency, the first SWS from sleep onset; REM latency, the first REM from sleep onset; CBT, core body temperature. Statistical analyses were performed by the paired t test.
* P < 0·05 v. the palmitic acid trial.

Fig. 5. Cumulative display of the sleep architecture and times of sleep stages. The sleep architecture is shown for (a) the session with meals rich in palmitic acid and (b) oleic acid. The percentage of subjects in each sleep stage is shown: stage wakefulness (black), stage N1 (grey), stage N2 (light blue), SWS (blue) and REM (red). To apply statistical analyses, the total duration of sleep (480 min) was divided into five equal periods (96 min), and the durations of (c) wakefulness, (d) REM, (e) N1 and N2 and (f) SWS are shown as the mean with their standard error of the mean (n 11) in the session with meals rich in palmitic acid (grey line) and oleic acid (black line). When ANOVA revealed a significant interaction (diet × time), Bonferroni post-hoc tests were used to correct for multiple comparisons. The P-values of a linear mixed model ANOVA were shown as Pd for the main effect of diet, Pt for the main effect of time, and Pi for the interaction. *, P < 0·05 v. the palmitic acid trial. SWS, slow wave sleep; REM, rapid eye movement.
Core body temperature, heart rate and autonomic nervous system activity
Diet significantly affected core body temperature, heart rate and parasympathetic nervous system activity over 24 h, at the wake time and during sleep (Table 5). Core body temperature was significantly lower in the session with meals rich in OA than in that with meals rich in PA during sleep (Table 5 and Fig. 6(a)). Heart rate was significantly lower in the session with meals rich in OA than in that with meals rich in PA over 24 h, at the wake time and during sleep (Table 5 and Fig. 6(b)). Parasympathetic nervous system activity was significantly higher in the session with meals rich in OA than in that with meals rich in PA over 24 h, at the wake time and during sleep (Table 3 and Fig. 6(c)). Online Supplementary Fig. 3(a)–(d) shows the peak times for core body temperature, heart rate and autonomic nervous system activity and the results of the Rayleigh test in the two trials. The Rayleigh test indicated no significant differences in the peak times for all parameters between the two trials. The amplitude and mesor of core body temperature, heart rate and autonomic nervous system activity did not significantly differ between the two trials (Table 2).
Table 5. Core body temperature, heart rate and autonomic nervous system activity in male subjects during wake and sleep periods (n 11) (Standard error of the means)

PA trial, the session with meals rich in palmitic acid trial; OA trial, the session with meals rich in oleic acid trial. Parameters are indicated as follows: CBT, core body temperature; HR, heart rate; LF/HF, low frequency to high frequency; HF, parasympathetic nervous system.
* P < 0·05 v. the palmitic acid trial.
** P < 0·01 v. the palmitic acid trial.
† Denominator df and F for a linear mixed-models ANOVA, and P-values for the main treatment effect of trial.
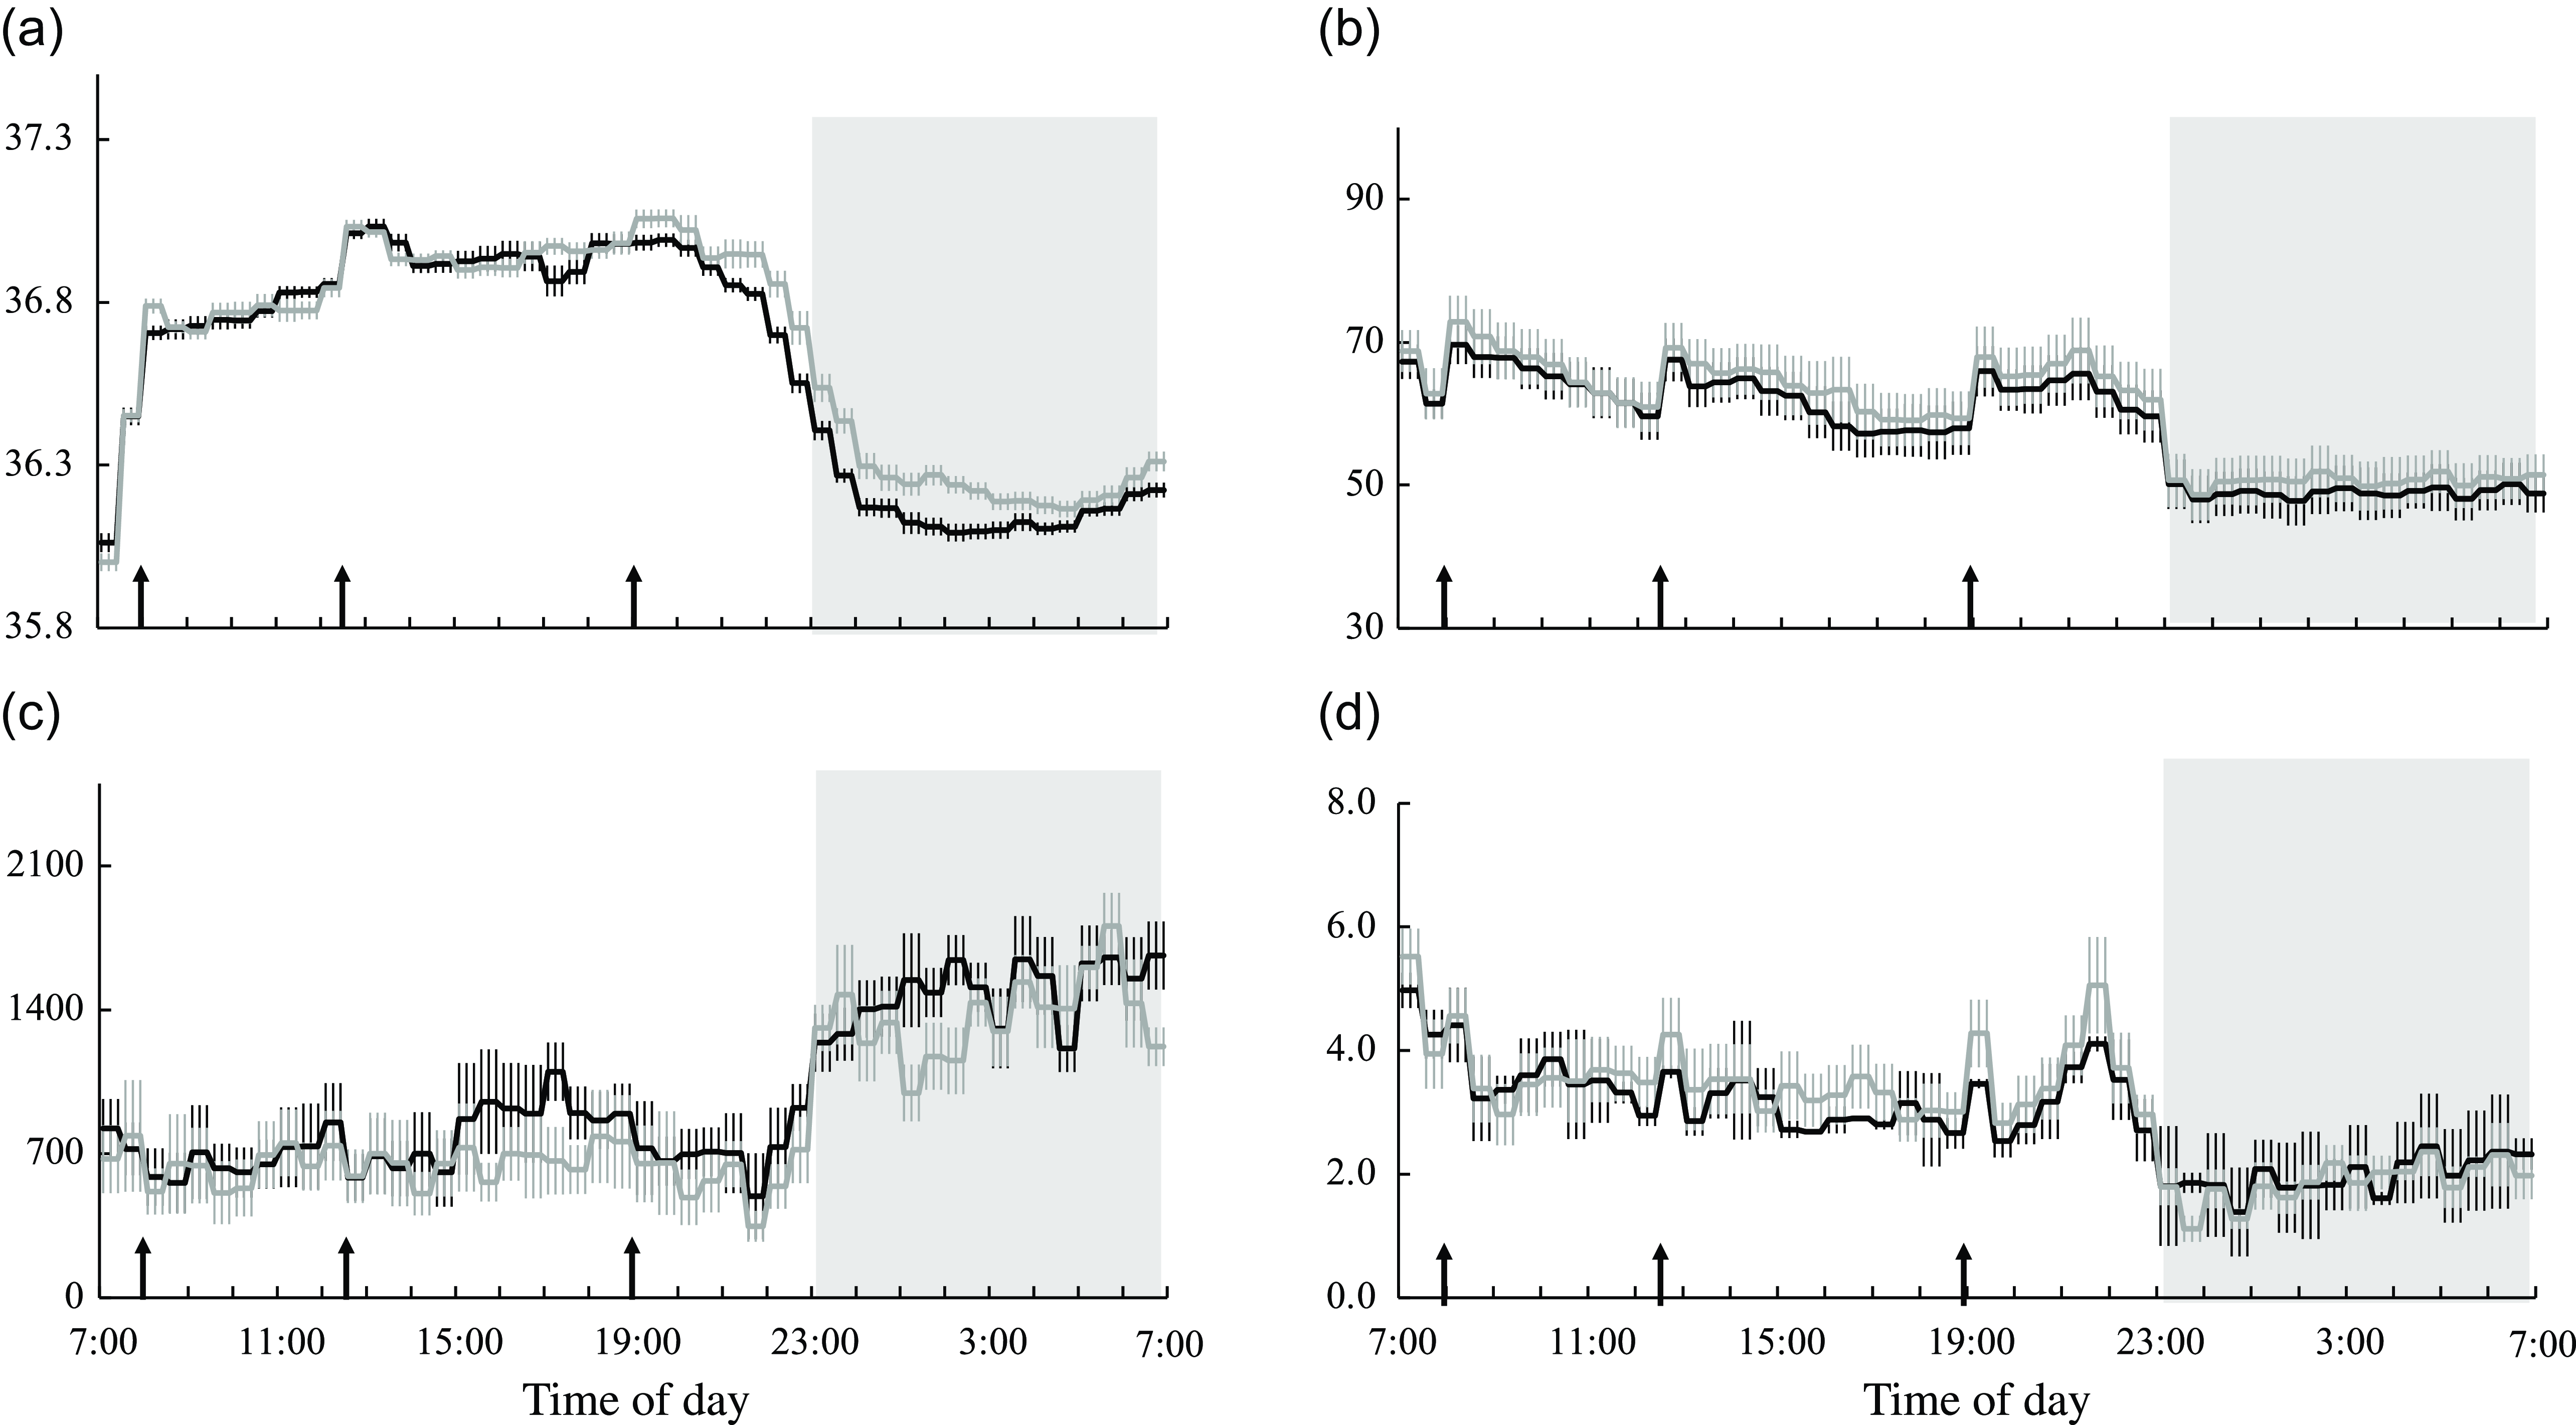
Fig. 6. Core body temperature, heart rate and autonomic nervous system activity. Time courses of changes in (a) core body temperature, (b) heart rate, (c) parasympathetic nervous system activity and (d) sympathetic nervous system activity are shown as the mean with their standard error of the mean (n 11) in the session with meals rich in palmitic acid (grey line) and oleic acid (black line). The mean with their standard error of the mean was plotted at 30-min intervals. A prescribed meal was provided as breakfast (08.00), lunch (12.30) and dinner (19.00), the times of which are indicated as arrows. Subjects slept for 8 h from 23.00 to 07.00 (grey bars). Parameters are indicated as follows: CBT, core body temperature; LF/HF, low frequency to high frequency; HF, parasympathetic nervous system.
Urinary metabolites
The urinary excretion of middle chain acylcarnitines (C8 and C10) during 24 h was lower in the session with meals rich in OA than in that with meals rich in PA (P < 0·05, online Supplementary Fig. 2(a)). The urinary excretion of acylcarnitines over 24 h positively correlated with the RQ (online Supplementary Fig. 4) and negatively correlated with fat oxidation (online Supplementary Fig. 5). Negative correlations were observed between some acylcarnitines (C4 and C6–C12 acylcarnitines) and fat oxidation, particularly in the session with meals rich in PA.
No significant difference was observed in urinary 6-sulphatoximelatonin excretion in the first morning urine between the two trials (online Supplementary Fig. 2(b)).
Correlations between the palmitic acid to oleic acid ratio in plasma and energy metabolism, slow wave sleep and core body temperature
Energy expenditure, carbohydrate oxidation and the duration of SWS did not correlate with the PA/OA ratio in plasma in the two trials (Fig. 7(a) and (c)). A positive correlation between the PA/OA ratio and RQ (PA trial: r = 0·577, P < 0·05, Fig. 7(b)) and a negative correlation between the PA/OA ratio and fat oxidation (PA trial: r = −0·695, P < 0·05, Fig. 7(d)) were observed in the session with meals rich in PA. The PA/OA ratio in plasma and the nadir of core body temperature positively correlated (OA trial: r = 0·437, P < 0·05, Fig. 7(f)) in the session with meals rich in OA.

Fig. 7. Relationships between the PA/OA ratio in plasma and energy metabolism, the duration of SWS and core body temperature. Relationships between the PA/OA ratio in plasma and (a) the RQ, (b) energy expenditure, (c) carbohydrate oxidation, (d) fat oxidation, (e) the duration of SWS in the 1st period and (f) the nadir of core body temperature are shown in the session with meals rich in palmitic acid (grey cycle) and oleic acid (black cycle). Pearson’s coefficient (R) and P-values are indicated, and the regression line represents a correlation. PA trial, the session with meals rich in palmitic acid trial; OA trial, the session with meals rich in oleic acid trial.
Discussion
Effects of a higher palmitic acid to oleic acid ratio on energy metabolism
The main results of the present study were that a meal-induced shift favouring a higher plasma PA/OA ratio was associated with detrimental effects on both energy metabolism and biological rhythms. Fat oxidation was lower, while the urinary excretion of middle chain acylcarnitines over 24 h was higher in the session with meals rich in PA than in that with meals rich in OA. These results are consistent with previous findings showing that a higher PA/OA ratio in plasma caused obesity, including insulin resistance and low-grade inflammation due to lipotoxicity(Reference Kien, Bunn and Poynter36,Reference Dumas, Bunn and Nickerson37) . The consumption of OA prevents obesity by activating PPARα, which induces the proliferation of peroxisomes and coordinates the expression of genes involved in β-oxidation in peroxisomes and mitochondria(Reference Rakhshandehroo, Knoch and Müller38). Plasma NEFA are an important ligand for PPARα activation and the transcriptional regulation of metabolic genes 17. An increase in the excretion of medium chain acylcarnitines has been proposed to reflect inefficient or incomplete long-chain FA β-oxidation in mitochondria(Reference Khodorova, Rietman and Rutledge39,Reference Libert, van Hoof and Thillaye40) . An intervention with orally administered fenofibrate to activate PPARα in healthy human volunteers reduced the urinary excretion of medium chain acylcarnitines(Reference Patterson, Slanař and Krausz41). In support of these findings, the present study showed a negative correlation between the urinary excretion of acylcarnitines and FA oxidation and a positive correlation between the urinary excretion of acylcarnitines and the RQ. PPARα also modulates inflammatory responses, suggesting that meals with a low PA/OA ratio exert beneficial effects by mitigating obesity-induced inflammation and related metabolic disorders(Reference Stienstra, Duval and Müller42).
Effects of a higher palmitic acid to oleic acid ratio on biological rhythms
Disruptions in biological rhythms may be caused by a higher PA/OA ratio. In animal studies, a high-fat meal enriched with PA prolonged the circadian behavioural cycle and attenuated the amplitude of circadian clock gene expression, such as BMAL1 and CLOCK, in peripheral tissues 12–16. Meals with different FA compositions affected the sleep-wake cycle of mice. The durations of non-rapid eye movement sleep during the rest period and wakefulness during the activity period were shorter in mice fed a meal rich in PA than in those fed a meal rich in OA(Reference Kohsaka, Laposky and Ramsey12–Reference Barnea, Madar and Froy15). Clinical trials reported a relationship between percentage energy consumed from PA and a short SWS duration(Reference Dashti, Follis and Smith43,Reference St-Onge, Roberts and Shechter44) . These findings are consistent with the present results showing that the higher PA/OA ratio in the session with meals rich in PA reduced the duration of SWS in the first half of sleep and prolonged the latency of SWS. The results of the Rayleigh test indicated that the amplitude of CRY1 was reduced and the peak time of core body temperature was delayed in the trial with a higher PA/OA ratio in plasma. However, the difference in the peak time of core body temperature between the two trials did not significantly differ.
Relationship between energy metabolism and biological rhythms
The potential link between energy metabolism and biological rhythms is explained by several molecular mechanisms(Reference Xu and Charoensuksai45). PPAR and core clock genes reciprocally regulate each other. PPAR regulate the transcription of some clock genes, for example, PPARα activates Rev-erbα (Reference Yang, Lamia and Evans46) and Bmal1(Reference Reppert and Weaver47). On the other hand, clock genes regulate the expression levels of PPAR, and the molecular mechanisms of both sets of genes are integrated(Reference Chen and Yang48). In animal studies, a treatment with bezafibrate, a PPARα agonist, advanced the phase of clock gene expression in peripheral tissues(Reference Shirai, Oishi and Kudo49). In addition, bezafibrate advanced the rhythms of sleep/wake and core body temperature by 2–3 h in mice(Reference Chikahisa, Tominaga and Kawai50). These findings demonstrate that PPARα participates in the control of both sleep and core body temperature, which are integrated by the core clock in the hypothalamus. In the present study, the PA/OA ratio in plasma and the nadir of core body temperature positively correlated with the OA trial. The peak in CRY1 gene expression was earlier and its amplitude was higher in the session with meals rich in PA than in that with meals rich in OA. Mammalian CRYs act as light-independent components of the circadian clock and may regulate Per1 transcriptional cycling by contacting both the activator and its feedback inhibitors(Reference Griffin, Staknis and Weitz51). The peripheral clock in leukocytes has been suggested to differ from that in the gastrointestinal tract 19 and the core clock in the hypothalamus(Reference Chikahisa, Tominaga and Kawai50). Furthermore, biological rhythms may be influenced by changes in autonomic nervous activity or the endocrine status in addition to clock gene expression in central or peripheral tissues.
Correlation between energy metabolism during sleep and the sleep architecture
The macronutrient composition of the meal has been shown to significantly affect nocturnal energy metabolism and the sleep architecture. A high-fat meal increased SWS more than a high carbohydrate meal(Reference Phillips, Crisp and Mcguinness52). Furthermore, a high-fat meal increased SWS and decreased rapid eye movement sleep more than a control mixed meal(Reference Afaghi, O’Connor and Chow53). The time course of the sleep architecture and whether changes in the sleep architecture were transient or persisted throughout the sleep period were not evaluated in these studies. We previously reported that carbohydrate oxidation was higher and the duration of SWS was shorter during the first half of sleep with the consumption of a high carbohydrate meal than a high-fat meal(Reference Yajima, Seya and Iwayama54). In the present study, fat oxidation was lower, the duration of SWS in the first half of sleep was shorter and the latency of SWS was longer in the session with meals rich in PA than in that with meals rich in OA. Energy metabolism and substrate oxidation during sleep have been suggested to correlate with the sleep stage, indicating that energy metabolism affects the sleep architecture or vice versa(Reference Kayaba, Park and Iwayama55). One potential mechanism is changes in the secretion of hormones, primarily insulin, ghrelin and melatonin, before bedtime and during sleep affecting energy metabolism and the sleep architecture. No significant differences in the urinary excretion of 6-sulphatoxymelatonin in the first morning urine were observed between the two trials. This was partly attributed to the poor time resolution of collected urinary samples because they reflected the total amount of melatonin metabolites during a subject’s sleep period from 23.00 to 07.00.
Lower fat oxidation in the session with meals rich in PA than in that with meals rich in OA was observed during sleep as well as at the wake time. Lower fat oxidation during sleep may lead to the future development of metabolic inflexibility(Reference Begaye, Vinales and Hollstein56) and insulin resistance(Reference Goodpaster and Sparks57). FA oxidation in astrocytes(Reference Edmond, Robbins and Bergstrom58) in the cortex and thalamus controls the downstate and spindles during non-rapid eye movement sleep(Reference Mak-Mccully, Rolland and Sargsyan59). Allaing et al. proposed that an increase in local fat oxidation, particularly in the brain, actively supports the sleeping state(Reference Nowak, Gaisl and Miladinovic60). Accumulating evidence suggests that insufficient sleep is the cause of various metabolic disorders(Reference Farhud and Aryan61–Reference Almoosawi, Vingeliene and Karagounis63). The present study shows that the delayed appearance of SWS and the decline in core body temperature often observed in night-type individuals(Reference Baehr, Revelle and Eastman64) may be normalised by consuming a meal rich in OA.
Limitations
The present study has several limitations. We examined diurnal changes in clock gene expression by sampling leukocytes eight times in a 24-h period because repeated blood sampling was feasible and clock genes in leukocytes exhibit rhythmic expression(Reference Archer, Viola and Kyriakopoulou65–Reference Kavcic, Rojc and Dolenc-Groselj67). Possible explanations for the lack of an effect of the meal rich in PA or OA on clock gene expression include the following: (1) the expression of clock genes being evaluated in leukocytes, not hepatic tissue(Reference Yoshida, Shikata and Seki68–Reference Nováková, Polidarová and Sládek70) or white adipose tissue(Reference Wehrens, Christou and Isherwood71) and (2) the short-term dietary intervention, that is, 1 d. Further studies are needed to clarify the chronic effects of differential dietary FA consumption. In addition, the sample size was small and the age of subjects was limited. To generalise the present results, experiments with young healthy women, middle-aged individuals and the elderly are warranted.
Conclusion
In healthy young males, meals rich in PA decreased fat oxidation and disrupted biological rhythms, particularly the sleep architecture and core body temperature during sleep, more strongly than meals rich in OA.
Acknowledgements
We wish to thank Mr. Shota Mitsuhashi, Ms. Nozomi Kashiba and Mr. Ken Takagi for their assistance with the study; Fuji Medical Science Co. (Chiba, Japan) for technical support with the metabolic chamber and the research participants for their dedication and cooperation.
This work was supported by JSPS KAKENHI Grant Numbers JP17K13234 and 20H04120.
Y. K. and T. K. designed the experiments; Y. K., P. I., A. I., Y. T. and S. Z. performed the study; C. S., O. H., K. M., J. S. and K. M. analysed the data; Y. K. wrote the manuscript; K. M. and K. T. provided a critical review and revisions to the manuscript.
There are no conflicts of interest.
Data described in the manuscript, code book and analytic code will be made available upon request pending application and approval.
Supplementary material
For supplementary materials referred to in this article, please visit https://doi.org/10.1017/S0007114523001770


