


Vitamin D (VD) is an active circulating pre-hormone with a well-defined role in Ca and P homeostasis( Reference Schuch, Garcia and Martini 1 ). While VD can be obtained from dietary sources( Reference Norman 2 ), subcutaneous skin production, via the action of UVB irradiation, is the principal route of VD synthesis in the human body( Reference Marcotorchino, Tourniaire and Astier 3 ). The biological activity of VD is dependent on the consecutive action of two hydroxylases present in the liver (25-hydroxylase) and in the kidney (1-α-hydroxylase), generating 1,25-dihydroxy-VD (1,25(OH)2D)( Reference Marcotorchino, Tourniaire and Astier 3 , Reference Percegoni and Castro 4 ). The activation of VD receptors (VDR) by VD mediates the pleiotropic functions of these hormone in several tissues( Reference Marcotorchino, Tourniaire and Astier 3 – Reference Zeitz, Weber and Soegiarto 5 ).
Several common conditions, such as low sunshine exposure, malabsorption and ageing, are related to VD deficiency( Reference Bourlon, Billaudel and Faure-Dussert 6 ). However, in recent decades the associations between excessive white adipose tissue (WAT) content and VD deficiency have been observed in some studies( Reference Schuch, Garcia and Martini 1 , Reference Marcotorchino, Tourniaire and Astier 3 ), a condition that could favour the metabolic abnormalities present in obesity( Reference Jamka, Wozniewicz and Jeszkal 7 , Reference Kheder, Hobbirk and Saeed 8 ). In this regard, obesity is an important component of the metabolic syndrome, defined as the association of insulin resistance (IR), glucose intolerance( Reference Mathieu, Gysemans and Giulietti 9 ), dyslipidaemia, hypertension and excessive WAT visceral content( Reference Wilcox 10 ). Thus, obesity and the metabolic syndrome are conditions intimately related to the development of type 2 diabetes mellitus and CVD worldwide( Reference Jamka, Wozniewicz and Jeszkal 7 , Reference Mathieu, Gysemans and Giulietti 9 – Reference Alejandro, Gregg and Blandino-Rossano 11 ). It has been demonstrated that VD supplementation could improve glucose tolerance, pancreatic β-cell function and insulin sensitivity( Reference Bourlon, Billaudel and Faure-Dussert 6 – Reference Kheder, Hobbirk and Saeed 8 , Reference Palomer, González-Clemente and Blanco-Vaca 12 , Reference Lahbib, Ghodbane and Louchami 13 ), although these actions have not been confirmed by all authors( Reference Calle, Maestro and García-Arencibia 14 – Reference de Boer, Tinker and Connelly 17 ).
VD has direct effects on the endocrine pancreas( Reference Palomer, González-Clemente and Blanco-Vaca 12 ). In the pancreatic β-cell, the presence of VDR and the expression of 1α-hydroxylase enzyme is well established( Reference Zeitz, Weber and Soegiarto 5 , Reference Calle, Maestro and García-Arencibia 14 , Reference Vangoitsenhoven, Wolden-Kirk and Lemaire 18 , Reference Neelankal and Jiang 19 ). Rodents with VD depletion present impaired insulin secretion( Reference Kheder, Hobbirk and Saeed 8 , Reference Lahbib, Ghodbane and Louchami 13 ). Moreover, glucose-induced insulin secretion (GIIS) is diminished in islets from VDR-mutant mice( Reference Zeitz, Weber and Soegiarto 5 , Reference Vangoitsenhoven, Wolden-Kirk and Lemaire 18 ). The stimulus of VDR on pancreatic β-cells appears to alter Ca2+ flux and modulates anti-inflammatory and anti-apoptotic pathways in the pancreas( Reference Gysemans, Cardozo and Callewaert 20 ). Similar effects were also found in a mouse insulinoma cell line (MIN6)( Reference Gysemans, Cardozo and Callewaert 20 ). In addition, the GIIS in the pancreatic β-cell is substantially modulated by acetylcholine (Ach), released from the vagus nerve, a response mediated by the muscarinic 2 receptor (M3R) and its downstream pathways, such as protein kinase C (PKC) and protein kinase A (PKA)( Reference Gilon 21 , Reference Miranda, Agostinho and Trevenzoli 22 ). Interestingly, islets from diabetics rats treated with VD presented a re-establishment of their cholinergic response and increased M3R expression( Reference Kumar, Sherin and Mohan 23 ). Neonatal treatment of rodents with monosodium glutamate (MSG) provokes hypothalamic lesions, resulting in the development of obesity in adulthood( Reference Olney 24 ). The MSG-treated rats reproduces the same characteristics of the metabolic syndrome found in obese humans( Reference Olney 24 – Reference Diemen, Trindade and Trindade 26 ). Moreover, isolated pancreatic islets from MSG-treated rats showed changes in GIIS and reduced cholinergic insulinotropic responsiveness( Reference Balbo, Gravena and Bonfleur 27 , Reference Lubaczeuski, Balbo and Ribeiro 28 ). In the present study, we evaluated whether chronic VD supplementation modifies the metabolic abnormalities induced by MSG treatment, particularly investigating their effects on GIIS and cholinergic responsiveness in isolated pancreatic islets.
Experimental methods
Ethical aspects
All experimental procedures were conducted with male Wistar rats, where the number of animals used in each protocol was determined following previous similar studies( Reference Lubaczeuski, Balbo and Ribeiro 28 , Reference Leite, Ferreira and Rickli 29 ). During lactation and growth, rats were maintained in adequate conditions, according to the guidelines of the National Council for Control of Animal Experiments, following international norms for animal care and maintenance, as recommended by the Arrive Guidelines( 30 ). The rats were kept in plastic cages (n 3–4 rats/cage) with a stainless steel cover and housed in a controlled environment, with a 12-h light cycle, constant temperature (21 ± 2°C) and free access to food and water( Reference Mattaraial and Moura 31 ). All experimental protocols were previously approved by the Ethics Committee on Animals Use (CEUA/15 November 2015) of the Western Parana State University (UNIOESTE).
Hypothalamic obesity induction
At birth, the size of the offspring was adjusted to six male pups per dam to ensure adequate nutritional lactation( Reference Mattaraial and Moura 31 , Reference Santos and Vianna 32 ). From the second to the sixth day of life, male Wistar (n 30) rats received daily subcutaneous injections of MSG in a dose of 4 g/kg body weight (BW)( Reference Lubaczeuski, Balbo and Ribeiro 28 , Reference Leite, Ferreira and Rickli 29 ). During the same period, the control (CON) rats (n 30) received subcutaneous injection of NaCl solution (1·25 g/kg BW). At 30 d of life, the MSG and CON rats were weaned and randomly assigned to VD-supplemented or non-supplemented (NS) groups, according to the protocol described in the next section. Thus, considering the obesity treatment and VD supplementation, four experimental groups were formed (n 15 rats/group), as shown in Fig. 1: CON-NS: control non-supplemented; CON-VD: control VD-supplemented; MSG-NS: MSG non-supplemented; MSG-VD: MSG VD-supplemented.
Vitamin D supplementation
From 30 to 85 d of life, the VD-supplemented groups received SupraD® at a dose of 12 µg/kg( Reference Santos and Vianna 32 , Reference Sadek and Shaheen 33 ) of BW dissolved in corn oil (vehicle). The VD dose was administered orally between 9.00 and 11.00 hours, three times per week, by gavage. To simulate the stress of oral supplementation, the NS groups also received the same volume of vehicle but without VD, for the same period and at the same frequency as for the VD-supplemented groups.
Body weight, growth and food intake
From 30 to 85 d of life, BW and food intake were monitored three times a week. For this, rats received a tail mark and had their BW individually registered in grams. To calculate food intake, the difference between the total of food offered and the amount of food remaining from the previous 48 h was obtained and divided by the number of rats per cage by individual BW( Reference Barella, de Oliveira and Branco 34 , Reference Barella, Miranda and Franco 35 ). Thus, food intake was expressed in g/g of BW. The standard chow diet (BIOBASE, SC, Brazil) used in the present study followed the recommendations of the American Institute of Nutrition (AIN)-93( Reference Reeves, Nielsen and Fahey 36 ) and contained 1·1 % Ca; 0·8 % P and 0·1 μg/g VD. Food and tap water were offered ad libitum. The data obtained from food intake and BW were used to elaborate the curves of food and BW evolution, and the respective AUC was calculated for both parameters.
Oral glucose tolerance test
At 76 d of life and after 12 h of fasting, 6–9 rats from each experimental group were submitted to glucose load (2 g/kg BW) by oral gavage. Blood sample was collected by puncture of the tail vein at time 0 (before glucose load) and at times 15, 30, 60 and 120 min after glucose loading, and plasma glucose levels were measured using a glucometer (Accu-Chek Active®). The glucose concentration during an oral glucose tolerance test (OGTT) was used to calculate the AUC.
Biometric parameters and white adipose tissue content
At 86 d of life and after 12 h of fasting, the animals were euthanised by decapitation after previous desensitisation with CO2. Peripheral blood was immediately collected in heparinised tubes for the measurement of plasma biochemical parameters, as described in the next section. In order to analyse the different fat depots, perirenal (visceral) and inguinal (subcutaneous) depots of WAT were removed and weighed. BW (g) and naso-anal length (cm) were used to calculate the Lee index, using the formula, Lee index= 3√BW (g)/naso-anal length (cm), as previously established by Bernardis & Patterson( Reference Bernardis and Patterson 37 ) and Rogers & Webb( Reference Rogers and Webb 38 ).
Blood biochemistry parameters and insulin resistance
The peripheral blood collected was centrifuged (3000 rpm/min; 15 min) and the plasma obtained was used to measure glucose, TAG and total cholesterol using colorimetric enzymatic kits (Lab Test, BR; GPO-Trinder, BR, respectively) according to the manufacturer’s instructions. The plasma insulin level was evaluated by radioimmunoassay. Plasma glucose (mmol/l) and insulin (µU/ml) levels were used to calculate the homeostatic model assessment of insulin resistance (HOMA-IR) using the formula: HOMA-IR = insulin (µU/ml) × glucose (mmol/l)/22·5, as previously established by Matthews et al. ( Reference Matthews, Hosker and Rudenski 39 ) This measurement has been validated for rodents( Reference Antunes, Elkfury and Jornada 40 ). Plasma Ca and P were measured by colorimetric methods. The reagent for the quantitative determination of inorganic P was used for the dosage of P in plasma using an automated Beckman Coulter AU5800 analyser (range 0·5–17·9 mg/dl; 0·16–5·8 mmol/l). The HumaStar 600 analyser and Calcium Liquicolor Multipurpose (Hummann inVitro) reagent were used for Ca dosage in plasma. Moreover, the 25-hydroxy-VD (25(OH)D) level was evaluated by Chemiluminescent Microparticle Immunoassay using an automated Architect Abbott i1000SR, employing Abbott Architect 25(OH)D reagent (assay range 0·0–160·0 ng/ml (400·0 nmol/l)). Importantly, all kits were developed for use in human plasma; but as free Ca, free P and 25(OH)D are chemically identical across species, no species differences were anticipated.
Pancreatic islet isolation and insulin secretion
Groups of 5–6 rats per group were used for pancreatic islet isolation by the collagenase technique, according to a previous protocol established by Lacy & Kostianovsky( Reference Lacy and Kostianovsky 41 ), with modifications( Reference Hara, Taniguchi and Yamashiro 42 ). Briefly, the common bile duct was localised and perfused with Hanks buffer solution (HBS), pH 7·4, and 0·1 % bovine serum albumin (BSA), containing collagenase type V (1 mg/ml). The pancreas was then perfused by retrograde flux via the pancreatic duct and immediately excised and then digested at 37°C. The islets were manually collected, washed in HBS and transferred to wells in culture plates containing 1 ml of Krebs buffer solutions, pH 7·4, and 0·1 % of BSA in the presence of 5·6 mm glucose. During the pre-incubation phase, the isolated pancreatic islets (four islets/well) were transferred to a culture chamber (95 % CO2) at 37°C for 60 min. After pre-incubation, the medium was changed and the isolated pancreatic islets received 1 ml of Krebs solutions containing 5·6 or 8·3 mm glucose to evaluate GIIS. Other islet groups received 1 ml of Krebs solution containing 8·3 mm glucose in the presence of the cholinergic agonist, carbachol (10 µm). Aliquots for all islet experiments were used to measure insulin by radioimmunoassay. GIIS was expressed as ng/ml per four islets. The insulinotropic effect of carbachol was expressed as a percentage, considering the effect of 8·3 mm glucose as 100 %.
Histological analysis of pancreas
Firstly 4–6 pancreas per group were removed, dissected, weighed and placed in histological cassettes, before being immediately transferred to the fixative solution ALFAC (alcohol 70 %, formalin 37–40 % and glacial acetic acid) for 24 h. Dehydration was performed by passing the samples through ethanol solutions of increasing graduation (70, 80, 90 and 100 %). The samples were then diaphanised in xylol and were finally embedded in Paraplast (Surgipath Paraplast; Leica Biosystems). The tissues were sectioned at 5 µm on a Reichert Jung rotary microtome (Leica RM 2025 Microsystems Inc.), and haematoxylin and eosin were used for staining. Microscopic analysis of stained preparations was carried out using an Olympus BX51 and digital photographs were taken with a digital 36-bit still colour camera, 1280 × 1024 pixels, with a DP71 Controller (Olympus). Image J® 1.42q software, available from the National Institute of Mental Health site (http://rsb.info.nih.gov/ij, accessed 15 June 2017), was employed for the analyses of numbers and areas of pancreatic islets. Approximately 3–5 microscopic fields per section and three sections per animal (six rats per group) were analysed. The mean of the pancreatic islets area was expressed as a percentage of the values observed in the CON-NS group (regarded as 100 %).
Western blotting
Islets from 4–6 rats for each group were solubilised in buffer containing 100 mm Tris, pH 7·5, 10 mmol/l sodium pyrophosphate, 100 mm sodium fluoride, 10 mmol/l EDTA, 10 mm sodium vanadate, 2 mm phenylmethylsulfonyl fluoride and 2 % Triton X-100, final pH 8·08. The protein concentration in the supernatants was assayed using the Bradford assay( Reference Bradford 43 ). For sodium dodecyl sulphate-polyacrylamide gel electrophoresis and Western blot analysis, samples were treated with Laemmli buffer. After heating to 95°C for 5 min, the proteins were separated by electrophoresis (30 µg/lane, 10 % gel) and transferred to nitrocellulose membranes. The membranes were blocked overnight at 4°C in Tris-buffered saline containing 5 % skimmed milk. Subsequently, the membranes were incubated with a polyclonal antibody against Ach-M3R (1:200, catalogue M6598; Sigma); for evaluating PKAα expression, the membranes were incubated with a polyclonal antibody against PKAα (1:200, catalogue SC903; Sigma) and an anti-PKC antibody (Pkcα, sc-8393; SCBT). After washing, the membranes were incubated for 2 h with a secondary antibody (1:10 000; Invitrogen), followed by exposure to ImageQuant LAS 4000 Mini (GE Healthcare Bio-Sciences) to detect the chemiluminescence of nitrocellulose membranes. After assaying the target protein, Western blotting was repeated using an α-tubulin (1:1000, catalogue T6199; Sigma) antibody, as an internal control. Band intensities were quantified by optical densitometry using Image J® software. Data are expressed as normalisation of Ach-M3R, PKAα and PKCα:α-tubulin ratio.
Statistical analysis
Data are presented as means with their standard errors and analysed by two-way ANOVA. When F values were significantly different (P < 0·05), the Tukey post-test was applied to evaluate the difference between groups CON-NS, CON-VD, MSG-NS, MSG-VD. The statistical analyses were conducted using Prism for Macintosh, version 5.0 (GraphPad Software).
Results
The effects of chronic supplementation with VD on the biometric parameters of rats are shown in Table 1. At 86 d of life, BW was affected by MSG treatment (F 1,50 = 151·1; P < 0·0001) and also by the interaction of VD supplementation and MSG treatment (F 1,50 = 4·101; P = 0·048). Naso-anal length was affected only by neonatal treatment with MSG (F 1,50 = 151·1; P < 0·0001; F 1,80 = 193·0; P < 0·0001) and no influence of VD supplementation was observed (F 1,50 = 0·252; P = 0·6156; F 1,80 = 2·664; P = 0·1066), where BW and naso-anal length were significantly lower in MSG-NS and MSG-VD rats, in relation to the CON-NS and CON-VD groups (P < 0·05). Neither MSG treatment nor VD supplementation affected the Lee index. MSG treatment also modulated subcutaneous (F 1,54 = 50·56; P < 0·0001) and visceral (F 1,58 = 9·431; P = 0·0032) fat depots, where MSG-NS and MSG-VD rats presented higher fat accumulation compared with the CON groups (P < 0·05).
Table 1. Effects of chronic supplementation with vitamin D (VD) on biometric parameters* (Mean values with their standard errors; n 10–15 rats per group)
CON-NS, control non-supplemented; CON-VD, control supplemented with VD; MSG-NS, monosodium glutamate non-supplemented; MSG-VD, MSG supplemented with VD.
* Letters above numbers show statistical differences between groups by two-way ANOVA with Tukey post-test (P < 0·05). (a) CON-NS, (b) CON-VD, (c) MSG-NS and (d) MSG-VD.
Table 2 presents the effects of chronic VD supplementation on biochemical parameters in the plasma. MSG treatment (F 1,49 = 9·985; P = 0·0027) significantly increased plasma glucose levels in MSG-NS and MSG-VD rats, compared with the levels in the CON-NS group (P < 0·05). The plasma level of insulin was affected by the interaction of MSG treatment and VD supplementation (F 1,44 = 20·41; P < 0·0001), where MSG-NS rats presented higher plasma insulin levels compared with the CON-NS and MSG-VD groups (P < 0·05).
Table 2. Effects of chronic supplementation with vitamin D (VD) on biochemical plasma parameters and insulin resistance* (Mean values with their standard errors; n 10–15 rats per group)
CON-NS, control non-supplemented; CON-VD, control supplemented with VD; MSG-NS, monosodium glutamate non-supplemented; MSG-VD, MSG supplemented with VD; HOMA-IR, homeostatic model assessment of insulin resistance.
* Letters above numbers show statistical differences between groups by two-way ANOVA with Tukey post-test (P < 0·05). (a) CON-NS, (b) CON-VD, (c) MSG-NS and (d) MSG-VD.
† To convert glycaemia in mg/dl to mmol/l, multiply by 0·0555. To convert TAG in mg/dl to mmol/l, multiply by 0·0113. To convert cholesterol in mg/dl to mmol/l, multiply by 0·0259. To convert Ca in mg/dl to mmol/l, multiply by 0·25. To convert P in mg/dl to mmol/l, multiply by 0·323.
Plasma levels of TAG and total cholesterol were influenced by MSG treatment (F 1,33 = 3·796; P = 0·0599; F 1,35 = 23·51; P < 0·0001) and VD supplementation (F 1,33 = 18·35; P = 0·0001; F 1,35 = 10·07; P = 0·0031), as well as by the interaction between these factors (F 1,32 = 5·797; P = 0·220; F 1,35 = 7·302; P = 0·0106). MSG-NS rats demonstrated increased plasma TAG compared with the levels in the CON-NS, CON-VD and MSG-VD groups (P < 0·05). In addition, plasma total cholesterol level was higher in MSG-VD rats in relation to other groups (P < 0·05). Insulin sensibility was also influenced by MSG treatment (F 1,38 = 0·4787; P = 0·0349) and VD supplementation (F 1,38 = 4·403; P = 0·0426), as well as by the interactions between these factors (F 1,38 = 7·305; P = 0·0102). Thus, the HOMA-IR value was increased in MSG-NS animals, compared with the CON-NS, CON-VD and MSG-VD groups (P < 0·05). Moreover, VD supplementation had a significant effect (F 1,40 = 3601; P < 0·0001) on plasma 25(OH)D level. Thus, in CON-VD and MSG-VD rats, higher 25(OH)D levels were found, in relation to the respective NS animals (P < 0·05). MSG treatment exerted effects on Ca plasma levels (F 1,49 = 12·60; P = 0·009), where the MSG-VD rats presented slightly greater Ca levels than the CON-NS animals (P < 0·05). Neither MSG treatment nor VD supplementation affected plasma P levels.
Fig. 2 presents the effects of chronic VD supplementation on growth (Fig. 2(A) and (B)) and food intake (Fig. 2(C) and (D)). Again, only an effect of MSG neonatal treatment was observed for both parameters (F 1,52 = 167·5; P < 0·0001 and F 1,48 = 9·403; P = 0·0036). From 40 to 86 d of age, MSG-NS and MSG-VD rats presented lower BW than CON groups, resulting in reduced BW AUC in the MSG animal groups, compared with the AUC of CON rats (P < 0·05). MSG treatment alone affected food intake; however, the association of MSG and VD supplementation did not alter the AUC for food intake.
Fig. 1. Experimental design. MSG, monosodium glutamate; CON, control; CON-NS, control non-supplemented; CON-VD: control supplemented with vitamin D; MSG-NS, MSG non-supplemented; MSG-VD, MSG supplemented with vitamin D; OGTT, oral glucose tolerance test.
Fig. 2. Effect of neonatal treatment with monosodium glutamate (MSG) and vitamin D supplementation on body weight and food intake. Body weight (A) and food intake (C) were evaluated from 30 to 86 d and the respective AUC calculated (B and D). The arrow in (A) indicates the beginning of statistical difference (P < 0·05) between rats from the MSG and control groups. -▪-, Control non-supplemented (CON-NS); --□--, control supplemented with vitamin D (CON-VD); -•-, monosodium glutamate non-supplemented (MSG-NS); --○--, MSG supplemented with vitamin D (MSG-VD). Data are means (n 10–15 rats per group), with standard errors represented by vertical bars. a,b,c,d Letters above bars show statistical differences between groups by two-way ANOVA with Tukey post-test (P < 0·05). (a) CON-NS, (b) CON-VD, (c) MSG-NS and (d) MSG-VD.
At 76 d of age, rats were submitted to the OGTT (Fig. 3(A)). VD supplementation affected plasma glucose levels at 60 min (F 1,26 = 9·159; P = 0·0055) and 120 min (F 1,26 = 6·419; P = 0·0177) OGTT, where plasma glucose of CON-NS rats was lower than that of CON-VD rats at 60 min (P < 0·05). Neither VD nor MSG treatment significantly influenced glucose levels at other times during OGTT. The AUC of OGTT demonstrated an effect of VD supplementation (F 1,26 = 6·848; P = 0·0172) (Fig. 3(B)).
Fig. 3. Effect of neonatal treatment with monosodium glutamate (MSG) and chronic vitamin D supplementation on oral glucose tolerance test (OGTT). Glycaemic curve after glucose loading (2 g/kg body weight) (A) and AUC (B). -▪-, Control non-supplemented (CON-NS); --□--, control supplemented with vitamin D (CON-VD); -•-, monosodium glutamate non-supplemented (MSG-NS); --○--, MSG supplemented with vitamin D (MSG-VD). Data are means (n 6–9 rats per group), with standard errors represented by vertical bars. a,b,c,d Letters above connecting lines and bars show statistical differences between groups by two-way ANOVA with Tukey post-test (P < 0·05). (a) CON-NS, (b) CON-VD, (c) MSG-NS and (d) MSG-VD. * To convert glucose in mg/dl to mmol/l, multiply by 0·0555.
The effects of chronic VD supplementation on GIIS and the weight of endocrine pancreas are shown in Fig. 4(A) and (B)and the histological analysis is in Fig. 5(A)–(D). The weight of pancreas was affected by MSG treatment (F 1,47 = 5·284; P = 0·0260); however, in post-test the mean weight of pancreas did not differ between groups. Light microscopic analysis of pancreatic islets showed a typical organisation, with an exocrine component presenting lobules, connective tissue septa and ducts. The endocrine component, represented by pancreatic islets, is embedded within the pancreatic exocrine tissue. The pancreatic islets presented circular, oval or elongated shapes with a thin connective sheath surrounding each islet. Although the islet size was affected by the interaction between VD and MSG treatments (F 1,19 = 6·201; P = 0·0222), in the post-test the mean islet sizes of the groups was considered to be statistically similar.
Fig. 4. Effect of neonatal treatment with monosodium glutamate (MSG) and chronic vitamin D supplementation in endocrine pancreas. Weight of pancreas (A) and glucose-induced insulin secretion from isolated pancreatic islets at different glucose concentrations (5·6 and 8·3 mM of glucose) (B) are shown. CON-NS, control non-supplemented; CON-VD, control supplemented with vitamin D; MSG-NS, monosodium glutamate non-supplemented; MSG-VD, MSG supplemented with vitamin D. Data are means (n 5–6 rats per group), with standard errors represented by vertical bars. a,b,c,d Letters above bars show statistical differences between groups by two-way ANOVA with Tukey post-test (P < 0·05). (a) CON-NS, (b) CON-VD, (c) MSG-NS and (d) MSG-VD.
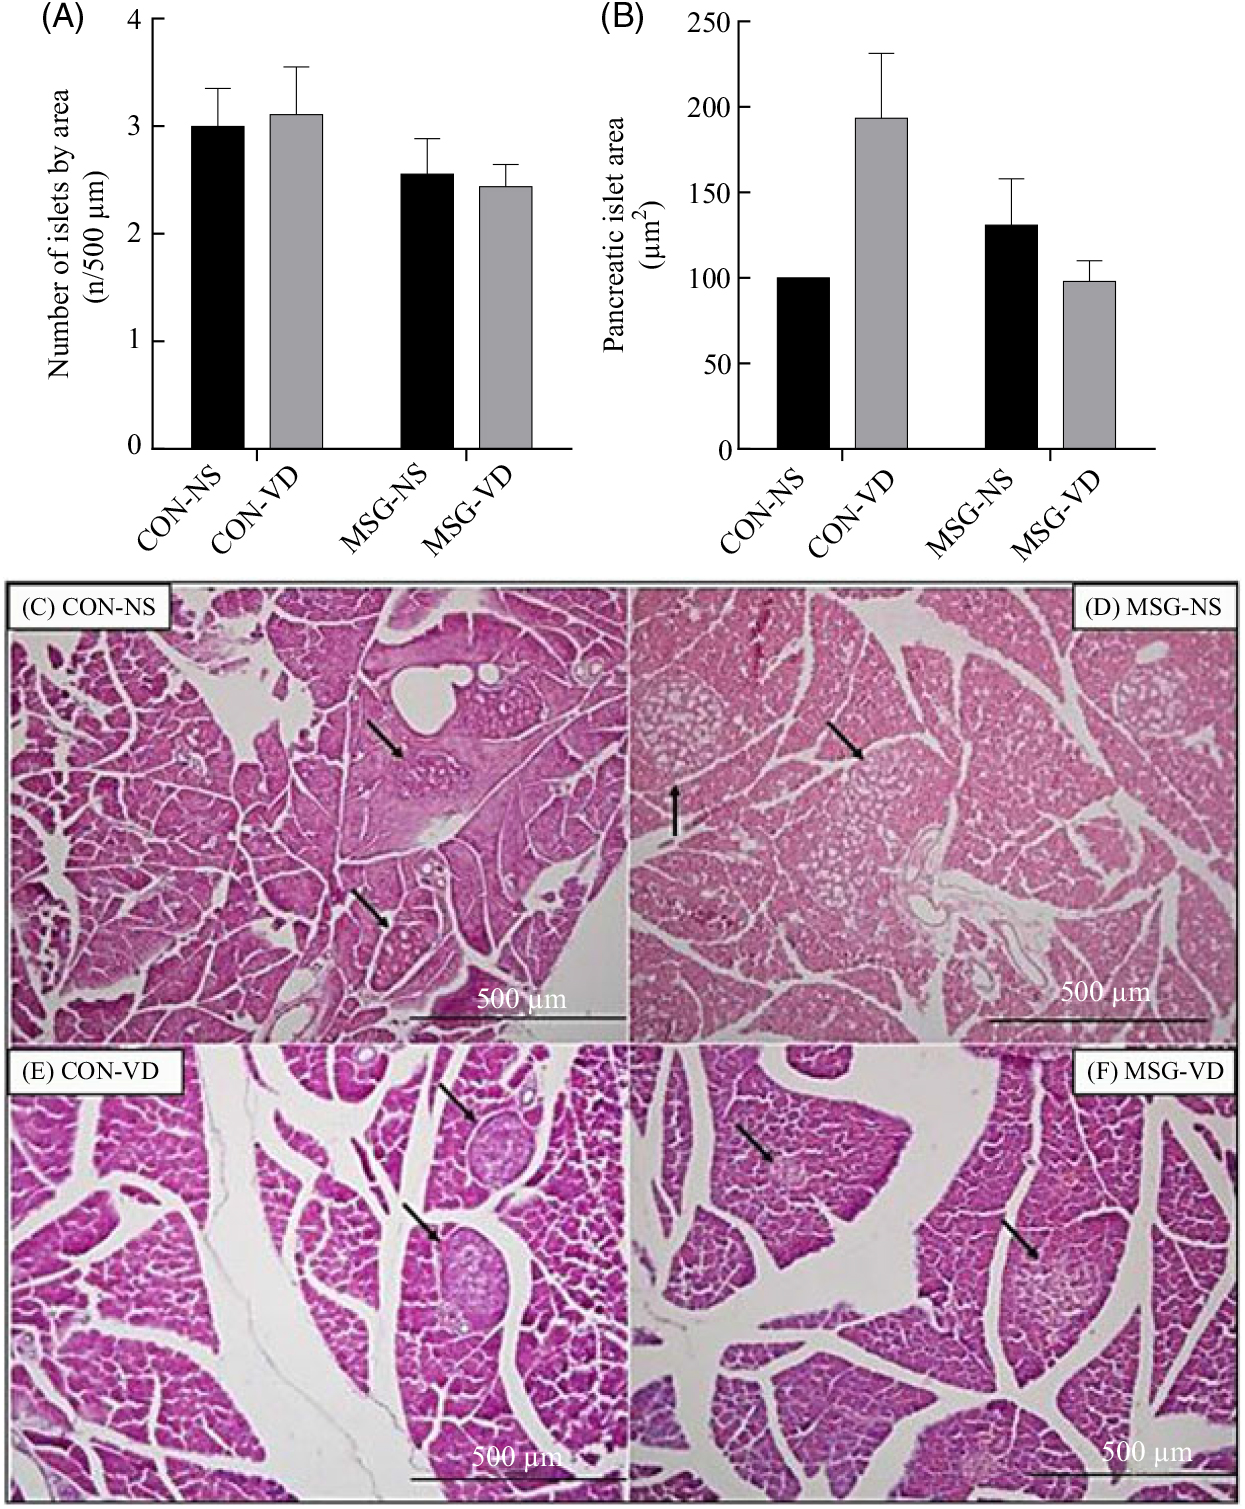
Fig. 5. Effect of neonatal treatment with monosodium glutamate (MSG) and chronic vitamin D supplementation on the endocrine pancreas. The number and mean size of pancreatic islets are represented in (A) and (B), respectively. Islet sizes were calculated by normalisation to the control non-supplemented (CON-NS) group. Representative photomicrography of pancreatic islets with haematoxylin and eosin stain, 10× magnification (C–F). Black arrows indicate pancreatic islets. CON-VD, control supplemented with vitamin D; MSG-NS, monosodium glutamate non-supplemented; MSG-VD, MSG supplemented with vitamin D. Data are means (n 4–6 rats per group), with standard errors represented by vertical bars, calculated through two-way ANOVA with Tukey post-test (P < 0·05).
The cholinergic agonist effect of carbachol (10 µM) on GIIS is shown in Fig. 6(A). The insulinotropic action of carbachol was influenced by the interaction between MSG treatment and VD supplementation (F 1,59 = 8·080; P = 0·0061). Thus, in pancreatic islets from MSG-VD rats, a reduced cholinergic effect was observed in relation to islets from MSG-NS and CON-VD groups (P < 0·05). However, neither MSG treatment nor VD supplementation significantly affected M3R (Fig. 6(B)) or PKA (Fig. 6(D)) expression in isolated pancreatic islets. Nevertheless, an effect of the interactions between MSG treatment and VD supplementation was observed on PKC expression in isolated pancreatic islets (F 1,12 = 6·303; P = 0·0274) (Fig. 6(C)), where PKC protein expression was significantly higher in islets of rats from MSG-NS, compared with islets from the CON-NS group (P < 0·05).
Fig. 6. Effect of neonatal chronic vitamin D supplementation on cholinergic response and protein expression in isolated pancreatic islets. Effect of neonatal chronic vitamin D supplementation on cholinergic response and protein expression in isolated pancreatic islets. Effect of carbachol (CCh) (10 µm) on glucose-induced insulin secretion (8·3 mm) is shown (A). mAchR3 (B), protein kinase Cα (PKCα) (C) and protein kinase Aα (PKAα) (D) protein expressions were obtained from isolated pancreatic islets. Results are expressed by the raw data obtained from the ratio of quantification of the protein of interest by the quantification of tubulin. CON-NS, control non-supplemented; CON-VD, control supplemented with vitamin D; MSG-NS, monosodium glutamate non-supplemented; MSG-VD, MSG supplemented with vitamin D. Data are means (n 4–6 rats per group), with standard errors represented by vertical bars. a,b,c,d Letters above bars show statistical differences between groups by two-way ANOVA with Tukey post-test (P < 0·05). (a) CON-NS, (b) CON-VD, (c) MSG-NS and (d) MSG-VD.
Discussion
The role of excessive WAT content is well recognised in the metabolic syndrome and diseases such as type 2 diabetes mellitus and CVD( Reference Jamka, Wozniewicz and Jeszkal 7 , Reference Wilcox 10 , Reference Alejandro, Gregg and Blandino-Rossano 11 ), a condition that could be related to low levels of VD( Reference Schuch, Garcia and Martini 1 , Reference Marcotorchino, Tourniaire and Astier 3 ). Several studies have evaluated the impact of VD supplementation on glucose and lipid homeostasis in rodents and humans( Reference Jamka, Wozniewicz and Jeszkal 7 , Reference Palomer, González-Clemente and Blanco-Vaca 12 , Reference Neelankal and Jiang 19 ), although the data reported are contradictory( Reference Pittas, Harris and Stark 15 – Reference de Boer, Tinker and Connelly 17 ). In the present study, we explored the effects of chronic supplementation with VD on the hypothalamic obesity induced by MSG neonatal treatment. Confirming previously published data( Reference Olney 24 , Reference Macho, Fickova and Jezova 25 ), in our study, MSG-treated rats presented higher adiposity, lower BW and growth as well as normophagia in adulthood. Augmented lipogenesis activity( Reference Balbo, Gravena and Bonfleur 27 ), hyperinsulinaemia( Reference Diemen, Trindade and Trindade 26 – Reference Lubaczeuski, Balbo and Ribeiro 28 ), lower growth hormone levels and neuronal hypothalamic rearrangements( Reference Olney 24 ) explain these profiles in the MSG obesity model. Herein, chronic VD supplementation (12 µg/kg during 55 d) did not affect visceral or subcutaneous WAT content in MSG-VD rats. In contrast, Marcotorchino et al. ( Reference Marcotorchino, Tourniaire and Astier 3 ) demonstrated that VD supplementation (375 μg/kg of food for 10 weeks) reduced obesity in high-fat diet (HFD)-obese mice. The VDR is present in WAT, and its activation by VD might exert regulatory effects on adipogenesis, lipid metabolism and inflammatory processes( Reference Calle, Maestro and García-Arencibia 14 , Reference El-Fakhri, McDevitta and Shaikh 44 ); however, inconsistent results regarding VD have been observed in several studies( Reference El-Fakhri, McDevitta and Shaikh 44 – Reference Lira, Rosa and Cunha 48 ). In 3T3/L1 pre-adipocytes, for example, VD inhibited adipogenesis( Reference Kong and Li 46 ), while enhanced lipid accumulation and increased expression of adipogenic marker genes were found in mesenchymal cells incubated with VD( Reference Mahajan and Stahl 47 ). In mice without VDR expression (VDR–/–), reduced WAT was reported( Reference Vangoitsenhoven, Wolden-Kirk and Lemaire 18 ). Recently, Jin et al.( Reference Jin, Cuia and Lia 49 ) demonstrated that VD, when administered subcutaneously (1 µg/kg) in MSG-obese rats, reduced WAT content and adipocyte size. Differences in plasma VD levels could explain these discrepant results( Reference Nobre, Lisboa and Carvalho 50 ). However, Jin et al. ( Reference Jin, Cuia and Lia 49 ) did not measure VD, or its active metabolite, in plasma. In the present study, we observed augmented levels of 1,25(OH)2D in supplemented rats, suggesting that oral administration was effective for elevating plasma VD levels.
In our study, we did not find any effect of chronic VD supplementation on BW gain or food intake in MSG-VD animals. Inconsistent effects of VD supplementation also were observed on these parameters. For example, VD supplementation in HFD-obese mice reduced food intake, weight gain and modulated the inflammatory response in the hippocampus and hypothalamus( Reference Farhangi, Nameni and Mesgari-Abbasi 51 ). In contrast, in VDR–/– mice, reduced BW was observed, in association with normophagia( Reference Wong, Szeto and Zhang 52 ). The arcuate nucleus (ARC) has an important role in the neural control of food intake and energetic metabolism( Reference Diemen, Trindade and Trindade 26 ). MSG-obese rats presented damage in the ARC neurons( Reference Olney 24 ), which would prevent a central hypothalamic action of VD.
Dyslipidaemia, hyperinsulinaemia and IR, which are metabolic characteristics of MSG-treated rats( Reference Olney 24 – Reference Diemen, Trindade and Trindade 26 ), were reproduced in MSG-obese rats in the present study. VD modulates the expression of insulin receptors in peripheral tissues, such as skeletal muscle and WAT and also affects insulin sensitivity( Reference Mitri, Dawson-Hughes and Hu 53 – Reference Sadeghi, Wessner and Laggner 57 ). In our study, chronic VD supplementation in MSG-obese rats effectively normalised TAG and plasma insulin levels, and improved IR. Similar results were recently reported by Jin et al.( Reference Jin, Cuia and Lia 49 ) using intraperitoneal VD administration in MSG-obese rats. VD supplementation also improved the metabolic profile in HFD-obese mice and in LDL receptor knockout mice ( Reference Kheder, Hobbirk and Saeed 8 ). The association between VD and lipid profiles, including TAG, was demonstrated in a longitudinal study by Jorde et al.( Reference Jorde, Fingenschau and Hutchinson 55 ). In the present study, we noted that MSG-VD rats also presented high cholesterol levels, a response that could be related to differing effects of VD on the LDL and HDL-cholesterol subfractions, as already reported( Reference Jorde, Fingenschau and Hutchinson 55 ). However, Jin et al.( Reference Jin, Cuia and Lia 49 ) found no difference in LDL and HDL levels in MSG rats receiving intraperitoneal VD.
VD supplementation can improve hepatic lipid metabolism( Reference Nobre, Lisboa and Carvalho 50 , Reference Sassi, Tamone and D’Amelio 56 ). Here, using HOMA-IR, we observed that MSG-VD rats presented augmented insulin sensibility. As HOMA-IR appears to be a better indicator of hepatic IR( Reference Antunes, Elkfury and Jornada 40 ), it is possible that VD supplementation improved hepatic function contributing to better insulin responsiveness and, consequently, reduced TAG levels. Moreover, adequate VD status is also related to glucose homeostasis and β-cell function( Reference Schneider, Schedl and McCain 58 – Reference Forouhi, Luan and Cooper 62 ). In the present study, oral VD supplementation did not alter either fasting plasma glucose or oral glucose tolerance. Similarly, glucose tolerance did not change in VDR–/– ( Reference Vangoitsenhoven, Wolden-Kirk and Lemaire 18 ) and VD-deficient mice( Reference Zeitz, Weber and Soegiarto 5 ). In contrast, in type 2 diabetes mellitus patients with VD deficiency, the daily intake of a VD-fortified yogurt drink increased serum VD levels and improved glycaemic status( Reference Nikooyeh, Neyestani and Farvid 61 ). Despite no changes in glucose tolerance, MSG-VD rats had reduced insulin plasmatic levels, suggesting an effect on the endocrine pancreas. In rats, VD deficiency impaired insulin release from the pancreas and reduced glucose tolerance, and these alterations were alleviated by VD supplementation( Reference Lahbib, Ghodbane and Louchami 13 ). Moreover, in humans at a high risk of diabetes, cholecalciferol (50 μg daily) supplementation for 16 weeks improved pancreatic β-cell function( Reference Mitri, Dawson-Hughes and Hu 53 ). However, in the present study, neither GIIS nor islet number or size were significantly affected by VD supplementation in MSG-obese rats. Similarly, VDR–/– mice maintained in normocalcaemia demonstrated no alterations in GIIS and islet morphology( Reference Zeitz, Weber and Soegiarto 5 ). A recent study showed that MIN6 cultured in high glucose for a longer time presented reduced VDR expression( Reference Gysemans, Cardozo and Callewaert 20 ). In this study, the activation of VDR by VD did not significantly alter GIIS, either in MIN6 cells or in isolated pancreatic islets from db/db mice, but increased insulin expression was observed( Reference Gysemans, Cardozo and Callewaert 20 ). In contrast, VD supplementation in type 1 diabetes mellitus (T1DM) rats increased insulin secretion and VDR expression in isolated pancreatic islets( Reference Zeitz, Weber and Soegiarto 5 , Reference Sadek and Shaheen 33 ). Ach is the main insulinotropic agent in the pancreatic β-cell; as such, changes in cholinergic responsiveness are involved in insulin hypersecretion in several models of obesity, including MSG-obese rats( Reference Diemen, Trindade and Trindade 26 – Reference Lubaczeuski, Balbo and Ribeiro 28 ). The M3R subtype and its downstream pathways, particularly the PKC protein, are mainly responsible for the cholinergic effect in pancreatic β-cells( Reference Miranda, Agostinho and Trevenzoli 22 ). Here, we found that islets from MSG-VD rats presented reductions in the cholinergic insulinotropic effect without changes in M3R and PKC protein expressions. In contrast, Kumar et al.( Reference Kumar, Sherin and Mohan 23 ) demonstrated that VD supplementation in the T1DM model restored M3R in the endocrine pancreas. VD also appeared to regulate the expression of phosphodiesterase enzymes in pancreatic islets, which( Reference Vangoitsenhoven, Wolden-Kirk and Lemaire 18 ) are important regulators of AMPc and, consequently, PKA activity( Reference Vangoitsenhoven, Wolden-Kirk and Lemaire 18 ). However, in our study, we did not observe alterations in PKA expression in isolated pancreatic islets from MSG-VD supplemented rats. Interestingly, Ach, via the M2R subtype, exerted paradoxical inhibitory insulinotropic effects on islets from MSG-obese rats( Reference Miranda, Agostinho and Trevenzoli 22 ). Thus, the effects of VD on other MR subtypes or pathways cannot be discarded. Taken together, these data suggest that the previous functional state of β-cell could determine the effects of VD on GIIS and cholinergic responses.
It is well established that the response to VD supplementation is dependent upon baseline VD concentrations( Reference Percegoni and Castro 4 ). In the present study, no alterations in 25(OH)D levels were found in MSG-treated rats. However, it is important to recognise that 1,25(OH)2D is the primary biologically active form of this hormone. As demonstrated by Parisi et al.( Reference Parisi, Bozic and Ibarz 63 ) an increase in renal glutamate levels could be involved in a decrease in renal 1α-hydroxylase activity and, therefore, a decrease in 1,25(OH)2D levels. Moreover, in the present study, MSG-VD rats presented high Ca levels, without modifications in P concentration, a response also found in patients with chronic renal disease receiving VD( Reference Dou, Yang and Gan 64 ). Interestingly, MSG-treated rats might have renal dysfunctions( Reference Boušová, Košt’áková and Matoušková 65 ), but the renal manipulations of Ca and P in this obese model are unknown. Additionally, MSG-obese rats might present high plasma cortisol and leptin levels, which could attenuate the actions of VD( Reference Nobre, Lisboa and Carvalho 50 ).
In conclusion, our results indicate that chronic VD supplementation in MSG-obese rats reduced hypertriacylglycerolaemia, corrected hyperinsulinaemia and improved insulin sensibility without changing WAT content or GIIS from isolated pancreatic islets. However, the reduced insulinotropic cholinergic effect found in the pancreatic islets of MSG-VD rats may contribute to lower plasma insulin levels, an effect that is not directly related to changes in M3R expression or its downstream pathways.
Acknowledgements
This study forms part of the MSc thesis of Z. M. G. who received a scholarship from Coordination of Superior Level Staff Improvement (CAPES), Brazil. We thank Campinas State University (UNICAMP), São Paulo, Brazil, for insulin dosage; and São Lucas Laboratory Hospital, Parana, Brazil, for biochemical dosage.
This research received no specific grant from any funding agency, commercial or not-for-profit sectors.
Author contributions were: Z. M. G., A. C. V., B. K. A., V. M. C., P. H., D. W. d. S., T. A. d. S. – acquisition, analysis and interpretation of data. T. N. and H. R. d. O. E. – Western blotting and interpretation of data. S. G. – study design, data analysis and interpretation, article writing, critical review of relevant intellectual content. All authors approved the submitted version.
There were no conflicts of interest.


