


Introduction
Cryo-electron tomography (cryo-ET) is a powerful microscopy technique that can reveal details in biomolecular interaction in the near-native cellular environment at a nanometer scale [Reference Grange1]. Cryo-ET uses a transmission electron microscope (TEM) to acquire a series of 2D images at different tilt angles and 3D reconstruction to provide detailed structural information of biomolecules. To resolve the 3D structures of the protein complex at a high resolution, 1000–2000 copies of the protein complex need to be averaged [Reference Chen2]. This process is called subtomogram averaging. Due to the need for the high number of copies, a high data throughput is desirable. While single particle analysis requires the protein of interest to be purified, in situ cryo-ET can offer novel insight into the biomolecular structure and protein-protein interaction within the cell.
Cryo-ET has already been applied to the fields of structural biology, microbiology, and virology [Reference Wrapp3,Reference Wolff4]. Its ability to reveal information at a sub-organelle level has led to a better understanding of cell biology, molecular physiology, and disease manifestations [Reference Wolff4–Reference Wang8]. This kind of information can help in the development of targeted treatments and preventative measures for a variety of diseases [Reference Cao9]. Despite the powerful insight it can offer, the adoption of in situ cryo-ET is hampered by difficulty in obtaining good quality samples suitable for tomogram acquisition in the TEM.
TEM imaging requires the sample thickness to be around 150–300 nm. Using a focused ion beam (FIB), typically combined with a scanning electron microscope (SEM), thin electron transparent sections called lamellae can be prepared from cryogenic samples. A few major challenges in the cryo-ET sample preparation process exist. First, once flash-frozen, the samples need to remain vitrified throughout the cryo-ET workflow. Second, crystalline and amorphous ice may form on the samples during sample preparation and inter-device transfers, respectively, due to the moisture in the atmosphere. Third, the molecules of interest may be absent from the thin lamella due to unsuccessful targeting. Last, but not least, an amorphous ice layer may form on the lamella inside the cryo-FIB/SEM due to the residual moisture inside the SEM chamber [Reference Tacke10].
While ice particles on the lamella can obscure the region of interest (ROI), amorphous ice layers can decrease the contrast of the TEM images and thereby data quality. To our knowledge, a large extensive survey on the ice contamination issue in cryo-electron microscopy (cryo-EM) has not been published. To further pinpoint the areas needing the most improvement to create the largest impact, we conducted a survey and invited cryo-EM users worldwide to participate.
Methods and Materials
We designed a survey with 10 questions concerning ice contamination issues experienced in the cryo-ET workflow. We invited cryo-EM users from around the world to fill out the survey. The invitations were sent out by email, distributed through relevant cryo-EM network mailing lists, and posted on social media platforms including Linkedin, Twitter, and WeChat. Answers from participants who completed the survey were compiled. Where appropriate, a weighted average was calculated.
Results
Amongst the cryo-EM users who participated in the survey, the answers from 84 participants who completed the survey were compiled. The participants came from 16 countries across Europe, North America, and Asia.
We first surveyed the type of cryo-microscopy equipment the participants used in their laboratories. About 35% percent of the participants used a cryo-TEM, 28% used a cryo-FIB/SEM, 19% used a cryogenic fluorescence light microscope (FLM), and 18% used a low humidity room (Figure 1A). As shown in the Venn diagram (Figure 1B), not all cryo-TEM, cryo-FIB/SEM, and cryo-FLM owners used a low humidity room. Less than half (49%) of the cryo-FIB/SEM owners used a low humidity room.

Figure 1: Results of the Ice Contamination Survey to the question “What equipment do you use in your cryo-ET workflow?” presented as A) a pie chart and B) a Venn diagram. FLM, fluorescence light microscopy; TEM, transmission electron microscopy; FIB/SEM, focused ion beam/scanning electron microscope.
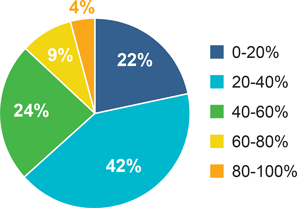
Next, we asked the participants to estimate the percent of their cryo-EM samples that were ice-contaminated. Forty-one percent of the participants answered 20–40% of their samples had ice contamination (Figure 2). The weighted average was 36.3%.
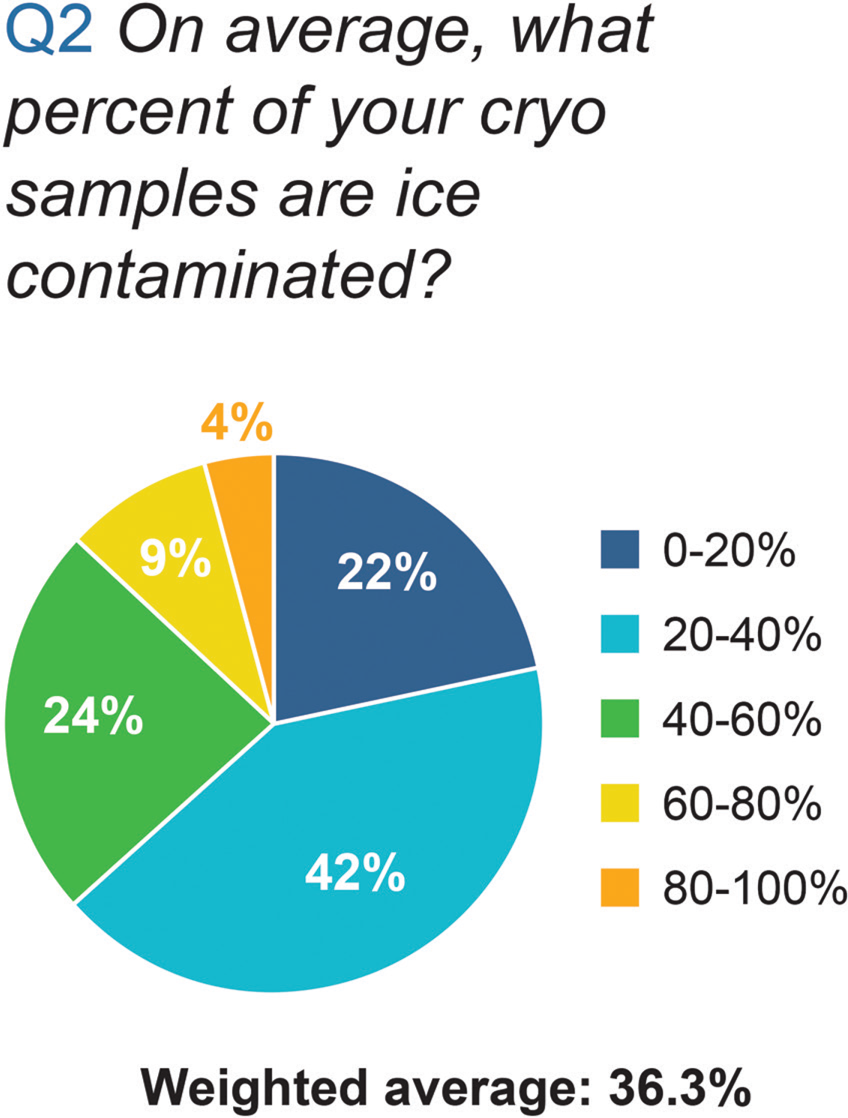
Figure 2: Results of the Ice Contamination Survey to the question “On average, what percent of your cryo samples are ice contaminated?”
Next, we sought to understand to what extent of the lamellae used for tomogram acquisition were ice-contaminated. It was estimated that a weighted average of 43.2% of samples had some form of ice contamination and a weighted average of 33.2% of the lamellae had more than 50% ice-contaminated area (Figure 3). A weighted average of 27.9% of lamellae were rendered useless due to ice contamination (Figure 4).

Figure 3: A. Results of the Ice Contamination Survey to the question “What percentage of the lamellae you use for tomogram acquisition have some form of ice contamination?” B. Results of the Ice Contamination Survey to the question “What percentage of the lamellae you use for tomogram acquisition have more than 50% unusable area?”

Figure 4: Results of the Ice Contamination Survey to the question “On average, what percent of your lamellae are rendered useless due to ice contamination?”
We then asked the participants at what stage of the cryo-ET workflow did they normally notice their samples were ice-contaminated. Thirty-six percent of the participants noticed ice contamination on their samples in the cryo-FIB/SEM, while 39% of the participants noticed it in the cryo-TEM, the last stage of the workflow (Figure 5).

Figure 5: Results of the Ice Contamination Survey to the question “At what point of the cryo-ET workflow do you realize the samples are ice contaminated?”
Ice contamination impacted the research of the cryo-EM users quite evenly across the board. The impacts were: decreased sample throughput, decreased sample yield, reduction in the quality of the tomograms, rendering their lamellae useless, and increased lamella preparation time (Figure 6).

Figure 6: Results of the Ice Contamination Survey to the question “How does ice contamination impact your research?”
The participants found different stages of the cryo-ET workflow problematic. Forty-four percent of the participants found the transfer stages problematic (combined transfer from cryo-FLM to cryo-FIB/SEM and transfer between cryo-FIB/SEM and cryo-TEM). Seventeen percent of the participants found the FIB milling stage problematic, while 11% of the participants found the cryo-FLM stage problematic (Figure 7).

Figure 7: Results of the Ice Contamination Survey to the question “Which stage of the lamella preparation process is particularly problematic for you?” FIB, focused ion beam; SEM, scanning electron microscope.
The participants encountered a range of problems with their cryo-EM samples. They experienced ice contamination on the sample before FIB milling, “curtaining,” “leopard ice,” non-vitreous ice in their samples, ice crystals on top of the milled lamella, amorphous ice layer on the lamella, and cracked lamellae (Figure 8).

Figure 8: Results of the Ice Contamination Survey to the question “Which of these problems have you encountered?”
Discussion
Our results show that ice contamination is a profound issue for a significant proportion of the cryo-EM users across the globe. Although the degree of damage varied among the participants, according to the weighted average, almost a third of the samples were rendered useless due to contamination and damage. It is unfortunate that the majority of users only found out samples were contaminated at the very last stage of the cryo-ET workflow, that is, in the TEM. Looking at the stages users find problematic, we can sort the ice contamination into 1) sample mounting, 2) sample transfer, 3) cryo-FLM, and 4) lamella preparation categories.
Sample mounting and sample transfer-associated ice contamination
Crystalline ice contamination can form on the sample during sample mounting and sample transfer due to moisture in the atmosphere, which was experienced by 18% of our survey participants (Figure 8). Currently, users typically perform AutoGrid assembly (known as C-clipping), shuttle or sample holder loading, and Autoloader cassette loading in a liquid nitrogen (LN2)-filled bench-top preparation station open to the atmosphere in the room. Despite protection by the nitrogen vapor, moisture in the air can condense in the LN2 and form crystalline ice particles on the sample. Some laboratories are equipped with a low humidity room to reduce ice contamination during sample preparation. It is, however, not 100% effective, since low humidity rooms are not completely without moisture. Moreover, according to our survey, less than 20% of the laboratories are equipped with a low humidity room.
When users transfer samples from one device to another, the commonly used transfer devices operate at a low vacuum (around 1 × 10⁻² to 1 × 10⁻³ mbar), and the residual moisture in the device can condense on the vitrified sample surface and form amorphous ice contamination. An overwhelming 44% of our survey participants found transfer steps problematic. During the transfer, the sample can also devitrify if it is not kept below -140˚C. The devitrification issue affected 15% of our survey participants.
How do crystalline ice contamination and devitrification affect cryo-ET data quality? Cryogenic samples are typically coated with a thin layer of platinum for protection from ion beam damage prior to lamella milling. The crystalline ice particles can lead to an uneven platinum deposition, resulting in an artifact known as curtaining, which was experienced by 16% of our survey participants (Figure 8). If the ice particles detach from the sample, they leave unprotected spots, which result in lower-quality lamellae and lower TEM image quality. Ice crystals on the lamellae and devitrification obscure the ROI in the TEM, thereby preventing collection of useful data [Reference Tacke10].
To mitigate the sample-mounting ice contamination issues, Tacke et al. designed a glovebox (GB) to minimize sample mounting-related ice contamination [Reference Tacke10]. Their GB is purged with dry nitrogen gas and thereby prevents moisture condensation on the cryogenic samples. The GB is equipped with a LN2-filled preparation table with C-clipping, shuttle, and cassette loading modules. The user can slide the table on a rail to position the appropriate module in front of the user for ease of use. The rubber gloves are holed and allow for the users’ fingers to protrude through to retain the full agility needed for manipulating delicate samples. To mitigate the transfer-related ice contamination issues, Tacke et al. fitted their GB with a load lock, to which a high-vacuum cryo transfer (HVCT) can be docked. The sample can be transferred from the preparation table into the HVCT without exposure to humid air, and the HVCT can be pumped to high vacuum (1 × 10⁻⁶ mbar) and thereby extremely low moisture. The HVCT sample chamber wall is furthermore cooled by LN2 to keep the sample vitrified during transfer. Using both their GB and HVCT, Tacke et al. demonstrated a decrease from 20% crystal ice contamination to 9% [Reference Tacke10]—more than 2-fold better. In 2021, Delmic Cryo B.V. (Delft, The Netherlands) commercialized the GB and HVCT as the CERES Clean Station and CERES Vitri-Lock, respectively.
Cryo-FLM-associated ice contamination
Cryo-FLM imaging can be used to identify the sample ROIs that are fluorescently labeled and improve lamella targeting. However, 32% of our survey participants pointed to the cryo-FLM steps being problematic. Until recently, fluorescence-guided lamella targeting was done by cryo-FLM imaging of the sample in a stand-alone cryo-FLM equipped with a cryogenic stage, and subsequent transfer of the sample to a cryo-FIB/SEM for lamella milling. This practice risked increasing ice contamination on the samples due to the extra transfer steps added to the workflow. Moreover, the samples were imaged at ambient pressure, further presenting opportunities for ice contamination.
Gorelick et al. demonstrated an in situ cryo-correlative light and electron microscopy (cryo-CLEM) workflow by integrating a FLM into a cryo-FIB/SEM [Reference Gorelick11]. In situ cryo-FLM reduces ice contamination associated with the transfer steps and imaging at ambient pressure and enables a more streamlined CLEM process as the same sample stage is used. In October 2020, Delmic Cryo B.V. (Delft, Netherlands) launched METEOR [Reference Smeets12], the first commercially available cryo-FLM, which can be integrated with Thermo Fisher Scientific, Zeiss, and Tescan cryo-FIB/SEMs to help cryo-ET users achieve better sample yields. Since 2021, another commercial cryo-FLM called the iFLM has also become available for the TFS Aquilos™ 2 cryo-FIB.
Lamella preparation-associated ice contamination
While the cryo-FIB/SEM chamber typically operates at a high vacuum (around 1 × 10⁻⁷ mbar) and the level of moisture in the SEM chamber is very low, the residual moisture in the chamber can still form amorphous ice layers. The ice contamination rates reported in the literature [Reference Tacke10] and by our survey participants are around 30 to 50 nm H-1. Lamellae are typically rough-milled to around 500–800 nm, after which they are polished to 150–300 nm. During a lamella milling session, the lamellae may be in the chamber for several hours during the polishing session. The amorphous ice layers decrease TEM image contrast, resulting in significant data degradation, and limit the number of lamellae that can be prepared in one session.
Tacke et al. developed a method to minimize amorphous ice growth on the sample. The method involves using a LN2-cooled cryo-shutter inserted between the SEM column and the sample [Reference Tacke10]. The cryo-shutter type II described in their publication features a hole of 1 mm diameter, through which the FIB can mill the lamellae. At the same time, the cryo-shutter protects the sample from the direct line of sight of the SEM column, which is a source of ice contamination. The LN2 cooling provides a cryo pumping effect and lowers the partial pressure of water in the sample vicinity to 4 × 10⁻⁹ mbar [Reference Tacke10]. The type II cryo-shutter design successfully eliminated the amorphous ice growth in the SEM such that the ice growth became undetectable [Reference Tacke10]. Delmic Cryo B.V. has commercialized this cryo-shutter type II into the CERES Ice Shield.
Conclusion
The current low sample yield means a lot of precious time and samples are wasted. It also means it takes longer for users to generate sufficient high-quality data to arrive at an answer to their biological question. Since cryo-ET has the potential to accelerate our understanding of diseases and the development of drug treatments, resolving the ice contamination issues can create a very positive impact on biomedical advances. Furthermore, not only does the current low cryo-ET sample yield lead to significant amounts of waste, the public funds used for biomedical research are spent ineffectively. The impact on healthcare, the environment, and society points toward the need for a drastic reduction in ice contamination during the cryo-ET workflow.
The recent technological improvements [Reference Tacke10,Reference Gorelick11] and new commercially available solutions, for example, Delmic CERES Clean Station, Vitri-Lock and Ice Shield, Delmic METEOR, and TFS iFLM (summarized in Table 1) address some of the ice contamination issues in the cryo-ET workflow. There are, of course, still areas in the workflow where improvement is needed, for example, effective sample vitrification. When the major bottlenecks in the cryo-ET workflow are overcome, the true potential of cryo-ET for biomedical research and drug development will undoubtedly be revealed.
Table 1: A summary of the ice contamination issues studied in our survey, the conventional cryo-ET practices, and the solutions targeting the cryo-ET ice contamination issues that were recently made commercially available.

Acknowledgements
The Ice Contamination Survey work was supported by Eurostars grant number E13008 - CETFlow.


