


Introduction
One of the major impacts of human activity in Antarctica comes from the operation of the 91 stations, laboratories and camps in Antarctica, referred to as ‘facilities’ in this paper. They provide accommodation capacity for over 4000 people in the summer and 1000 people in the winter (Wolf Reference Wolf2015) and rely heavily on fossil fuels for power generation and transportation. However, supplying fuels to Antarctica is not only expensive but also dangerous, as the risk of oil spills and fires (ASOC 2009) presents a safety hazard with potential long-term environmental consequences.
The 2015 Paris Agreement and the more recent commitments to reach net-zero emissions by 2050 have highlighted the urgency to phase out fossil fuels and decarbonize the global energy system. Antarctica should be no exception, especially considering the costs and risks of using fossil fuels. Without underplaying the relevance of decarbonizing other Antarctic operations (air cargo, shipping, tourism, fishing), the objective of this paper is to offer data and insights on the deployment of renewable energy to phase out fossil fuels in power generation at Antarctic stations and to support initiatives aimed at raising ambition and showing leadership in decarbonization. It does so by 1) summarizing the literature available on the topic, 2) mapping and identifying renewable energy sources currently deployed at Antarctic facilities in an interactive database (the first tool of its kind to cover the Antarctic continent) and 3) reporting on the lessons learnt from the deployment of renewable energy systems in Antarctic facilities.
By collecting the latest data available on renewable energy deployment in Antarctic stations, this article provides a snapshot of the progress towards fossil fuel-free facilities in the Antarctic, complementing the data published in the Council of Managers of National Antarctic Programs (COMNAP) Antarctic Station Catalogue (COMNAP 2017). In addition, a section on lessons learnt discusses cost/benefits and trade-offs, the efficiency of renewables in Antarctica, the available technology, the impact of operating under extreme weather conditions and the different experiences at the stations, with the aim of contributing to the understanding of the benefits of and challenges facing future initiatives.
Overview: renewable energy in Antarctica
Since the signing of the Protocol on Environmental Protection to the Antarctic Treaty in 1991 and its entry into force in 1998, the importance of protecting Antarctica as a natural reserve devoted to peace and science has increased. The Protocol introduced requirements to reduce the impact of activities in Antarctica. Its entry into force included requirements for stations to prevent the introduction of non-native species (including the removal of all sled dogs from Antarctica), to improve waste and waste water management practices and to minimize impacts on the environment as far as practical, which may include upgrading energy facilities (Ortúzar Reference Ortúzar2020).
Despite improvements in the last two decades, the predominant source of electricity and heat generation comes from fossil fuels, mainly Antarctic diesel. Electricity is obtained through the use of internal combustion engines and induction generators, which have the advantage of being efficient, stable and consistent as sources of energy independently of weather conditions, unlike renewable sources. Moreover, they are well-known technologies, easy to maintain from a mechanical standpoint, have a long useful life and, given their widespread availability, backup units can be made available in the event of failure or maintenance (see Fairfax et al. Reference Fairfax, Dowling and Weidknecht2019, Ruberto et al. Reference Ruberto, Álvarez, Massot and Mac Cormack2020). However, the fossil fuel-dependent energy matrix has several problems. First, transporting Antarctic diesel requires a logistical apparatus with significant transportation costs, which in some cases even triples the purchase value (Olivier et al. Reference Olivier, Harms and Esterhuyse2008, de Christo et al. Reference de Christo, Fardin, Simonetti, Encarnação and de Alvarez2016). Second, the risk of major environmental accidents in transporting the fuel is considerable. The ARA Bahía Paraíso disaster in 1989 (Kennicutt et al. Reference Kennicutt, Sweet, Fraser, Stockton and Culver1991), the Patriarche in 2001 and the Explorer in 2007 (Ruoppolo et al. Reference Ruoppolo, Woehler, Morgan and Clumpner2013), among several others, produced long-term environmental damage to the Antarctic ecosystem. The case of the Brazilian station where a fuel leak started a fire that destroyed 70% of the station and killed two navy personnel is another example of the risks associated with the fossil fuel-based energy systems (Guerra Reference Guerra, Neto, Prianti, Pereira-Filho and Schaefer2013). Third, fuel spills have a long-term effect on the Antarctic ecosystems because of their slow degradation (Margesin & Schinner Reference Margesin and Schinner1999). Furthermore, uncontained spills may run off or leach towards the coast, affecting the fauna that occupies that coastal zone, or end up in the sea, where damages are more difficult to mitigate (Roura Reference Roura2004). Fourth, even though the emissions that contribute to global warming from Antarctic stations are negligible (Climate Watch 2022), there is a moral obligation that the continent where most of the climate change research is carried out becomes an example in this field.
The most implemented policy to reduce the use of hydrocarbons has been the introduction of energy efficiency measures (Tin et al. Reference Tin, Sovacool, Blake, Magill, El Naggar and Lidstrom2010). Technological improvements expand the scope of alternatives capable of increasing efficiency, from providing better and highly insulated materials, more intelligent energy and monitoring systems to developing better modelling and designs of the buildings in general. A study carried out by Tian et al. (Reference Tian, Fu, Niu, Sun and Huang2020) found that an optimized operation strategy, compared with the original operation strategy of the system, has an 11.8% energy saving space, and the total diesel consumption of the system can be reduced by 9.6% per year in an Antarctic station. In 2009, the Belgian Princess Elisabeth Station was inaugurated with the most modern techniques in energy efficiency. The station's insulation, orientation and window disposition allow it to maintain the temperature inside the building with little energy input. The electrical system of the station is managed by an intelligent central unit ensuring that living conditions inside the station are optimized with minimal resource consumption (Amin Reference Amin2015). Energy efficiency measures have also been implemented for temporary and remote expeditions. For example, a self-sustained, zero carbon emission module that resembles a modern ‘yurt’ has been successfully tested on Antarctic ground and appears to be an effective alternative for scientists to use during temporary expeditions instead of tents (Cantuária et al. Reference Cantuária, Marques, Pinelo Silva and Guedes2017).
Renewable energy sources such as solar, wind and hydrogen are among the most explored alternatives to reduce the overall fuel consumption and emissions of research stations in the Antarctic. Antarctica is the continent with the most abundant and constant wind resource; therefore, it is not surprising that the first experiments with renewable energy started with the introduction of wind turbine prototypes in the mid-1980s. However, it was not until 1991 that the first vertical axis 10 m diameter H rotor ‘HMW-56’ turbine (three blades, rated 20 kW at 9 m/s) was installed at the German Neumayer Station (Coleman Reference Coleman and Sodhi1991). The turbine had a survival wind speed of 68 m/s and could operate down to a minimum temperature of −55°C. In 2003, the Australian Antarctic Division (AAD) worked in conjunction with the German turbine manufacturer Enercon and the Australian company Powercorp to develop three modified 300 kW wind turbines (Enercon E-30) for the Australian Mawson Station (AAD 2016). The wind power system can currently provide up to 95% of the station's energy requirements. In 2009, Princess Elisabeth Station incorporated nine wind turbines that can close down in the event of a strong storm, thus reducing their rotating speed in order to prevent damage to the wind turbine (International Polar Foundation 2021). The Ross Island Wind Energy (RIWE) project, a joint venture between the US McMurdo Station and New Zealand's Scott Base, resulted from the construction of a three-turbine wind farm on Crater Hill in Ross Island (New Zealand & USA 2010). The 1 MW wind farm employs three Enercon E-33 wind turbines, each with a capacity of 0.33 MW (AntarcticaNZ n.d.). The construction of the wind farm began in November 2008 and the first turbine of the wind farm became operational in December 2009 (Meridian Energy n.d.).
Solar energy has also become prevalent in Antarctic operations in the last decade. This type of energy was mainly introduced either to complement wind energy or in summer bases, summer shelters and on expedition equipment that can be powered by solar energy (radios, very-high-frequency (VHF) repeaters). Despite the fact that during the Antarctic summer the sun is shining most of the day, the solar irradiation could still be low as clear skies are only frequent in specific parts of Antarctica (Steel & Guichard Reference Steel and Guichard1993). Cloud coverage is characterized by a U-shaped distribution at latitude 60°S in Antarctica, with total or no cloud coverage. In areas where there is no cloud cover, insolation rates at continental stations are extremely high due to a combination of high albedo values due to snow cover, a lack of moisture in the pristine, dry, dust-free air above the continent and a clear atmosphere characteristic of sparsely populated areas (Brown et al. Reference Brown, Guichard and Lyons1997). However, photovoltaic (PV) capture at high latitudes can be interrupted by the accumulation of snow or ice; therefore, a portion of the solar energy must first be used to melt the snow. In addition, the frequent snowfalls (even in summer) and the intermittence of direct sunshine represent some major drawbacks. To solve these problems, instead of the most commonly used horizontal installation of solar panels, many stations are opting for vertical or dynamic installations based on the fact that the higher the latitude, the lower the solar altitude, which in many cases results in extra solar gain due to the surroundings' albedo (Cabezas et al. Reference Cabezas, Wolfram, Franco and Fasoli2017). In addition, the path of the sun covers a much wider angle between spring and autumn, so any horizontal installation loses access to much of the availability of this resource (de Christo et al. Reference de Christo, Fardin, Simonetti, Encarnação and de Alvarez2016). One of the first uses of solar energy in Antarctica was to heat water and melt ice. As solar PV panels became more efficient and cheaper, they began to be incorporated into the production of electricity in Antarctica. For example, Wasa Station (Sweden) uses solar energy to provide both heating and electricity. Princess Elisabeth Station originally incorporated thermal and solar PV panels to complement the electricity produced by wind turbines. In addition to the use solar energy in Antarctic stations, there are also prototypes of robots and vehicles that are powered using solar energy from the solar reflection in the snow, which can help to reduce fuel consumption significantly during the summer months, when most research and operations are carried out (Lever et al. Reference Lever, Ray, Streeter and Price2006).
Other more unconventional sources of renewable energy have also been tested but have proved to be insufficient and not adequate. For example, in a study conducted at Winter Quarters Bay, McMurdo Sound (West et al. Reference West, Gagnon and Wosnik2016), researchers analysed the potential of tidal energy as an alternative to the other renewable energy sources already implemented at McMurdo Station. They found that even with incomplete year-round data, the average tidal speed is too low to be considered, barely reaching the cut values in most tidal electricity generators. de Christo et al. (Reference de Christo, Fardin, Simonetti, Encarnação and de Alvarez2016) explored the potential of turning solid waste into energy at the Brazilian Comandante Ferraz Antarctic Station, but the energy gains were negligible due to the low volumes of solid waste available.
Many national Antarctic programmes (NAPs) have adopted hybrid systems combining fossil fuels and renewable energy sources, with a preference for solar or wind depending on the specific location of the research station and previous experiences with certain technologies. Such is the case in a study conducted in the seasonally operated Czech Johann Gregor Mendel Antarctic Station. Based on previous negative experiences with wind turbines breaking up soon after deployment due to harsh weather conditions, the researchers favoured a higher share of PVs with energy control and energy storage systems (Cabezas et al. Reference Cabezas, Wolfram, Franco and Fasoli2017). The facility has a hybrid system (diesel 26%, solar PVs 68% and wind 6%) where, according to further research (Wolf Reference Wolf2015), on 11 out of 24 inspected days the renewable energy sources fully covered the station's energy demand. Wind and solar PVs complement each other in many stations, as little solar radiation is associated with a high probability of heavy wind, and vice versa. A report from a consultant looking at replacing some of the fossil fuel electricity supply in Troll Station (Norway) with renewable energy recommended the option of incorporating solar PVs and battery storage, installed in rooftops to avoid harsh climatic conditions (snow, strong winds and sandblasting), which were eventually able to provide 50% of the total energy demand in a year (Merlet Reference Merlet2016).
Shifting operations to 100% renewables is an alternative that, while requiring a high initial investment, can offer very favourable paybacks. For example, the payback period for making the South African station SANAE IV fully powered by renewables would be 25 years (Ayodele & Ogunjuyigbe Reference Ayodele and Ogunjuyigbe2016). Another example is Zhongshan Station (currently the largest Chinese Antarctic facility), where, according to simulations, researchers estimated that combining wind turbines and a solar PV array could satisfy all power demands and save ~US$1.43 million in 1 year in terms of fuel savings (Dou et al. Reference Dou, Zuo, Chang and Chen2019). A study conducted for the Brazilian Comandante Ferraz Antarctic Station explored the potential of co-generation and a combination of different renewable energy sources, observing the greatest potential for wind energy, followed by solar PV panels (covering only 3.3% of total annual consumption if placed on walls; de Christo et al. Reference de Christo, Fardin, Simonetti, Encarnação and de Alvarez2016).
One of the main shortcomings of incorporating renewable energies is the lack of predictability in their availability. Nonetheless, great improvements are currently underway in the development of powerful battery storage systems, which have not yet reached an optimum point. At Princess Elisabeth Station, an energy storage system made of classic lead-acid batteries injects power into the station when the electricity production falls below demand. An alternative to conventional batteries is the generation of hydrogen as a vector energy source to complement other renewable energy sources. A study conducted at the Argentine Esperanza Station found that it is viable to generate hydrogen in situ as a suitable energy reservoir strategy (Aprea Reference Aprea2012). The hydrogen generated was used as fuel for the laboratories' cooking stoves and as electricity for welding. Using PVs mounted on walls at Esperanza Station plus hydrogen could provide ~94% of the station's energy needs, saving 713 l of fossil fuel per building per year (Cabezas et al. Reference Cabezas, Wolfram, Franco and Fasoli2017).
Methodology
To assess the progress of stations in their deployment of renewable energy, a database was built and analysed. This database used COMNAP's Antarctic Station Catalogue (COMNAP 2017) as the basis for its structure and expanded it to incorporate other stations and new indicators. The main sources of information include the official websites of the NAP of each country, official documents, news articles and scientific journal papers. In addition, interviews and outreach to some research stations' personnel were conducted to verify values regarding their usage of renewable energy technologies. The resulting Antarctic renewable energy database follows several overarching principles for the inputting of its sources and data:
• It only incorporates values on installed renewable energy capacity in the Antarctic continent. Academic research on estimations, projections, studies and experiments on renewable energies that have not been permanently implemented in situ are beyond the scope of the database, yet some information on those experiences might be reflected in the comments section for each station.
• The default assumption is that stations run entirely on fossil fuels whenever there is no evidence or information found specifying any usage of renewable energies.
• The database presents the percentage of energy demand met by renewables. In cases where values from different information sources vary, the database shows the latest available data, but all of the sources identified are listed and considered with their respective dates.
• The share of renewable energy consumed by a facility represents an annual average (see calculations below) and may not provide a complete picture of the seasonal variations (e.g. when renewable sources are not available or when generation is not equally distributed during the winter and summer seasons).
• In cases where there is a source affirming that a station utilizes renewable energy but it does not provide a specific percentage or absolute value from which it is possible to calculate the total percentage coverage, the database lists the station under the indicator ‘Renewable Energy’ with a ‘Yes - Unknown’ entry. In these cases, it is not possible to visualize this breakdown of renewable energy sources in the chart derived from the database.
• Calculations:
◦ Units: the percentage shares of the different energy types collected in the database are the result of the following annually based calculation: total electricity generated by renewable energy sources annually (kWh)/total electricity consumption (kWh).
◦ Whenever there is a source mentioning the percentage breakdown of the different renewable energy sources, those values are incorporated directly.
◦ When the absolute figures on a station's total energy consumption are available, a simple calculation is conducted to convert that value into a percentage share of renewable energy consumption over a period of 1 year of operations.
◦ If the data are incomplete or partial, extrapolation calculations are carried out to obtain the relative breakdowns of energy usage and percentage shares (when this is possible). In these cases, a note is included in the ‘comments’ section for that particular station.
The data reflected in the tables and contents of the next section are a snapshot in time. The database collects, maintains and visualizes data on the categories given in Table I for all facilities currently active in Antarctica.
Table I. Descriptions of the categories used in the database.

Note: the full list of indicators appears in the interactive chart in Fig. 1.
COMNAP = Council of Managers of National Antarctic Programs.
There are certain limitations to the database inherent to its methodology. First, as the information is compiled from a variety of sources and in some cases there is contradicting information, the accuracy and trustworthiness of the database are directly linked to those of the sources cited. To overcome this limitation, personnel from the corresponding NAPs were contacted to corroborate the indicators, but this was not always possible. Second, it is possible that there are sources covering additional facilities that were not found and incorporated into this research.
Results: mapping progress on clean energy in Antarctica
The introduction of renewable energies in Antarctic stations progressed slowly from the first tests in the late 1980s until 2010, when wind and solar technologies became more accessible and the deployment of the technology accelerated globally. The exception is Princess Elisabeth Station, which was a pioneer due to it being a zero-emissions facility from its inception in 2006. To date, 29 facilities have installed some type of renewable power generation capacity, with significant differences among them in terms of the level of progress achieved. Figure 1 shows that more than 50% of the facilities that deployed some type of renewables supply less than 20% of their total electricity demand via solar or wind energy. Only five facilities exceed 50% of their electricity consumption through renewables: Princess Elisabeth (100%), Tor (100%), Wasa (100%), Johann Gregor Mendel (74%) and Scott (70%).

Fig. 1. Percentage of total energy consumption covered by renewable energy sources in Antarctic facilities. To access an interactive version of the graphic and explore the full database, sources and comments about each of the 91 stations studied, visit https://public.tableau.com/app/profile/leandro.vigna/viz/RenewableEnergyinAntarcticStations/TrackerPublic.
The data also show that 62% of the 29 facilities that deployed renewables are operational year-round. However, on average, permanent facilities cover a smaller percentage of their electricity consumption via renewables compared to the seasonal ones. The year-round facility with the largest percentage of renewable power generation is Scott Base at 70%, consuming 42% of the electricity generated by the RIWE farm jointly developed by New Zealand and the USA (McMurdo Station). The permanent station with the second highest percentage of electricity produced via renewables is Mawson Station at ~40%. Until 2017, this figure was higher, but since then the station has been producing electricity with only one 300 kW turbine due to a critical malfunction of the second turbine that left it out of operation.
Regarding the type of energy source, seven facilities have deployed solely wind energy, 14 solely solar (PV and/or thermal) and six a combination of both solar and wind. There is a correlation between the type of renewable energy source and the type of facility: all of the summer-only bases installed solar energy, while 73% of the permanent bases deployed wind energy. It is also observed that in recent years the introduction of solar energy accelerated with respect to wind, especially due to its simpler installation, easier maintenance, greater efficiency and lower costs. Conversely, the use of solar thermal energy has only been implemented at three facilities, especially for melting ice and heating water.
In terms of installed renewable capacity, the wind farms of McMurdo Station/Scott Base and Mawson Station diverge significantly from the other bases (see Table II). The RIWE project (McMurdo Station/Scott Base) has an installed power capacity of 990 kW through three turbines of 330 kW, while Mawson Station incorporated two turbines of 300 kW each. In third place regarding installed renewable capacity, Princess Elisabeth Station has an installed power capacity of 132 kW, followed closely by Rothera Research Station (100.7 kW) and Korean Jang Bogo Station (91.7 kW). Table II displays the top bases in terms of installed renewable capacity.
Table II. Top stations in terms of installed renewable energy capacity (sorted by kW installed capacity).

a One of the 300 kW turbines experienced a major malfunction in 2017 and is not currently in operation.
PV = photovoltaic.
The geographical distribution of the stations that deployed clean energy does not follow a defined pattern, as the stations are spread throughout the entire continent (see Fig. 2 for reference). However, there is a tendency for them to be located near the coast, which facilitates the logistics of their installation. Out of the few inland facilities located near the geographical South Pole, none has installed clean energy systems to date. Even though the renovated US Amundsen-Scott Station was initially planned to have integrated solar PV panels on its roof, their installation was cancelled due to budget restrictions and project delays, and the new station is now powered only by diesel.
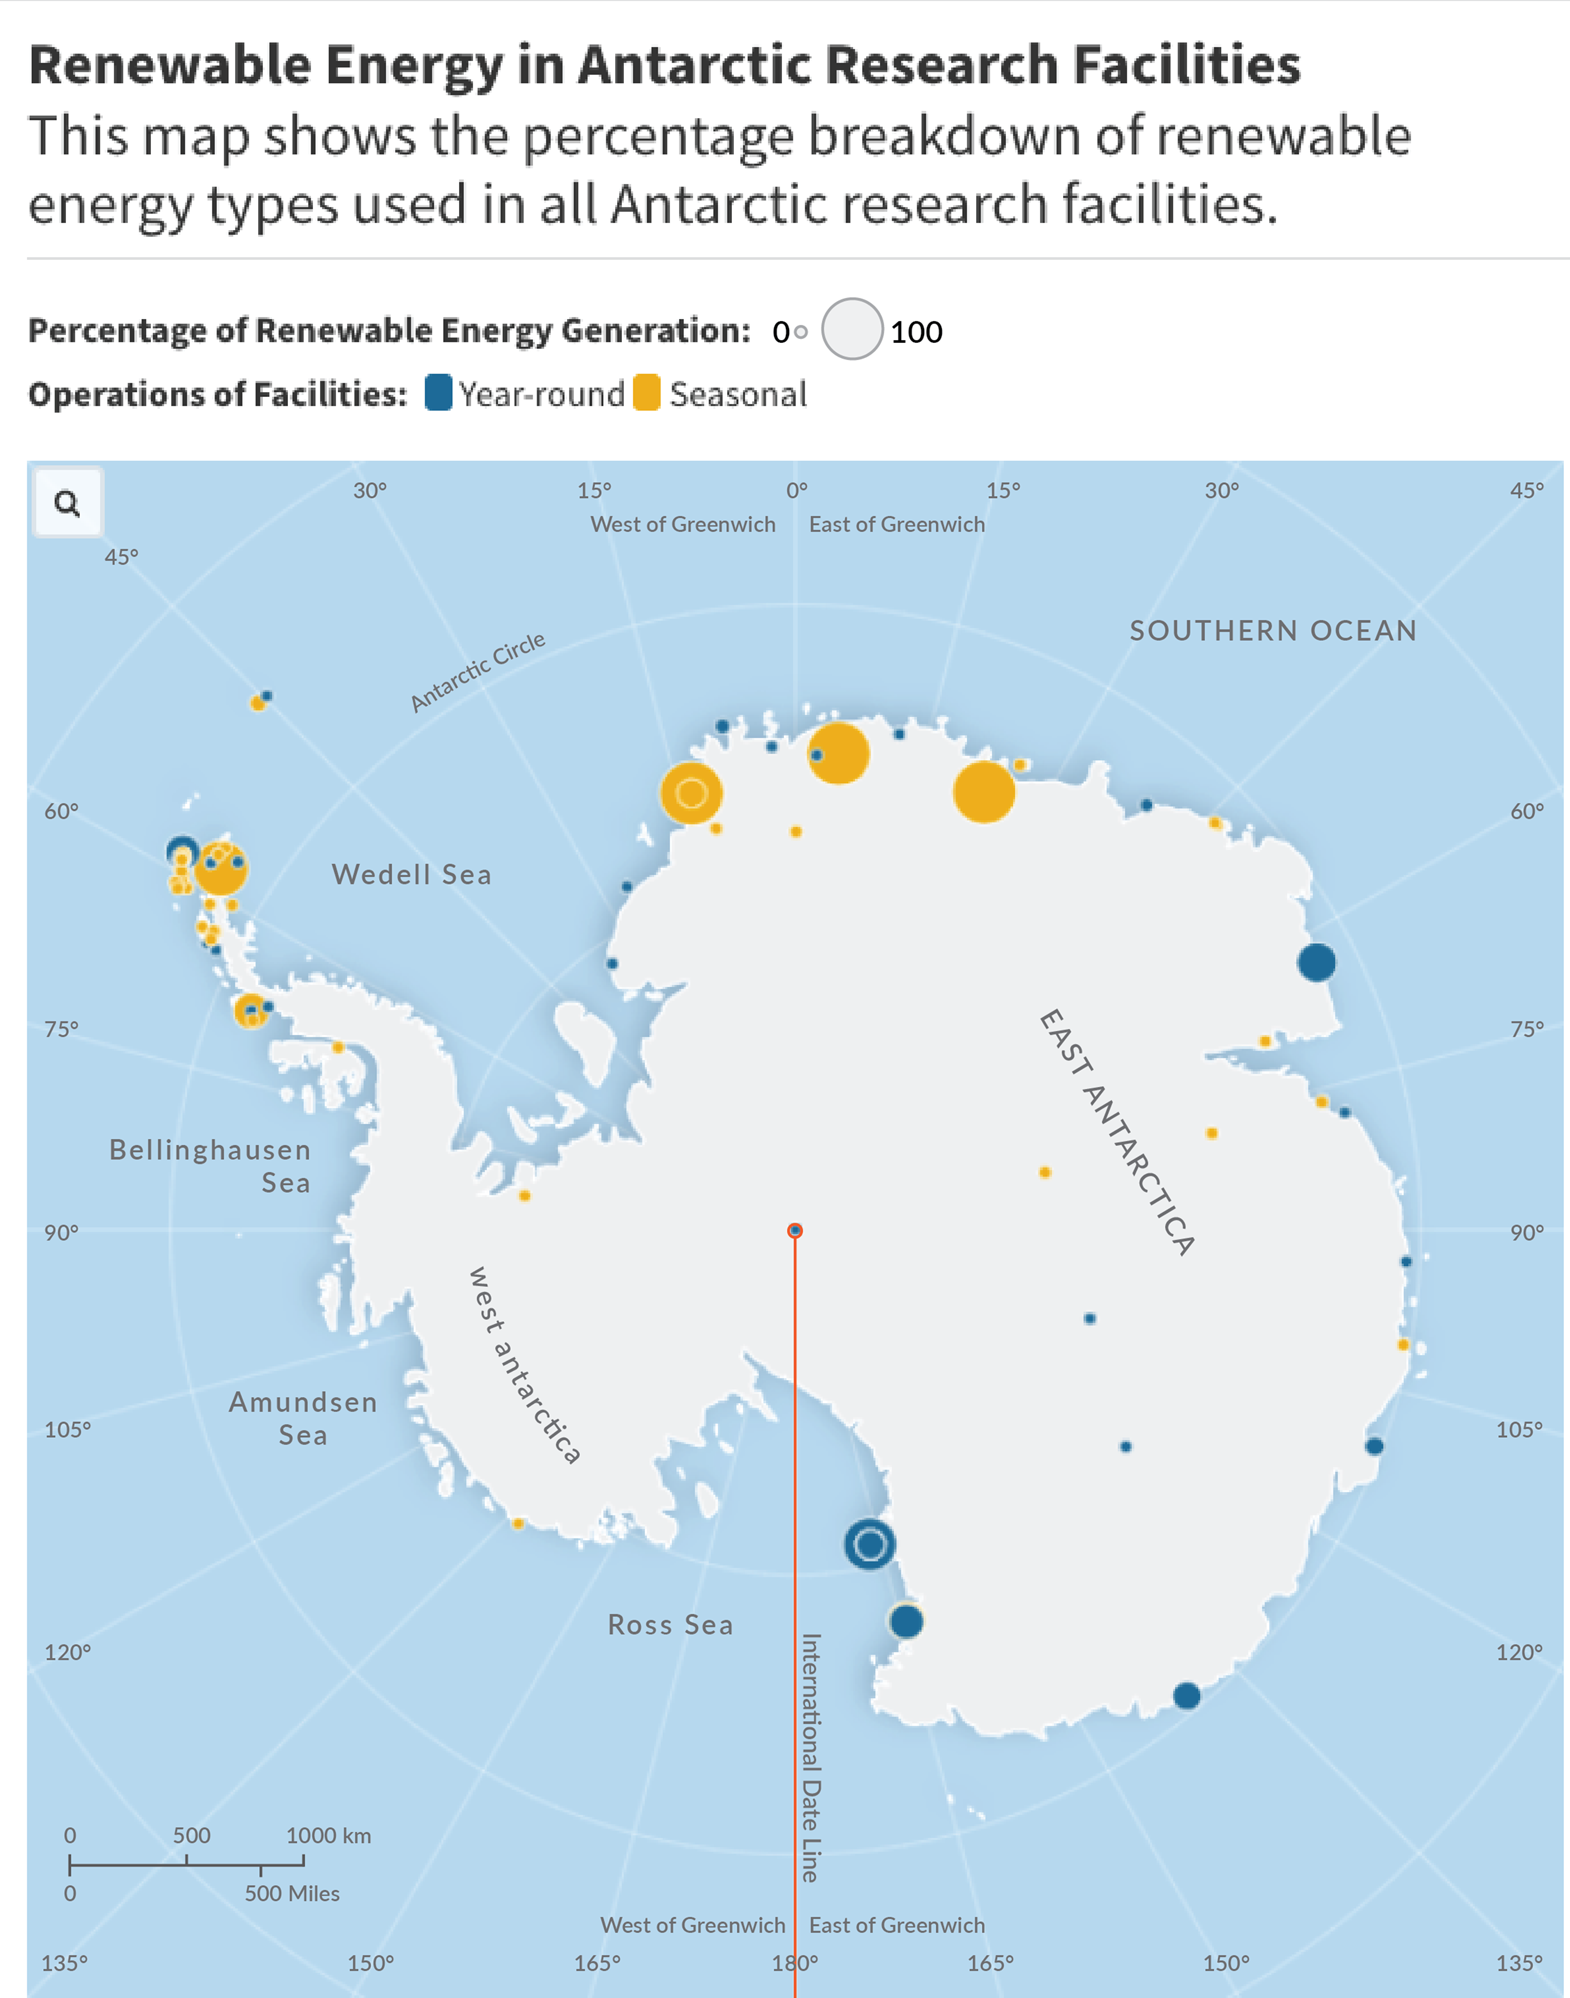
Fig. 2. Distribution of Antarctic research stations using renewable energy sources. Source: independent research based on the current paper. To access the online version of the graphic, visit https://public.flourish.studio/visualisation/5888942/.
Discussions on the lessons learnt regarding introducing renewable energy in Antarctica
This section aims to fill the gap in the literature on experiences and lessons learnt from the introduction of renewable energy in Antarctica. To carry out this task, 14 interviews were conducted encompassing a representative sample including countries that have installed wind and/or solar energy systems, seasonal and permanent facilities and different geographical locations in Antarctica (both coastal and inland facilities). The sample also covered countries with both large Antarctic budgets and countries with more modest ones (Table III).
Table III. Sample of interviews conducted.

The interviews were conducted with either personnel of the stations in charge of the energy operation of the base or contractors in charge of the installation of the renewable energy systems. In most cases, they are permanent personnel from national programmes, but interviews were also conducted with personnel from companies hired for the installation of the new energy equipment. Interviews proved particularly effective in gathering valuable lessons given that most of the planning and installations of renewable energy sources took place within the last decade, allowing us to hear from personnel directly involved in the projects. The interviews were mostly conducted via video call and had an average duration of 45 min. They were semi-structured and included closed-ended and open-ended questions. Appendix 1 shows the interview questionnaire. The interviewees were in turn invited to read the final version of the paper and corroborate the information provided (interviews whose answers were sent in writing were not shared). Documentary evidence, including newspaper archives, information on the websites of NAPs and official press releases, also served as a key data source.
The stages of development, progress and complexity of the renewable energy systems deployed in the Antarctic stations are a function of the levels of ambition, resources available, strategic vision and age of the stations. This conclusion is derived from the assessment of the stations across three categories described in this section and is illustrated using the most representative examples extracted from the interviews conducted: ‘goals and ambitions', ‘funding and implementation’ and ‘obstacles and constraints’. ‘Goals and ambitions’ refers to the aim or purpose behind the development of renewable energy systems. ‘Funding and implementation’ relates to the sources of capital that cover the costs of installing the systems and the management and collaboration models in place. Finally, ‘obstacles and constraints’ includes the main difficulties encountered during the design, installation and operation of the renewable energy systems.
Goals and ambitions
Four goals behind the development of renewable energy systems have been cited by most of the respondents: fuel cost reduction or avoidance; reduction of the greenhouse gas emissions footprint in alignment with national decarbonization targets; electricity supply for the operation of scientific equipment during the winter months; and the development and/or testing of new technologies.
The costs of fossils fuel delivered to Antarctica have been estimated to be between six (e.g. Belgium), seven (e.g. Argentina) and ten (e.g. Czechia) times higher than in the countries of origin or the closest mainland of the different stations, which makes the payback time of the investment in renewable systems quite short according to the experience of the Czech base. In addition, fossil fuels are naturally subject to the volatility of international market prices, putting at risk both the availability of fuels and the ability to keep balanced budgets. In this sense, resorting to renewable energy not only reduces costs, but also contributes to increased autonomy and energy security.
The wind turbines at the AAD's Mawson Station are on their way to reducing the amount of diesel fuel required by over two-thirds, from 600 000 l per year to less than 200 000 l per year, and they should produce enough electricity to reduce the need to resupply diesel to only one trip every 3 years. The wind farm installed at Mawson Station, together with the powerhouse control and storage system, provided up to 95% of the station load for long periods of time, with wind turbines typically supplying 60% of the station load.
Antarctica New Zealand along with the United States Antarctic Program (USAP) decided to install the largest wind farm in Antarctica, alleging the cost of diesel power generation as one of the main reasons for this. At the time of the installation of the RIWE wind farm in 2009, oil prices were steadily increasing. The project considered a cost-benefit analysis and a net present value that justified the investment in the project.
Reducing the carbon footprint of Antarctic operations was a key goal referred to in the vast majority of the interviews conducted, usually in line with the wider national decarbonization and sustainability plans in place that require the alignment of Antarctic operations. This is the case, for example, for the Uruguayan and British stations. Currently, no station is running completely on renewable energy, nor are any of them carbon neutral. This is inevitably a work in progress with different levels of completion and achievement, which are a function of both the (evolving) ambition set for the stations and the constraints encountered.
The British Antarctic Survey (BAS) is committed to achieve net-zero carbon emissions by 2040, targeting operational emissions and high-impact Scope 3 emissions, in alignment with the Environmental Sustainability Strategy of its parent organization, UK Research and Innovation. As part of the implementation plan, BAS's long-term Antarctic Infrastructure Modernisation Programme will help deliver the decarbonization of Rothera Research Station (the largest British station in Antarctica) by 2030. The aim is to maximize renewable energy use through a combination of different supply and storage systems across all British stations in Antarctica to meet the target of net-zero carbon emissions by 2040.
The development of new technologies has also been one of the aims of installing renewable energy in Antarctica, with the idea of testing their performance, endurance and reliability under sub-zero temperatures and extreme weather conditions such as ice, wind and snowstorms. This was the case, for example, for the experimental hydrogen plant installed in Argentina's Esperanza Station in 2009 under the MAEL project (Spanish acronym of Argentine Clean Energy Module), which aimed to make the most efficient use of the wind resources available by producing hydrogen via water electrolysis for energy storage as part of the goal to reduce fossil fuel consumption at the station by 50% by 2025. The 5 kW wind turbine that was installed for such a purpose generated on average ~40 kWh per day, and the hydrogen produced by the electrolyser was stored at 30 bar in tanks with a capacity of 10 normal cubic metres, equating to 33 kWh of electricity, and used to power an oven. This was in addition to an existing 5 kW wind turbine installed by INVAP, an Argentine company dedicated to the manufacturing of devices in the aerospace, nuclear and chemical sectors.
In the case of Spain, one of the main goals for the deployment of renewable energy was to operationalize the research teams in the winter, when the base is uninhabited. Joint studies with the private sector have aimed to return the base to zero emissions, but the project did not prosper because infrastructure that cannot be removed would have to be installed. Finland's Aboa station also introduced renewable energy to power its research autonomously and to allow more consistent year-round measurements to be obtained, as it is not possible to run diesel generators without in situ supervision. Battery storage is of fundamental importance to compensate for the scarce solar radiation during the winter months. While there are plans to expand generation capacity, reaching 100% generation capacity is difficult due to the characteristics of the station.
Funding and implementation
Funding and implementation are reflections not only of the different management models of the Antarctic stations, but also of the extent to which the latter play a strategic role in national plans for technological and scientific advancement. With budget limitations being a common occurrence, public funding, private funding or a combination of both have supported the installation and operations of renewable energy systems.
In the case of Belgium, the Belgian Polar Secretariat mandated the International Polar Foundation to manage its Princess Elisabeth Station. For the construction of the station, private sponsors contributed funds, technology and engineers, with the Belgian government providing additional funding.
At Australia's Casey Station, the renewable energy system in place is the result of a collaboration between the AAD and Masdar, a renewable energy research and development corporation based in the United Arab Emirates, to investigate a range of energy efficiency and energy management options at Australia's Antarctic stations. Masdar sourced the solar panels from Aleo Solar in Germany, while AAD engineers undertook wind modelling, produced technical drawings and devised a special mounting system of brackets and rails to fit the panels to the corrugated shape of the green store cladding.
For the wind energy system installed at Mawson Station, the AAD worked closely with German turbine manufacturer Enercon and the Australian company Powercorp to install the turbines and the associated computerized powerhouse control system in early 2003. Because of the inherent risks of undertaking a major project such as this in Antarctica, the main contractor, the turbine supplier and the AAD agreed to use a partnership agreement for the project. In addition, the Renewable Energy Certificates earned by the wind turbines at Mawson Station have been bought by Westpac Banking Corporation, which will help to offset the cost of the AAD's wind energy project and to build new renewable energy capacity elsewhere in Antarctica and Australia, as well as contributing to the financial sustainability of the project.
In the case of the McMurdo-Scott collaboration, New Zealand's Scott Base, a facility with a small electrical system, saw in the atypical proximity with the larger US McMurdo Station the opportunity to create a joint electrical grid, allowing for economies of scale to be realized while also supporting a close Antarctic Treaty partner, as the USAP was also keen on reducing the use of diesel fuel at McMurdo Station for both environmental and economic reasons. The wind farm was funded by the New Zealand government with the assistance of a state-owned energy provider, Meridian Energy. The main challenge regarding budget in this project was the large cost due to the long project duration, as construction was limited to the summer months only.
Meanwhile, in the case of Uruguay, solar panels were provided by a private company as part of their marketing strategy. In 2018 and 2019, ABB Solar Solutions donated the first and second solar PV systems to General Artigas Station, provided technical training to the installers and worked alongside the Ministry of Energy, the National Administration of Power Plants and Electrical Transmissions (also known as UTE), the Israeli energy and data company SmartGreen and the Uruguayan Antarctic Institute throughout the installation of the panels.
The successful yet short-lived experimental hydrogen plant at Argentina's Esperanza Station was developed and implemented at practically no cost to the Argentine state. The electrolyser, developed and built by engineers from the Instituto Tecnológico de Buenos Aires, was sponsored by the Fundación Hidrógeno Santa Cruz, and the Asociación Argentina de Hidrógeno provided the storage system, the accumulators, the generator, the wind turbine and the appliance to be powered by the system. CITEFA (the Institute of Scientific and Technological Research of the Armed Forces) and the Escuela Superior Técnica, two institutions from the Argentine Army, provided the fuel cells.
At Germany's Neumayer Station III and Czechia's Johann Gregor Mendel Antarctic Station, all purchases were conducted through public tenders. At the Finnish Aboa station, these costs were financed by the financed by the ministry or government agency in charge of Antarctica affairs, without any private support. Similarly, in the case of the UK, these costs were paid for using public funding.
Another key variable when planning the funding and level of ambition of renewable energy systems is the point in time at which the decision to incorporate wind and/or solar energy into the matrix was made, and there are naturally significant differences in this between those countries that planned for their stations to run on renewable energy early in their planning stage and those with a presence of decades in the continent and have had to strive to modernize, upgrade and/or adapt their existing energy supplies. Princess Elisabeth Station was conceived with renewable energy in mind from its inception. This allowed for thorough energy use modelling that took into consideration snow deposition patterns, wind models, solar potential and thermal gains. Czechia's Johann Gregor Mendel Antarctic Station also planned to incorporate renewables to some extent from its inception and was designed to utilize both fossil fuels and renewable energy. After the main completion of the station in 2006, its electricity generation was based on two diesel generators with 25 kW power (one of them as reserve) together with eight power conditioning systems of 1.5 kW wind turbines charging nickel-cadmium batteries and thus lowering the fuel consumption and diesel generator operating period. Data from February 2015 indicate that diesel, wind and solar PVs accounted for 26%, 6% and 68% of the station's power generation, respectively. Unlikely Princess Elisabeth and Johann Gregor Mendel Antarctic stations, most of the stations we analysed had been in operation for many years if not decades, and the installation of renewable systems had to adapt to their location, ground conditions, weather characteristics and other constraints, including protected areas for birds and other wildlife, meaning that costs could significantly increase in these cases to many times larger even than building a whole new station.
Obstacles and constraints
The remote location and extreme weather conditions of Antarctica characterize the three main obstacles and constraints facing the operation of renewable energy systems in most of the stations: 1) technical challenges, 2) safety and level of comfort of the staff and 3) logistical limitations.
As regards technical challenges of wind turbines in Antarctica, the harsh weather conditions, with strong, gusty winds and freezing temperatures, can place enormous stresses on wind turbine rotors and cause mechanical failures. In fact, vibrations and fractures of the rotor blades have been some of the key technical issues affecting the operation and timely progress of these wind energy projects, as referred to in the vast majority of the interviews we conducted. Moreover, together with the fact that most turbines are installed on ice, they must be robust enough to perform under a wide range of wind speeds. At Princess Elisabeth Station, three turbines broke, and their blades and rotors were redesigned in conjunction with the manufacturer to reduce vibration, and since then no further problems have been encountered. However, concerning optimization of production, installation too close together resulted in some turbines ‘stealing’ wind from one another when the wind shifted from its usual direction. However, wind power is the only source of energy at Princess Elisabeth Station during the dark winter months.
In the Czech experience, wind turbines have been unreliable, with their mechanical parts being affected by the weather. Severe damage to the mechanical parts of the wind turbines was caused by heavy windstorms within the first years of operation and, despite the efforts of the technical staff, only four of the initial eight turbines remained fully operational. Since then, although disruption events have been more sporadic, the expansion of the renewable energy system has been constrained by the inability to find appropriate turbines. Similarly, at the Spanish Gabriel de Castilla Base, the main issues revolved around broken blades and equipment damage due to strong winds.
In this sense, a key concern regarding Germany's Neumayer Station was to provide a reliable turbine based on proven technology. Germany installed its first wind turbine in 1991, and since then the companies that partnered to develop the systems (AWI, HS Bremerhaven and Enercon GmbH) have modernized and adapted these turbines using new technologies, the latest development being a wind turbine with a horizontal axis installed in 2009 at Neumayer Station III.
For Mawson Station's wind energy system, the blades were cast in specialist steel to better cope with the weather conditions and to avoid metal fatigue. Powercorp developed a unique electric boiler-based energy storage system that is used to stabilize the frequency and voltage on the station grid as well as to meet the station's heating needs. The wind turbine manufacturer Enercon GmbH developed a special cold-temperature, high-wind version of one of their wind turbines specifically for the Mawson Station application. The AAD constructed the concrete foundations for its wind turbines, which involved pouring each 80 m3 concrete foundations over the 2002–2003 summer and required the cooperation of the entire station staff. A satellite video link was used so that the design engineers could monitor the process and offer advice if necessary. In the case of the McMurdo-Scott wind farm, the same turbine supplier as that who supplied Mawson Station was chosen to design a hybrid wind-diesel system. The latter is of a direct drive design, with no gearbox and no lubricant fluids, which reduces maintenance.
In addition to the weather conditions, the weight, height and ability to be assembled, disassembled, serviced and stored of the energy systems are among the main considerations when deploying wind energy in Antarctica. Uruguay, for example, has encountered several setbacks during the installation of its first wind turbine, originally planned for 2019, including disruption resulting from the COVID-19 pandemic, which affected the progress of General Artigas Station's renewable energy ambitions in general.
Regarding solar PVs, the main issues were associated with snow accumulation, the efficiency of solar panels and their resilience to extreme weather events. In the case of Princess Elisabeth Station, panels initially installed too close to the station created extra work for the team as snow accumulated, and they were moved to the Utsteinen ridge as a result. New installations include cylinders with 360° PV cells and bifacial panels, which have doubled their capacity and allowed for heating of the annexe buildings. The solar PV system installed at Casey Station covers ~10% of the station's total demand. There, 105 solar panels are mounted on the northern wall of the ‘green store’. While the panel installation is unusual in its flush mounting against a wall, it has been designed to strike a balance between maximum solar gain and stability in the wind, as well as ensuring that the panels are easy to install, access and maintain.
The setup of the solar PV panels at Johann Gregor Mendel Antarctic Station is similar, as they are stuck to containers rather than attached to the ground to improve resilience. However, as frosts break the modules, the team is thinking of additional ways to protect the panels. At Aboa base, where harnessing wind energy was not possible due to the characteristics of the site, station staff have also incorporated solar PVs to reduce diesel consumption. Strong winds and storms broke the glass that covers the panels (small stones can easily break the glass of PV panels), so the station staff have replaced these with walkable panels that are more resistant.
Uruguay found the installation of solar PV panels at its Antarctic station to be an easy and straightforward task, with the first 1 kW-capacity setup being installed in 2018. Solar panels were mounted on the walls of the building to minimize interference from the wind. However, this meant that the positioning of the panels was not at the optimal slope of 55° north, which affected their performance. In 2019, a second system was installed, but a floor installation on metal supports was chosen, optimizing the elevation angle and the orientation of the panels to maximize electricity generation. One of the main challenges encountered in this design was the need to resist winds of up to 200 km/h.
The operation and regular maintenance of the systems and equipment require each crew to have trained staff on site to ensure the sustainability of the systems' operation. Training varies with the size and complexity of the system. Mawson Station provides, for example, training in the specialized maintenance and servicing of turbines to station staff, including safety aspects of working at heights. At Aboa station, dedicated staff have been trained to operate and maintain the solar PV system. For the McMurdo/Scott wind farm, technical staff from Europe were required during installation, and ongoing specialized training is given to staff to maintain the turbine. Original project site staff underwent training on site and Antarctica New Zealand asset managers attended training in Germany. For the maintenance of the wind turbines at the Spanish stations, staff contact the manufacturers to obtain spare parts, but the staff conduct the installation and maintenance themselves. The personnel are usually the same, which avoids training-related difficulties.
In the case of Argentina's Esperanza Station, users received specific training on hydrogen systems and the operation and safety of the equipment installed. However, because Esperanza Station is a permanent, year-round Argentine research station, the entire staff is renewed every year, and the incoming crew was unfortunately not trained to keep the operation going. Thus, following a 300 km/h windstorm that swept away the wind turbine a few months after installation, both the turbine and the electrolyser had to be shipped back to the mainland.
Solar thermal power is only used at Princess Elisabeth Station, the British research stations at Rothera and Signy and Germany's Gondwana Station. Princess Elisabeth Station replaced some thermal panels with solar PVs, which were found to be easier to maintain as no fluids are involved. Gondwana Station, a summer facility consisting of 20 foot containers where the scientists work, installed in 2016 a solar thermal system made of nine Twinsolar 2.0 collectors with a surface area of 18 m2 to provide part of the heating needed during the three summer months when research is conducted. The thermal system, which has an overall peak capacity of 11.7 kW, can increase the indoor air temperature by up to 40°C.
Comfort of the staff is of fundamental importance, as is avoiding hardships that could put their health and safety at risk. This is, at the moment, a key constraint facing some Antarctic stations, preventing them from expanding their renewable energy systems, as diesel generation is still required both as a backup and to ensure the comfort of the staff, as was referred to during interviews with Czech and German station personnel. In the case of Johann Gregor Mendel Antarctic Station (Czechia), energy management based on the restricted operation of appliances contributed considerably to saving fuel and maximizing the utilization of the renewable energy sources, but doing so reduced staff comfort.
Logistics are naturally challenging for all Antarctic stations. In the experience personnel at General Artigas and Johann Gregor Mendel Antarctic stations, the delivery of components to the continent is difficult, as all necessary components must be included in the shipments. A single missing component or tool can postpone projects for another year, as it would have to be delivered by the next expedition. Additionally, mounting and servicing must be done by a limited number of personnel using common tools available on site or delivered intentionally, as it is not possible to use special equipment such as cranes or excavators.
Cooperation with other countries to transport materials is sometimes required. This is the case at Czechia's Johann Gregor Mendel Antarctic Station, which relies on cooperation with Argentine and Chilean stations for logistics, including the transportation of turbines and solar PV equipment to James Ross Island, where the station is located. In the case of Princess Elisabeth Station, located 220 km inland, materials are delivered via ships and then 20 foot sledges. There, the main challenge is not the weather but the foundations of the annexes, which were built on ice but have since been rebuilt (on hydraulic supports) using a semi-cantilever fixation to the rock, which allows the buildings to remain fixed and level even as the ice moves underneath.
Conclusions
This study analysed the use of renewable energy in Antarctic stations and identified the following points:
• The deployment of renewable energy in Antarctic stations has accelerated in the last 15 years when wind and solar technologies became more available and affordable and technological development expanded globally. To date, 29 stations have incorporated renewables into their energy systems. However, only five of the 29 stations use renewable energy to meet more than 50% of their energy needs.
• Fuel cost savings, reductions of greenhouse gas emissions in line with national decarbonization targets, provision of electricity to scientific equipment during the winter months and the development and/or testing of new technologies are the four main goals behind the development of Antarctic renewable energy systems. According to the interviews conducted, most of the stations have plans to continue the decarbonization of their energy systems in the next 10 years.
• Budget limitations are a common barrier to further deployment of Antarctic renewable energy systems. From public financing as in the case of Germany to the reliance on private sponsors as with Uruguay and Belgium or through the sale of Renewable Energy Certificates in Australia, stations have resorted to a combination of both public and private funding to support the installation and operations of renewable energy systems.
• Long-term budget planning is necessary, which includes the cost not only of maintenance, but also the training of the personnel to operate the energy systems. It is necessary to have precise data on the meteorological conditions of the bases to correctly design the equipment, as well as their logistical, budgetary and personnel capacities. Budget planning should consider repairs and rebuilds, as the extreme weather conditions of Antarctica can cause significant and even irreparable damage to equipment.
• At the majority of the stations, the remote location and extreme weather conditions of Antarctica define the three obstacles and limitations that characterize the operation of Antarctic renewable energy systems: technical challenges, logistical constraints and staff safety and comfort.
◦ In terms of the technological hurdles faced by wind turbines in Antarctica, harsh weather conditions such as high, gusty winds and cold temperatures can put huge stress on wind turbine rotors, resulting in mechanical failures. Regarding solar PVs, the key challenges are snow accumulation, solar panel resilience to extreme storms and solar panel efficiency. With the development of more efficient panels in recent years, the usage of solar PVs has expanded substantially, replacing even thermal panels, which can have high maintenance costs.
◦ Logistics in Antarctica are extremely complex, thus meticulous planning is required, as any missing materials during delivery may cause installation to be postponed by a year. The installation must consider all of the base's capabilities, including tools and staff who can assist with the installation.
◦ The wellbeing of staff is critical, as is preventing hardships that could jeopardize their health and safety. In this sense, the constraints posed by the variability of wind and solar PV sources calls for both the development of energy storage alternatives and the need for fossil fuel as a backup of last resort.
• Cooperation between countries to develop renewable energy together is scarce. The McMurdo-Scott wind farm is a success case that should inspire more countries, especially those that share geographical proximity, to cooperate, share technology and reduce costs in terms of both equipment and logistics.
In conclusion, the deployment of renewable energy sources in Antarctica is a work in progress with different levels of completion and achievement as a function of both the (evolving) ambitions set for the stations and the constraints encountered. No station is running completely on renewable energy, nor are any carbon neutral. Tracking the deployment of renewable energy systems contributes to the assessment of technological progress and of the alignment of Antarctic operations with broader national decarbonization targets. The database created for this paper is expected to grow in scope and develop to become an Antarctic renewable energy tracker. This will be a tool aimed at tracking commitments and projects underway to expand renewable energy over time, giving an indication of the trajectories that the stations are on and adding visibility and accountability for targets, which is particularly important following COP26.
Acknowledgements
The authors appreciate the time given by the interviewees, who provided the information used in this paper. They also want to acknowledge the contributions of Dr Ricardo Roura and the reviewers in the preparation of this paper.
Author contributions
JJL and LV worked on the creation and analysis of the database (Antarctic renewable energy tracker) and JJL and MA focused on the lessons learnt section. The three authors contributed to the analysis of the results and writing of the manuscript. LV is the author of the interactive map.
Appendix 1. Interview questionnaire.
The following text and questions were shared either verbally or via email with station leaders, experts or protagonists involved in the deployment of wind and solar energy in the Antarctic stations to trigger discussion.
We are researching the deployment of renewable energy in Antarctic stations. Aside from conducting a literature review, we are very much interested in interviewing station leaders, experts, or protagonists like you to better understand the motivations, risks, challenges, costs, and benefits of deploying renewable energy in different Antarctic stations. Please find below the questions that we would like your response to.
1) What were the main drivers and motivations for introducing renewable energy in your station?
2) Did you carry out a cost-benefit analysis for introducing renewables in your station?
3) Who supported the funding of the deployment?
4) What challenges did you face during the installation and operation of the new equipment (technical, weather-related, financial, human resources, etc.)?
5) How did you select the energy equipment manufacturer?
6) How was the relationship between the manufacturer and the station personnel during and after the installation of the equipment?
7) What were the biggest maintenance challenges?
8) Were there any accidents related to the installation or operation of the new energy equipment?
9) Did the personnel receive special training related to the introduction of renewable energy?
10) Were the expected objectives achieved? If not, what were the problems?
11) Are there any projects to expand the percentage of renewables of the station?


 Open access