


Cognitive impairment is a key determinant of occupational and social outcomes and quality of life in people with mood disorders.Reference Baune and Malhi1,Reference Evans, Iverson, Yatham and Lam2 Up to 57% of adults with bipolar disorder and up to 50% of adults with major depression show clinically significant levels of cognitive impairment, even in euthymia.Reference Cullen, Ward, Graham, Deary, Pell and Smith3,Reference Rock, Roiser, Riedel and Blackwell4 In bipolar disorder, impairment is typically found on tests of attention, working and episodic memory, processing speed and executive function, with group differences of medium to large effect size compared with adults without a history of psychiatric illness.Reference Bourne, Aydemir, Balanzá-Martinez, Bora, Brissos and Cavanagh5,Reference Bortolato, Miskowiak, Koehler, Vieta and Carvalho6 The profile of impairment is similar in major depression, but with effect sizes of smaller magnitude.Reference Szmulewicz, Valerio, Smith, Samame, Martino and Strejilevich7 The causal nature of this relationship is unclear, however, because approaches to accounting for confounding influences have been inconsistent in the literature. Moving towards causal explanations requires careful modelling of a range of potential confounding, mediating and moderating factors, acknowledging the complexity of their inter-relationships with mood disorder exposure, cognitive outcome and each other. The application of novel confounder control techniques in psychiatric epidemiology is not yet widespread. The counterfactual approach, in which causal effects are conceptualised as alternative ‘potential outcomes’ of an exposure, can be linked with graphical notation in the form of directed acyclic graphs (DAGs) to systematically identify causal effects in complex systems.Reference Pearl, Glymour and Jewell8,Reference VanderWeele9 This, in turn, informs rigorous statistical analyses and clarifies the assumptions needed to interpret estimates as causal. In this study, we applied a graphical approach to understand the structure of confounding and mediation with regard to cognitive performance in UK BiobankReference Sudlow, Gallacher, Allen, Beral, Burton and Danesh10 participants with a history of bipolar disorder or major depression. We estimated the total effect of bipolar disorder and major depression on cognitive function, and the magnitude of the effect that was transmitted through potentially modifiable intermediate factors.
Method
Participants
UK Biobank recruited adults from the general population across 22 centres in Great Britain between 2006 and 2010. The target age range was 40 to 69 years and no other exclusion criteria were applied. Postal invitation lists were generated from National Health Service (NHS) registers, with a response rate of approximately 6%. We used cross-sectional data from the full cohort at baseline (n = 502 618). Participants were included in the analysis if they had sufficient data to classify their bipolar disorder or major depression exposure status (see below) and had data on at least one cognitive outcome measure. We assert that all procedures contributing to this work comply with the ethical standards of the relevant national and institutional committees on human experimentation and with the Declaration of Helsinki 1975, as revised in 2008. All procedures involving human participants were approved by the North West – Haydock NHS Research Ethics Committee (reference 16/NW/0274 and 11/NW/0382). Written informed consent was obtained from all participants.
Mood disorder status
Three sources of information were available regarding history of mood disorder: self-reported doctor diagnosis; probable classification based on self-reported lifetime mood disorder symptoms and help-seeking;Reference Smith, Nicholl, Cullen, Martin, Ul-Haq and Evans11 and linked NHS hospital in-patient and day case records. The definitions used in these sources are provided in the supplementary Methods available at https://doi.org/10.1192/bjp.2019.188. To permit consistency across each information source, a single manic episode and bipolar disorder were analysed as one exposure (mania/bipolar disorder) and the major depression exposure included single episode and recurrent illness.
Participants were classified as exposed if they were positive for mania/bipolar disorder or major depression in at least one information source. Mania/bipolar disorder and major depression were then separated hierarchically into two mutually exclusive exposure groups. Participants with a record of both mania/bipolar disorder and major depression were classified in the mania/bipolar disorder group only. The unexposed comparison group comprised participants who had complete self-reported data that did not indicate mania/bipolar disorder or major depression and whose hospital records had no primary or secondary diagnosis of mania/bipolar disorder or major depression. Furthermore, because misclassification is common between mania/bipolar disorder and schizophrenia spectrum disorders,Reference Bromet, Kotov, Fochtmann, Carlson, Tanenberg-Karant and Ruggero12 participants with a self-reported diagnosis or hospital record of schizophrenia (ICD-10 code F20*) were excluded from all exposed and unexposed groups. In summary, the final groups for analysis were: mania/bipolar disorder (excluding participants with only major depression and those with schizophrenia); major depression (excluding participants with mania/bipolar disorder and those with schizophrenia); and unexposed (complete data indicating no mania/bipolar disorder or major depression or schizophrenia). Participants who did not meet the above criteria for either the exposed or unexposed groups were not further analysed (e.g. those with incomplete data, preventing inclusion in the unexposed group).
Cognitive outcome measures
The cognitive measures analysed were reasoning, reaction time, numeric memory, visuospatial memory and prospective memory, as described in detail elsewhere.Reference Cullen, Smith, Deary, Evans and Pell13 All tests were administered via a touchscreen computer. The psychometric properties of these tests have been reported previously.Reference Lyall, Cullen, Allerhand, Smith, Mackay and Evans14 The data were provided by UK Biobank as raw scores, and for the purposes of the present analysis were standardised within 5-year age strata, using all available data in the cohort at baseline. Five-year bands were deemed appropriate in light of the typical rate of age-related change in cognitive performance in middle to older adulthood.Reference Strauss, Sherman and Spreen15 To address skew in the raw data distributions, the scores were first transformed into percentiles and then into z-scores (mean = 0 and s.d. = 1). The scores for reaction time and visuospatial memory were reflected so that higher scores represent better performance, in line with the other tests. It was not possible to standardise the prospective memory data in this way because responses were dichotomised (correct response at the first attempt or not), and so the raw data were used in the analyses involving this test.
Covariates
Sociodemographic, environmental, lifestyle and physical measures
Details of these measures are provided in the supplementary Methods. Briefly, the sociodemographic variables were age, gender, ethnic background, country of birth, educational attainment and neighbourhood deprivation level. Local environment measures comprised population density, proximity to the nearest major road, and air pollutants (particulate matter and nitrogen dioxide). Lifestyle and physical measures comprised smoking, alcohol consumption, insomnia, physical activity and body mass index (BMI).
Medical and family history
A dichotomous indicator was created for history of any cardiometabolic disease (self-reported diagnosis of angina, hypertension or non-gestational diabetes, or adjudicated diagnosis of myocardial infarction or stroke; see supplementary Methods). A dichotomous indicator was also created for history of any neurological or psychiatric condition (apart from mood disorder or schizophrenia) in the self-reported or hospital records data; the conditions included are listed in the supplementary Methods. Family history of certain illnesses in biological parents and siblings was included in the baseline questionnaire, and for the present analyses dichotomous indicators were generated for history of psychiatric or neurological conditions (dementia, Parkinson's disease or severe depression, coded separately) in any parent or sibling. Participants also self-reported whether their mothers had smoked regularly around the time of their birth.
Mental health and psychotropic medication
In addition to the self-reported and hospital records data regarding psychiatric diagnoses, participants provided self-reported information at baseline about depressive symptoms in the past 2 weeks and current psychotropic medications (dichotomous indicator for any mood stabiliser, antidepressant, antipsychotic, sedative or hypnotic), as detailed in the supplementary Methods. Self-reported information regarding number of episodes of depressed mood or anhedonia was collected at baseline and in a web-based follow-up questionnaire in 2016, and data regarding childhood trauma experiences were also collected in the web-based questionnaire (see supplementary Methods).
Genome-wide polygenic scores
Genome-wide polygenic scores (GPS) were generated for cognitive ability, bipolar disorder and major depression, based on summary statistics from previous genome-wide association studies (GWAS). Full details of the genotyping data, GPS methods and optimum scores used in the present analyses are provided in the supplementary Methods.
Statistical analyses
Graphical models
The analyses were informed by a graphical model in the form of a DAG, which is used to visually represent qualitative causal assumptions.Reference Elwert and Morgan16 The structural nature of these assumptions permits the detection of implied patterns of dependency and independency among variables, which can then be tested with data. Structural analysis of the DAG allows confounders, mediators and colliders to be distinguished when planning multivariable analyses.Reference Elwert and Morgan16
A DAG was constructed to represent plausible causal assumptions about the relationship between lifetime history of mania/bipolar disorder and cognitive performance, in the context of possible confounding factors and intermediate pathways. This was done before any data were analysed. The nodes in the DAG and the assumed directional relationships between them were determined from previous systematic reviews of cognitive function in bipolar disorder,Reference Cullen, Ward, Graham, Deary, Pell and Smith3,Reference Bourne, Aydemir, Balanzá-Martinez, Bora, Brissos and Cavanagh5,Reference Arts, Jabben, Krabbendam and van Os17–Reference Samamé, Martino and Strejilevich24 as well as general background knowledge and assumptions regarding other shared causes that it was necessary to depict in order for the DAG to have a causal interpretation.Reference Elwert and Morgan16 The fit of the DAG to the data was then evaluated by estimating partial correlation coefficients for each pair of nodes that were predicted to be independent. Detection of a correlation between nodes that were predicted to be independent may indicate that the DAG has been misspecified. Where the results indicated lack of independence (i.e. partial correlation coefficient >|0.1|Reference Kline25), follow-up regression models were conducted to obtain further detail. Modifications to the structure of the DAG were then considered. A detailed account of the construction and evaluation of the DAG is provided in the supplementary Methods.
The DAG used in the major depression analyses was based on the final DAG used in the mania/bipolar disorder analyses, with an arrow added from gender to major depression; studies have consistently shown higher prevalence of depression in women,Reference Parker and Brotchie26 and it was assumed in the DAG that this relationship was at least partly causal. No arrows were removed compared with the mania/bipolar disorder DAG, on the assumption that similar causal relationships might be operating to explain cognitive impairment in both disorders.
Total effects
The total effect of each mood disorder exposure on cognitive performance was firstly identified in the DAGs using DAGitty software version 0.2-2 for R (Windows).Reference Textor, van der Zander, Gilthorpe, Liskiewicz and Ellison27 The DAGitty algorithm applies d-separation rulesReference Pearl, Glymour and Jewell8,Reference Pearl28 to find all the confounding paths between the exposure and the outcome and ascertains whether there is a set of nodes which, if conditioned on in the analysis, would ‘block’ these confounding paths. This information was then used to plan regression- and matching-based analyses to estimate the effect in the data-set. This was estimated separately for each of the five cognitive outcome measures, to allow for the possibility of task-specific variation in the results. Results are reported as standardised mean differences or risk differences with 95% CI. Further details of the estimation methods are given in the supplementary Methods.
Mediation analyses
The DAGs were used to assess whether indirect effects via various mediators of interest could be identified. This required all confounding paths between the exposure and the mediator and between the mediator and the outcome to be blocked, as well as those between the exposure and the outcome. Where this requirement was satisfied (i.e. covariate adjustment sets could be found), G-computation was used to estimate the natural direct and indirect effects.Reference De Stavola, Daniel, Ploubidis and Micali29 This was implemented using the Stata package gformula version 1 (2011) for Windows;Reference Daniel, De Stavola and Cousens30 gformula permits mediation analysis in the presence of intermediate confounding, whereby a mediator–outcome confounder is itself caused by the exposure. Results are reported as standardised mean differences or risk differences with 95% CI.
Sensitivity analyses
Additional analyses were conducted to evaluate the sensitivity of the results to various potential sources of bias, including residual confounding, missing data and exposure misclassification (see supplementary Methods). These informed our interpretation with regard to key threats to the validity of the analytic framework.
Reporting follows STROBE guidelines.Reference von Elm, Altman, Egger, Pocock, Gøtzsche and Vandenbroucke31
Data availability
The corresponding author had full access to the original UK Biobank data and the derived data generated while conducting this study. UK Biobank is an open access resource. Data are available to bona fide scientists, undertaking health-related research that is in the public good. Access procedures are described at http://www.ukbiobank.ac.uk/using-the-resource/.
Results
Cognitive impairment in mania/bipolar disorder
Characteristics of the sample
Supplementary Fig. 2 shows a flowchart of exclusions leading to the final analysis sample, which comprised 2709 participants with mania/bipolar disorder and 105 284 comparison participants. The descriptive results indicated worse cognitive performance and less favourable covariate characteristics in the mania/bipolar disorder group, although they were younger on average and more likely to have a university/college degree (Table 1 and supplementary Table 5).
Table 1 Summary of cognitive outcome measures in the mania/bipolar disorder and comparison groups

a. Participants with complete data on all the covariates that were entered into the maximally adjusted total effects models (age, gender, White British genetic ancestry, English-speaking country of birth, university/college degree, comorbid neurological/psychiatric condition, family history of dementia, family history of Parkinson's disease, family history of severe depression, maternal smoking around birth, childhood trauma, education/cognition genome-wide polygenic score (GPS), bipolar disorder GPS).
b. Missing data refers only to the period when this measure was included in the battery.
c. No missing data.
Evaluation of the graphical model
The original DAG is shown and explained in the supplementary Methods. The different predicted independences implied by alternative plausible specifications of this DAG were tested (see supplementary Results for details). Supplementary Fig. 3 shows the best fitting DAG, which was used as the basis for the analysis models.
Total effects
Only the visuospatial memory test (Fig. 1) and, more equivocally, the prospective memory test (supplementary Fig. 4) indicated a detrimental effect of mania/bipolar disorder that remained evident in the multivariable models. The effect sizes were small: the mania/bipolar disorder group scored approximately 0.2 s.d. lower than the unexposed comparison group on the visuospatial memory test, and the proportion of the mania/bipolar disorder group succeeding on the prospective memory task was lower by approximately 5 percentage points (approximately 82% in the mania/bipolar disorder group versus 87% in the unexposed group). The visuospatial and prospective memory estimates showed little change between the unadjusted and adjusted/matched models, whereas the estimates for the other three cognitive measures generally attenuated towards the null (supplementary Figs 5–7).

Fig. 1 Total effect of mania/bipolar disorder on visuospatial memory.
Mediation analyses
Structural analysis of the DAG indicated that direct and indirect effects could be decomposed for two potentially modifiable mediators: cardiometabolic disease and psychotropic medication. Further details of these models are provided in the supplementary Results.
There was no evidence of substantive indirect effects via cardiometabolic disease in any of the models (supplementary Table 8).
There was evidence that the previously noted detrimental effect of mania/bipolar disorder on visuospatial memory was indirectly transmitted via psychotropic medication (supplementary Table 9). Of the estimated total effect of −0.19 s.d. units (95% CI −0.31 to −0.08), approximately one-quarter was mediated via psychotropic medication (−0.05; 95% CI −0.09 to −0.01). Indirect effects were also evident in the reasoning, reaction time and prospective memory models, although the total effects estimates in these models did not show reliable decrements for mania/bipolar disorder.
Sensitivity analyses
The results of the sensitivity analyses are provided in the supplementary Results. Briefly, these indicated that: the total effects results for visuospatial memory are likely to be sensitive to exposure misclassification and would not be robust to an unmeasured confounder with even a weak association with exposure group membership (leading to minimally unbalanced odds of exposure, i.e. 45/55); the total effects results showed less attenuation when missing covariate data were imputed; the mediation results with imputation of missing covariate data showed stronger evidence for an indirect effect via psychotropic medication, but no evidence of an indirect effect via cardiometabolic disease; the DAGitty algorithm determined that there were six other DAGs that were equivalent to the DAG shown in supplementary Fig. 3, but none of these alternative configurations was causally plausible.
Cognitive impairment in major depression
Characteristics of the sample
Supplementary Fig. 9 shows that the analysis sample comprised 50 975 participants with major depression and 102 931 comparison participants. Table 2 summarises their cognitive outcome data, and supplementary Table 12 summarises their covariate data.
Table 2 Summary of cognitive outcome measures in the major depression and comparison groups

a. Participants with complete data on all the covariates that were entered into the maximally adjusted total effects models (age, gender, White British genetic ancestry, English-speaking country of birth, university/college degree, comorbid neurological/psychiatric condition, family history of dementia, family history of Parkinson's disease, family history of severe depression, maternal smoking around birth, childhood trauma, education/cognition genome-wide polygenic score (GPS), major depression GPS).
b. Missing data refers only to the period when this measure was included in the battery.
c. No missing data.
Evaluation of the graphical model
The different predicted independences implied by alternative plausible specifications of the DAG were tested (see supplementary Results). The best fitting DAG followed the same structure as that used in the mania/bipolar disorder analysis, with the addition of a path between gender and major depression.
Total effects
Major depression was negatively associated with visuospatial memory performance in the multivariable models (Fig. 2). The effect size was very small, with the major depression group scoring approximately 0.07 s.d. lower than the comparison group. Group differences were not seen on the other cognitive measures (supplementary Figs 10–13).
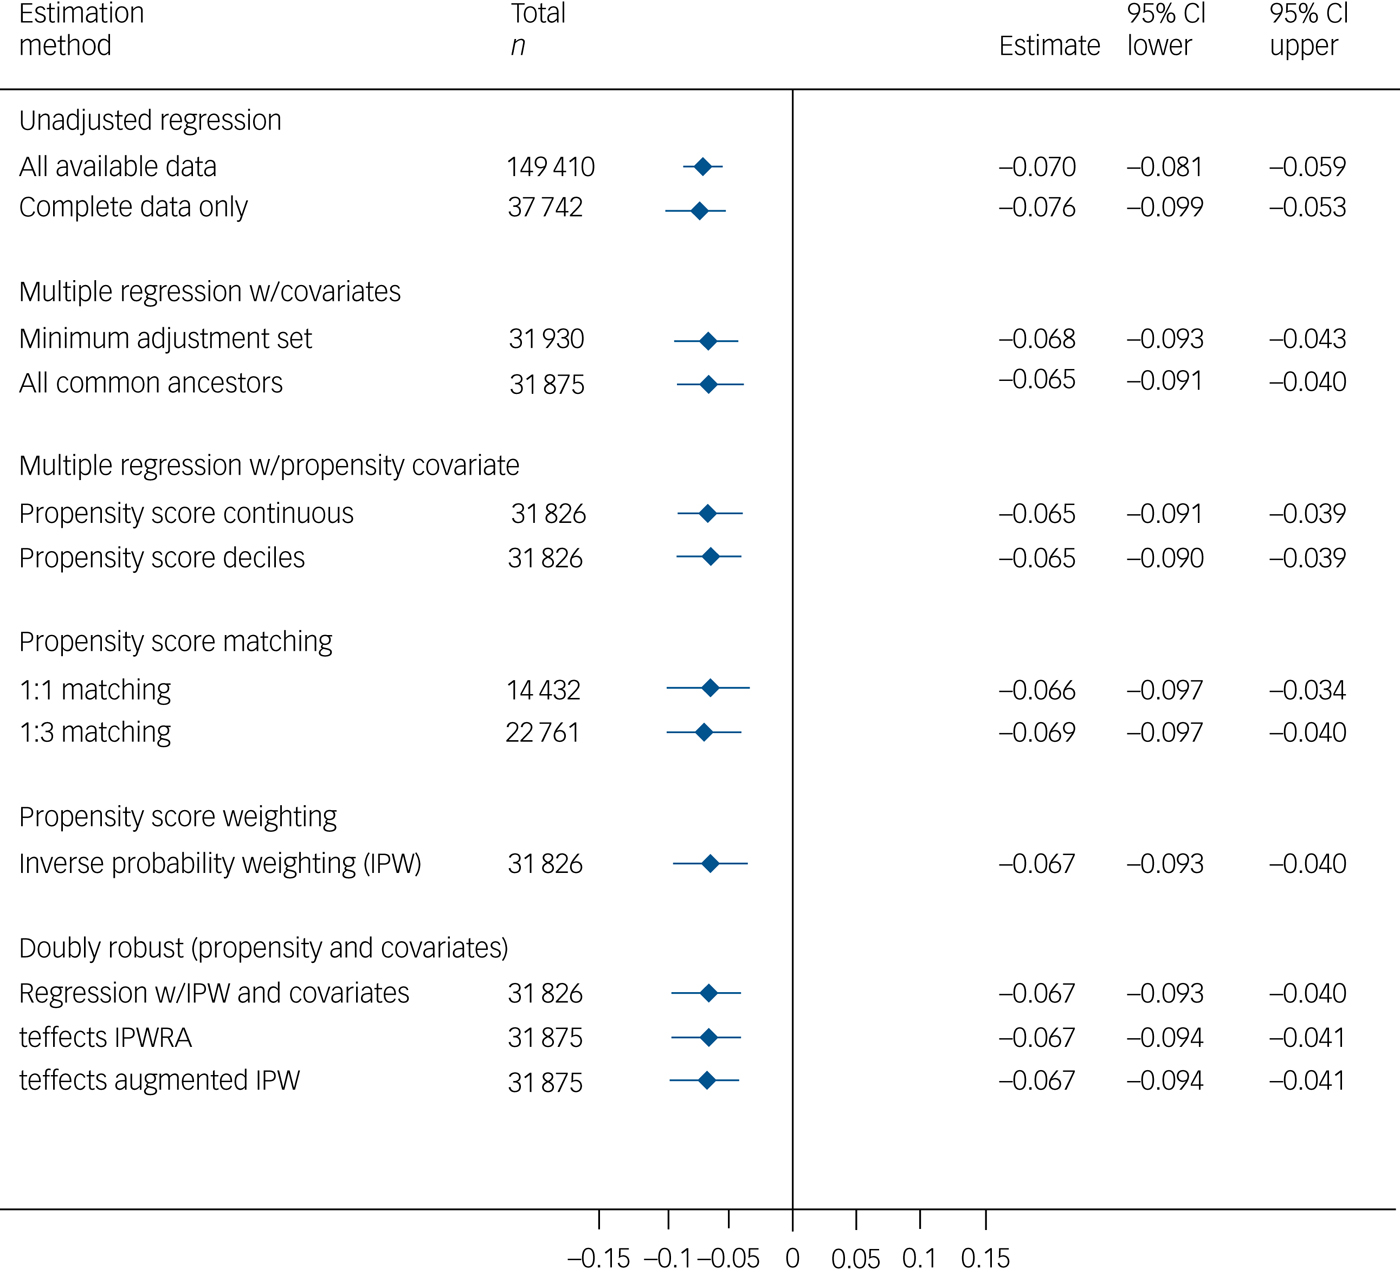
Fig. 2 Total effect of major depression on visuospatial memory.
Mediation analyses
As with the mania/bipolar disorder analyses, direct and indirect effects could be decomposed via cardiometabolic disease and via psychotropic medication (see supplementary Results). There was no evidence of substantive indirect effects via cardiometabolic disease in any of the models (supplementary Table 16). There was little evidence of mediation via psychotropic medication (supplementary Table 17): approximately one-third of the total effect on visuospatial memory (itself of very small magnitude, at −0.058) was estimated to be indirect, but the confidence interval included the null (−0.019; 95% CI −0.040 to 0.003).
Sensitivity analyses
The sensitivity analyses (see supplementary Results) indicated that: the total effects results for visuospatial memory are likely to be sensitive to exposure misclassification and would not be robust to an unmeasured confounder with even a very weak association with exposure group membership; the total effects results for reaction time showed less attenuation when missing covariate data were imputed; the mediation results with imputation of missing covariate data showed stronger evidence for an indirect effect via psychotropic medication, but no evidence of an indirect effect via cardiometabolic disease; there were six structurally equivalent DAGs but none was causally plausible.
Discussion
This study demonstrates small but robust associations between mood disorders and cognitive function in a large community-based sample, with rigorous confounder control based on extensively evaluated graphical models and analytical methods. A total effect of mania/bipolar disorder on cognitive function was evident on a test of short-term visuospatial memory, but not on other tests. The magnitude of this effect was small, with the point estimates across the various matched/adjusted models being in the range −0.23 to −0.17 s.d. units. There was evidence of an indirect effect through psychotropic medication, accounting for approximately one-quarter of the total effect, but (perhaps surprisingly) not through cardiometabolic disease. The total effect of major depression on cognitive performance followed a similar pattern to that of mania/bipolar disorder, although with an effect size of around one-third the magnitude. The proportion of the total effect mediated by psychotropic medication was similar to that in mania/bipolar disorder, but the confidence interval was wide and the estimate was reliably different from the null only after imputation of missing data. The effect estimates for both mood disorders are likely to be sensitive to residual confounding and exposure misclassification, and they may be biased towards the null as a result of missing covariate data.
The complexity inherent in this area was acknowledged and addressed by developing and evaluating comprehensive graphical models and by incorporating a broad range of genetic, sociodemographic, environmental, lifestyle and clinical measures in the analyses. Model estimation was conducted in multiple ways, and quantitative and graphical sensitivity analyses were carried out to investigate the robustness of the results to key assumptions. The samples were substantially larger than those used in previous studies in the field, allowing small effect sizes to be estimated with precision.
The observed gradation in severity of impairment on the visuospatial memory task across mania/bipolar disorder and major depression is congruent with previous reports,Reference Szmulewicz, Valerio, Smith, Samame, Martino and Strejilevich7 although the magnitude of the difference compared with the non-mood-disorder group is notably smaller.Reference Arts, Jabben, Krabbendam and van Os17–Reference Bora, Yucel, Pantelis and Berk19,Reference Mann-Wrobel, Carreno and Dickinson22 The absence of group differences on the other cognitive tasks was surprising, in light of previous research showing multidomain impairments, and it remains unclear to what extent this reflects insufficient adjustment for confounding in previous studies, the characteristics of the UK Biobank cohort, or the possibility that memory performance is a particularly sensitive marker of cognitive function in mood disorders.
The results also contribute to the evidence base on the relationship between psychotropic medication and cognitive impairment, which has been repeatedly highlighted in previous studies.Reference Balanzá-Martínez, Selva, Martinez-Arán, Prickaerts, Salazar and González-Pinto32 Mediation analyses, taking account of intermediate confounders such as past depressive episodes, indicated that an appreciable proportion of the detrimental effect of mania/bipolar disorder on visuospatial memory performance was accounted for by this. The interplay between reasons for prescribing – especially of antipsychotic medications – and affective remission in understanding this relationship is not yet understood, but the present results appear to confirm that psychotropic medications warrant closer study as potential modifiable causes of cognitive impairment in mood disorders.
Limitations
The analyses were necessarily limited by the data collected in the UK Biobank resource: many of the measures were brief, key cognitive functions such as verbal memory were not assessed and clinician diagnoses were unavailable. The reliability of some of the cognitive measures is suboptimal.Reference Lyall, Cullen, Allerhand, Smith, Mackay and Evans14 This may cause imprecision in effect size estimates,Reference Hutcheon, Chiolero and Hanley33 but such imprecision is mitigated by the large sample in the present study. However, imprecision that is not due to random error could result in underestimated magnitudes of associations. The cognitive tests administered in UK Biobank may be less sensitive than the neuropsychological assessments used in clinical studies, which may partly account for the small group differences observed here. Assumptions about the temporal order of the variables could not be verified empirically. Conducting estimation one mediator at a time may lead to erroneous conclusions about the contribution of each mediator to the overall effect.Reference Vansteelandt and Daniel34 Possible collider stratification bias should be acknowledged;Reference Munafò, Tilling, Taylor, Evans and Smith35 it is likely that people with a history of less severe mood disorder and better cognitive function will have joined UK Biobank, and this will have been amplified further in the patterns of missingness across the cognitive outcome measures and the covariates. What is unknown, however, is the magnitude of the bias arising from collider stratification and how this compares with similar or opposing biases from residual confounding. The missing-at-random assumption that is required for multiple imputation is arguably not valid for some of the measures in these analyses, given the probability that, for example, missingness on mental health-related measures will be influenced by true mental health status. Finally, the UK Biobank cohort is not representative of the UK population; associations may be heterogeneous across other populations.Reference Fry, Littlejohns, Sudlow, Doherty, Adamska and Sprosen36
Conclusions and future directions
A small group difference in visuospatial memory performance was observed between mood disorder and comparison groups in this large general population cohort. Mediation analyses highlighted a potential causal pathway through psychotropic medication use. Our understanding of causal pathways towards cognitive impairment in psychiatric and neurological conditions will improve as the UK Biobank cohort is followed up over time and other prospective cohorts, such as the Avon Longitudinal Study of Parents and Children,Reference Boyd, Golding, Macleod, Lawlor, Fraser and Henderson37 mature into adulthood. The availability of a fuller range of background and intermediate data, including early life factors, premorbid cognitive ability measures and brain imaging, will expand the kinds of causal effects that can be identified in models such as those proposed here. Linkage with prescribing data will permit more detailed investigation of the role of different classes of psychotropic medication, and combinations thereof, in explaining adverse cognitive outcomes.
Supplementary material
Supplementary material is available online at https://doi.org/10.1192/bjp.2019.188.
Acknowledgements
This research has been conducted using the UK Biobank Resource under Application Number 11332 (principal investigator: B.C.). UK Biobank was established by the Wellcome Trust medical charity, Medical Research Council, Department of Health, Scottish Government and the Northwest Regional Development Agency. It has also had funding from the Welsh Government, British Heart Foundation, Cancer Research UK and Diabetes UK. We are grateful to Dr Carlos Celis Morales, Dr Nicholas Graham, Dr Daniel Mackay, Dr Daniel Martin, Dr Barbara Nicholl and Mr Joey Ward, University of Glasgow, for contributions to the data analysis.
Funding
This work was supported by the Scottish Executive Chief Scientist Office (B.C. – DTF/14/03); the Dr Mortimer and Theresa Sackler Foundation (J.J.E.); the Lister Institute of Preventive Medicine (D.J.S.); the Medical Research Council (D.J.S. – MC_PC_17217); and the cross-council Medical Research Council and Biotechnology and Biological Sciences Research Council Lifelong Health and Wellbeing Initiative (I.J.D. – MR/K026992/1). The funders had no role in the study design, analysis or interpretation of data, decision to publish or preparation of the manuscript.


eLetters
No eLetters have been published for this article.