


Obesity is one of the major causes of morbidity and mortality related to CVD, diabetes, cancer and many other chronic diseases( Reference Ng, Fleming and Robinson 1 ). Obesity has increased steadily over the past two decades, mainly affecting low-income communities and ethnic minorities( Reference Ng, Fleming and Robinson 1 , Reference Candib 2 ).
Immigrants are at particular risk of weight gain and acculturation in the host country seems to be responsible for it( Reference Fu and Van Landingham 3 ). The probability of being overweight/obese rises with increasing time of residence in the host country since longer residence reduces the differences between immigrants and natives in lifestyle, social norms, health practices, and health and disease profiles( Reference Lauderdale and Rathouz 4 ).
In addition to general obesity, central obesity (evaluated as waist circumference (WC) or waist-to-hip ratio (WHR)) is a well-established indicator of increased cardiovascular risk( Reference Huxley, Mendis and Zheleznyakov 5 ). Although limited information is available for immigrants, they seem to show a higher prevalence of generalized and central obesity than residents of their countries of origin( Reference Toselli, Gualdi-Russo and Boulos 6 , Reference Carlsson, Wändell and Riserus 7 ). Furthermore, the prevalence of generalized and central obesity is higher in immigrants than in host country natives( Reference Carlsson, Wändell and Riserus 7 ).
The perception of one’s body image has an important role in the aetiology of obesity since awareness of weight status is an important factor in weight-loss attempts( Reference Acevedo, López-Ejeda and Alférez-García 8 ). It is important to underline that differences in body size perception may depend on cultural and ethnic characteristics( Reference Dorsey, Eberhardt and Ogden 9 ). Ethnic minorities often misperceive their overweight/obesity( Reference Duncan, Wolin and Sharoun-Lee 10 ). Hence these groups may not be motivated to improve their diet or increase physical activity, leading to a higher health risk. This trend, however, may vary as a result of differences in ethnicity, gender, age at the time of migration and period of residency in the new country( Reference Calzada and Anderson-Worts 11 ). Some non-Western immigrants in Europe have conformed to the body size ideals of their host culture, which puts them at risk of body dissatisfaction( Reference Nicolaou, Doak and van Dam 12 , Reference Swami, Mada and Tovée 13 ).
The aim of the present study was to investigate differences between North African (NA) immigrant women in Italy and both NA residents in their countries of origin and Italian natives in regard to: (i) the prevalence of obesity and fat distribution (generalized, central and peripheral fatness); and (ii) body image perception and preferences. The results could be used to identify the health risks of immigrants and the possible causes, in order to facilitate early preventive efforts.
Methods
Participants and study design
A survey of 463 women belonging to four sub-samples was carried out from June 2013 to January 2015 in Italy and North Africa: (i) NA immigrants; (ii) Italian natives; (iii) Moroccan residents; and (iv) Tunisian residents. The anthropometric survey and assessment of body perception for NA immigrants and Italian natives were performed in Bologna and Ferrara (Emilia-Romagna region, northern Italy) at public health clinics (gynaecological surgeries) or, for immigrants only, at community centres where they used to meet. The NA resident women were recruited at public health or social centres in Tunis (Tunisia) and Casablanca (Morocco) in accordance with local ethics regulations.
Ethnic origin was based on the participant’s country of birth and it was self-reported. Immigrant women born in NA countries aged 18–60 years and residing in Emilia-Romagna region (northern Italy) for at least 2 years were included in the study. They were all first-generation immigrants and their mean duration of living in Italy was 9·2 (sd 6·16) years. Pregnant women and those with missing information on body image perception were excluded from the study. Of a sample of 117 immigrant women, 105 fulfilled the selection criteria. The final immigrant sub-sample included 85·7 % Moroccans, 7·6 % Tunisians and 6·7 % women from other countries (Algeria, Egypt).
In accordance with the adopted criteria (non-pregnant, within the age range, no missing information), a sub-sample of 100 native Italian women (out of 103) was selected as a control. Of the 138 Moroccan women living in Morocco and 105 Tunisian women living in Tunisia surveyed in January and February 2014, 124 Moroccans and 104 Tunisians met the selection criteria.
All participants gave informed consent and filled in a brief questionnaire (available in Italian and Arabic), including questions about demographic characteristics (age, marital status, number of pregnancies), migration status (years since immigration) and educational level. Interviews were held face-to-face by female interviewers (in North Africa, ones of the same ethnicity as the interviewees). In Italy the presence of a cultural mediator was provided when necessary.
At the end of the selection process, the total sample consisted of 433 women (93 %).
Measurements
Anthropometric measurements
Height was measured to the nearest 0·1 cm using an anthropometer (GPM, Switzerland). Body weight was measured to the nearest 0·1 kg (light indoor clothing, without shoes) using a calibrated electronic scale. BMI was calculated as weight (in kilograms) divided by the square of height (in metres). This index was used to assess the weight status of each participant according to WHO cut-off points( 14 ), classifying women as underweight, normal weight, overweight and obese. Triceps skinfold thickness (TSF) was measured to the nearest 0·1 cm on the left side( Reference Weiner and Lourie 15 ) with a Lange calliper (Beta Technology Inc., USA). WC and hip circumference (HC) were measured to the nearest 0·1 cm with a non-stretchable tape: WC was measured between the lowest rib and the iliac crest and HC at the widest part of the hip. Mid upper-arm circumference (MUAC) was measured to the nearest 0·1 cm with a non-stretchable tape on the left side at the level of the TSF. Additional information on the anthropometric measurements was reported previously( Reference Rinaldo and Gualdi-Russo 16 ). WHR was computed as WC/HC. The total upper-arm area (TUA), upper-arm muscle area (UMA), upper-arm fat area (UFA) and arm fat index (AFI) were computed from measurements of MUAC and TSF( Reference Frisancho 17 ).
Body image perception
We used nine silhouette drawings of female figures of varying fatness( Reference Thompson and Gray 18 ) to assess both the perceived and desired body image.
The discrepancy score FID (feel minus ideal difference)( Reference Mciza, Goedecke and Steyn 19 ) was calculated by subtracting the ideal from the perceived silhouette: a score of zero indicates no discrepancy; a positive score that the perceived figure is bigger than the ideal; and a negative score that the perceived figure is thinner than the ideal. In the last two cases, the extent of discrepancy represents the degree of dissatisfaction in body image perception.
Improper perception of weight status was evaluated by the new index, FAI (feel status minus actual status inconsistency)( Reference Zaccagni, Masotti and Donati 20 ). Extending the proposed method to the schematic figures with graduated increments between adjacent sizes developed by Thompson and Gray( Reference Thompson and Gray 18 ), we calculated the inconsistency score FAI by subtracting the conventional code assigned to the actual weight status of the participant (1=underweight; 2=normal weight; 3=overweight; 4=obese) from the code of her perceived figure (1=figures 1 and 2; 2=figures 3–5; 3=figures 6 and 7; 4=figures 8 and 9). An FAI score of zero indicates no inconsistency in weight status perception; a positive score that weight status is overestimated; and a negative score that weight status is underestimated.
Statistical analysis
The normality of variables was checked by the Shapiro–Wilk W test. Triceps skinfold values were logarithmically transformed (log10-based) before statistical comparisons.
Descriptive statistics were computed for each sub-sample (mean, standard deviation, frequency). Continuous and categorical data were analysed using the t test or ANOVA and the χ 2 test, respectively. Then comparisons between immigrant and native women and comparisons among immigrant women and women residing in Morocco and Tunisia were performed by ANCOVA, controlling for age. The Tukey post hoc test was used among ethnic groups.
Statistical analyses were performed using the statistical software package ‘Statistica’ for Windows, version 11·0 (StatSoft Italia srl, Padua, Italy). P<0·05 was considered as statistically significant.
Results
Sample characteristics
The sociodemographic characteristics of the participants, duration of living in Italy and some elements of their biological profile (age at menarche, number of pregnancies and children, etc.) are reported in Table 1. The mean number of children and number of pregnancies of immigrants in Italy were three times those of Italian natives and slightly higher than those of residents in Morocco. They were also three times higher than those of the Tunisian residents, who were however significantly younger. Nearly 90 % of the NA immigrant women were married and this value was much higher than in the other groups (with the lowest percentage in Italian natives). Their age at menarche was significantly higher than in all the other sub-samples. The educational level of immigrants was relatively low compared with Italian natives: more than half of the immigrant women had attended primary or junior school or had no education at all, showing the highest rates of illiteracy also in comparison to the NA residents. Likewise, the NA immigrants had a much lower rate of university education than the Tunisian and Moroccan residents and especially the Italian natives. Approximately 80 % of immigrants were unemployed (or homemakers) compared with less than 10 % of unemployment in Italians (the lowest percentage).
Table 1 Sociodemographic and biological characteristics and nutritional status (prevalence of BMI categories) by ethnic group: women aged 18–60 years (Italians, n 100; North African (NA) immigrants, n 105; Tunisians, n 104; Moroccans, n 124), Italy and North Africa, June 2013–January 2015

* Comparisons performed using the t test.
† Comparisons performed using ANOVA.
‡ Comparisons performed using the χ 2 test.
Almost all of the NA immigrant women reported that they were non-smokers, while a third of the Italian sub-sample consisted of smokers. In the few smokers in the immigrant sub-sample, there was a later start to smoking (mean onset age: 21·7 (sd 5·12) years) and a lower average consumption (mean cigarettes/d: 8·2 (sd 6·09)) compared with the Italian natives (mean onset age: 19·2 (sd 5·43) years; mean cigarettes/d: 9·3 (sd 5·43)) and Tunisians (mean onset age: 19·6 (sd 6·94) years; mean cigarettes/d: 11·1 (sd 10·0)).
The highest prevalence of overweight/obesity was observed in immigrants (79·8 %), followed by Moroccans (61·3 %) and Tunisians (50·5 %; Table 1). Italian women had the lowest prevalence (26·0 %). There was also a total lack of underweight participants among the immigrants, unlike in the other groups. The differences were statistically significant.
Differences in anthropometric characteristics/indices and in body image perception
The sub-sample characteristics and results of the ANCOVA are presented in Tables 2 and 3. Table 2 shows the anthropometric characteristics of NA immigrants and Italian natives based on measured data. NA immigrants differed significantly from Italians in all anthropometric traits and indices except height, showing higher general (BMI), central (WHR, WC) and peripheral (AFI) fatness. The immigrant women also had greater weight, BMI, HC and MUAC than the NA residents (Table 3). By contrast, there are no significant differences in weight and WHR between immigrants and NA residents. The immigrants had a more developed TUA, UMA and less percentage fat in the upper arm (AFI) than the NA residents. Their TSF was thinner compared with Moroccan women.
Table 2 Anthropometric traits and body image perception characteristics by ethnic group: women aged 18–60 years (Italians, n 100; North African (NA) immigrants, n 105), Italy, June 2013–January 2015
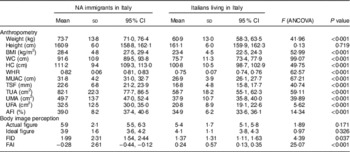
WC, waist circumference; HC, hip circumference; WHR, waist-to-hip-ratio; MUAC, mid upper-arm circumference; TSF, triceps skinfold thickness; TUA, total upper-arm area; UMA, upper-arm muscle area; UFA, upper-arm fat area; AFI, arm fat index; FID, feel minus ideal difference; FAI, feel status minus actual status inconsistency.
Table 3 Anthropometric traits and body image perception characteristics by ethnic group: women aged 18–60 years (North African (NA) immigrants, n 105; Tunisians, n 104; Moroccans, n 124), Italy and North Africa, June 2013–January 2015

WC, waist circumference; HC, hip circumference; WHR, waist-to-hip-ratio; MUAC, mid upper-arm circumference; TSF, triceps skinfold thickness; TUA, total upper-arm area; UMA, upper-arm muscle area; UFA, upper-arm fat area; AFI, arm fat index; FID, feel minus ideal difference; FAI, feel status minus actual status inconsistency.
Tables 2 and 3 also show the results of the body image perception assessment. There were no significant differences in perceived figure among immigrants and Italians or NA residents. The immigrants would prefer to be significantly leaner than the Moroccans. The immigrants had a significantly higher FID value than the Italian natives, meaning that they were more dissatisfied with their body image. The mean FAI values indicate a tendency to overestimation of weight in the Italians (positive value), underestimation in the immigrants and Tunisians (negative values) and a realistic perception in the Moroccans (zero value). All these differences among the sub-samples reached statistical significance.
Among overweight/obese participants (Table 4), the immigrants’ perceived and ideal figures had the lowest values, differing significantly from the Italian and NA resident women for ideal figure. A significantly lower FAI value was observed only for immigrants compared with Italians, meaning greater underestimation of weight in immigrants.
Table 4 Body image perception characteristics of overweight/obese participants (BMI ≥ 25 kg/m2) by ethnic group: women aged 18–60 years (Italians, n 100; North African (NA) immigrants, n 105; Tunisians, n 104; Moroccans, n 124), Italy and North Africa, June 2013–January 2015

FID, feel minus ideal difference; FAI, feel status minus actual status inconsistency.
Discussion
There is a paucity of data on the nutritional status and body image perception of immigrant women in Europe, despite the high rate of migration to this continent. It was estimated that 3874726 non-EU citizens were regularly present in Italy on 1 January 2014. Morocco and Tunisia are among the top ten countries with immigrants in Italy( 21 ), with females representing 44·1 % of the Moroccans and 36·5 % of the Tunisians. To our knowledge, the present study, part of a larger project on NA immigrants, is the first carried out in Italy to compare body size, anthropometric traits and body image perception of immigrant women from North Africa with those of women still living in North Africa and women native to the host country (Italy).
Non-Western immigrants tend to acquire the typical dietary habits and disease patterns of the host country( Reference Lesser, Gasevic and Lear 22 ). Poor health may be a consequence of genetic, biological, behavioural, environmental and socio-economic determinants( Reference Gushulak, Weekers and Macpherson 23 ). To prevent misinterpretation, the present study compared the immigrant sample not only with the local population, but also with those in their countries of origin.
Over three-quarters of the immigrant women in the present study were above the BMI cut-off for overweight. This value is very similar to the prevalence of overweight/obesity recorded in Moroccan immigrant women in the Netherlands (78 %)( Reference Dijkshoorn, Nierkens and Nicolaou 24 ). The groups compared in the present study were unevenly distributed in terms of education, working status and smoking habits: NA immigrant and NA resident women showed a lower level of education and higher unemployment than Italian women; the percentage of smokers was low in immigrants and Moroccans, but increased in Tunisians and especially Italians. The mean age of the groups was also significantly different. The high prevalence of obesity in immigrants with respect to Italian natives could be due not only to the age difference but also their socio-economic conditions, diet and genetic characteristics, all of which should be investigated further.
After adjustment for age differences, the immigrant women had more generalized (BMI) and central fatness (WC, WHR) than Italian natives. Anthropometric measurements indicating abdominal adiposity, such as WC (positively correlated with visceral adipose tissue)( 25 ), have been identified as predictors of CVD and diabetes risk( Reference Huxley, Mendis and Zheleznyakov 5 , Reference Zimmet and Alberti 26 , Reference Seidell 27 ). Based on a WHO report( 14 ), this NA sub-sample was above the female cut-off for WC, suggesting a substantially increased risk of metabolic complications (cut-off for WC, >88 cm). However, its mean WHR was below the cut-off that indicates increased health risk for women( Reference Lean and Han 28 ), while its UMA was significantly higher than in Italians, with mean values above the 75th percentile of standards based on the Third National Health and Nutrition Examination Survey (NHANES III)( Reference Frisancho 17 ). UFA and AFI were around the 50th percentile. Weight, BMI and MUAC were higher and AFI lower than in the other sub-samples of NA residents.
An original aspect of our study is the additional analysis of peripheral fatness (upper-arm measurements and indices) to complete the assessment of weight status among immigrants: the muscle area of their upper arm was much greater and the percentage of upper-arm fat much lower than would be expected from their BMI values. Hence the overweight/obesity status of these immigrants should not be based only on BMI: overweight may be only partially caused by increased adiposity, since an increase of the muscular component would contribute to the general weight increase in the immigrant sub-sample. However, caution is necessary in anthropometric estimates of muscle area among obese individuals since overestimation of muscle area seems to increase with the degree of adiposity( Reference Forbes, Brown and Griffiths 29 ). The prevalence of obesity is high in the immigrants and an anthropometric overestimation cannot be excluded, even though literature reports suggest that the overestimation is particularly evident in those whose TSF is above the 85th percentile (considering age and sex). In our study the sample of NA immigrant women fell well below this percentile (50th, according to Frisancho( Reference Frisancho 17 )). The greater muscularity of the immigrants with respect to the NA residents may be linked to a more active lifestyle in the host country with a probable involvement in hard manual work activities. Even while stating that they are unemployed, many of them are probably involved in irregular work( 30 ). We can also speculate that the women who migrated from North Africa had a healthier body build than the women living in North Africa: thus the sample may be affected by the ‘healthy migrant effect‘( Reference Lauderdale and Rathouz 4 ) caused by a positive selection bias due to rigorous pre-migration health checks( Reference Delavari, Sønderlund and Swinburn 31 ). The same adverse conditions that led them to migrate must have had an influence on their growth, biological maturation and biological characteristics( Reference Gualdi-Russo, Toselli and Masotti 32 ). The age at menarche, significantly higher in immigrants than in NA residents, shows an apparently different trend from literature data indicating precocious puberty in foreign children moving from developing countries to Europe( Reference Montero, Bernis and Loukid 33 ), with a low median age at menarche in African girls( Reference Talma, Schönbeck and van Dommelen 34 ) being a positive response to improved environmental conditions( Reference Gualdi-Russo, Toselli and Masotti 32 ). However, the NA immigrants in our study spent their childhood and adolescence in their country of origin, living in low-income, disadvantaged conditions with possible effects (slowdown) on their growth and development( Reference Tanner 35 ). Further analyses of body composition parameters and reported physical activity in the NA immigrant women are in progress. This may help to clarify the particular findings highlighted in the present study.
Although overweight/obesity of women is favourably considered in NA countries( Reference Rguibi and Belahsen 36 ), there was no preference for a large figure in either the NA immigrants or residents that we surveyed. Consistent with other studies( Reference Nicolaou, Benjelloun and Stronks 37 ), the NA immigrants expressed a clear preference for a ‘thin’ body image, in a similar manner to the Italian natives and NA residents. However, despite the tendency to underestimate their weight status, they had a greater dissatisfaction with body image perception than Italians. A different pattern was found among African-American women, who were more satisfied with their body even if they weighed more than Caucasians( Reference Demarest 38 ). Unlike Moroccan immigrant women in the Netherlands( Reference Nicolaou, Benjelloun and Stronks 37 ), the NA immigrants in Italy showed no shift in body size preferences with respect to the NA residents, but only a stronger desire to be thinner in accordance with Western ideals.
Our study also points out the effectiveness of simple measures of the upper arm in highlighting the particular body composition of the immigrants: the proposed measurements are even more valuable because they satisfy the need to analyse the distribution of fat/muscle without being disagreeable to these women, who are generally reluctant to undress for the anthropometric assessment. Our findings, confirming the contradictory indications provided by BMI( Reference Zaccagni, Barbieri and Gualdi-Russo 39 ) for the prediction of nutritional status and health risk, show that it is important to consider these indicators of fatness and muscularity to avoid misinterpretation of weight status when there is particularly strong muscular development. Arm anthropometry has already proved to be a more sensitive indicator than BMI in the case of inadequate nourishment( Reference Sala, Rossi and Antillon 40 ), so much so that MUAC and TSF have been proposed as acceptable ‘gold standard’ measures of nutritional status( Reference Sala, Rossi and Antillon 41 ). Their independence of ethnicity is another important requirement for their application( Reference Frisancho 42 ).
Therefore, although our study confirms the high prevalence of overweight/obesity in NA immigrants in Italy, it highlights for the first time that the high weight values are not due to a simple increase in fatness.
Since the present research included first-generation immigrants only, systematic monitoring of weight status in second-generation immigrants is recommended. Indeed previous studies in the Netherlands demonstrated that overweight was highly prevalent among Moroccan women, but a lower prevalence was observed among second-generation immigrants( Reference Hosper, Nierkens and Nicolaou 43 ).
The current study has several limitations and strengths. The significant difference in mean age among sub-samples was passed through the statistical analysis chosen. Reliable information was not available on the actual work performed by the immigrant women, because of the persistence in Italy of irregular work, nor on their income. As already mentioned, information on the origin of the immigrants from an urban or rural environment was not collected during the interviews. We do not even know if the women examined in Casablanca and Tunis really belonged to these urban environments. A larger sample of immigrants representing different NA countries (Tunisia, at least) would have been optimal. A strength of the study is that all participants were directly measured by the same trained anthropometrists, thus avoiding misreports inherent in self-reported data( Reference Dijkshoorn, Ujcic-Voortman and Viet 44 ).
Conclusion
To reduce health risks, public intervention programmes must be established to check the nutritional status of immigrants by means of appropriate tools such as direct anthropometric measurements.
Only the assessment of fat distribution and body composition can assure a correct interpretation of the experimental data and evaluation of the health risks according to gender, age and ethnicity.
Therefore, in addition to the assessment of central fatness, we recommend the upper-arm measurements used in the current survey as immediate indicators of body composition. A combination of a few anthropometric measurements could increase the possibility of effective assessment of nutritional status and relative disease risk in order to identify immigrants at high metabolic risk who require interventions, especially in countries experiencing emergency immigration conditions.
The first-generation NA immigrant women preferred a thin physique (confirmed to a lesser extent in the NA residents). Their ideal figure was even thinner than that of the Italian natives. These results, if confirmed by other studies, will reassure us about the effectiveness of weight-control interventions in the case of excess adiposity. However, the high level of dissatisfaction of these women with their body image must be kept under control.
Acknowledgements
Acknowledgements: The authors thank the study participants; staff from the Health Care Centre for foreign women and their children (AUSL, Bologna, Italy), Centro di Mediazione and Centro Elefante Blu (Ferrara Municipality); and Anna Sapigni, Tullio Monini, Edgardo Canducci, Maria Giovanna Caccialupi, Greta Aristidi, Hassène Kassar, Hajer Ben Hamza and Yassine Zouheir for their contribution to the fieldwork. Financial support: This study was supported by the EU 7th Framework Programme 2007–2013 (grant number 260715). The funder had no role in the design, analysis or writing of this article. Conflict of interest: None. Authorship: E.G.-R. and S.T. contributed to the conception and design of the study, the interpretation of the results and wrote the manuscript. N.R. contributed to data collection and conducted the analyses. M.K. and C.L. contributed to the data collection and reviewed/edited the manuscript. All co-authors contributed to interpreting the results, and have read and approved the final version. Ethics of human subject participation: This study was conducted according to the guidelines laid down in the Declaration of Helsinki and all procedures involving human subjects were approved by the Independent Ethics Committee, Azienda Unità Sanitaria Locale (AUSL), Bologna, Italy. Written informed consent was obtained from all participants.


