Nutritional recommendations, the identification of what food should be comprised of, in both qualitative and quantitative terms, are at the heart of nutritional science. This can involve recommendations about foods and diets, individual nutrients or some combination of both. Discussions in this area are seldom without some degree of controversy and protein is an exemplar of the difficulties and debates which can occur.
In terms of food-based dietary guidelines, protein is at the heart of the debate on animal-source foods (ASF) v. vegetarian foods given that most ASF are high-protein foods(Reference Millward and Garnett1). For protein and its constituent amino acids, deciding on appropriate values for recommended intakes remains difficult in terms of both responses to international consensus statements about recommended intakes and various attempts to better define such intakes(Reference Millward2, Reference Millward3). One reason for such controversies is that identifying protein and amino acid requirements is an inherently difficult problem. The amount and type of dietary protein needed to allow optimal expression of the genome during growth and development remain poorly understood. Even the question of the nature and consequences of protein deficiency has proved controversial. For example, clinical manifestations long thought to reflect a protein-deficient diet, such as oedematous infantile malnutrition, have now been redefined as a reductive adaptation(4) to a combination of infection and micronutrient deficiency(Reference Golden5). Also there are virtually no effective markers of protein deficiency in adults(Reference Millward6). At the other end of the spectrum of public health issues, within health clubs worldwide more money is spent on protein and amino acid supplements than on any other ergogenic aid, even though the effectiveness of such expense is poorly documented to say the least(Reference Millward7, Reference Millward, Bowtell and Pacy8).
Values for protein and amino acid requirements derive from human and animal nitrogen balance and growth studies which began early in the 20th century and identified both estimates of dietary requirements and the pattern of amino acid essentiality(Reference Millward2, Reference Millward3). From the 1970s research expanded into protein and amino acid metabolism and turnover, much of it emanating from the work of John Waterlow and his students in the UK(Reference Millward and Stephen9) and Nevin Scrimshaw, Hamish Munro, Vernon Young and their colleagues and students in the USA(Reference Millward10). The development of stable isotope tracers allowed for the extension of such work to studies in human subjects ranging from newborn infants to the elderly. This work has provided insight into the regulation of protein synthesis, proteolysis, and amino acid and nitrogen metabolism in terms of quite detailed accounts of signal transduction pathways and their effectors(Reference Millward11). However, the most recent expert committee tasked with updating human protein and amino acid requirements(12) concluded from its evaluation of the methodologies available that: (i) the only method available for estimating the requirement for total protein (nitrogen) is by nitrogen balance; and (ii) at present, no method is entirely reliable for determining the dietary requirement for indispensable amino acids. Because of these limitations, the latest recommendations for protein and amino acid requirements are not entirely satisfactory(Reference Millward2) and the nature and limitations of protein requirement values are by no means widely understood.
One particular aspect of the long-running concern about protein requirements is their expression in terms of P:E ratio or P:E%, the ratio of protein, expressed as its energy content, to the energy requirement. The use of the P:E ratio was reviewed in the recent expert report(12) and it was emphasized that such use requires great care. Here, some of the issues associated with the use of the P:E ratio will be summarized, including the use of P:E ratios as measures of protein content and dietary quality and the derivation, interpretation and application of reference P:E ratios.
P:E ratios as a measure of the protein content of foods and diets
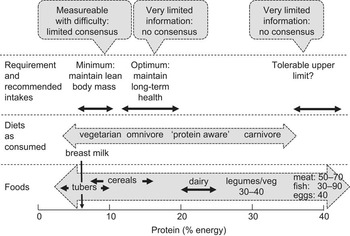
Typical values for the P:E ratios (expressed as P:E%) of foods and diets as consumed are shown in Fig. 1. In the case of individual foods, values range from only a few per cent for some starchy root staples such as cassava (3–4 %) to over 90 % for white fish fillets. However, the P:E% of individual foods can be misleading in terms of the importance of foods as dietary protein sources without taking into account: (i) their energy density (kJ/g), which determines the magnitude of their potential contribution to overall dietary energy intake; and (ii) population group energy demands. For example, breast milk has a low P:E% (6–7 %) but it is sufficiently energy dense, because of its high fat content, to meet the high energy demands when consumed as a sole food in volumes tolerated by the infant. Such volumes will also meet the high protein demands. In contrast, starchy roots or cereals with similar or even much higher P:E% (see Fig. 1) are less energy dense as edible foods or porridges and the infant is unable to consume sufficient to meet energy demands because the food intake is limited by its bulk. Because of this such foods cannot meet protein demands. Cow's milk has a similar energy density to human milk but a higher P:E% (18–19 %) and will provide protein markedly in excess of demands of infants and older children. Legumes and especially green leafy vegetables are relatively protein dense in terms of P:E% but have a low energy density and could never be consumed in sufficient amounts to meet the protein demand. In contrast, meat, fish and eggs can be sufficiently energy dense to meet energy needs but as sole foods would provide potentially toxic protein intakes.
Fig. 1 Protein in foods and diets and the recommended intake expressed in relation to energy
For diets, P:E% will reflect the balance among the food groups consumed. As shown in Fig. 1, man appears able to adapt to varying protein intakes and consequent dietary P:E% over a very wide range, with many diets providing protein intakes in excess of the minimum protein requirement. The one potential exception to this is the newborn infant, where protein intakes from breast milk do appear to match quite closely current best estimates of the protein intakes. The low levels or absence of ASF in a vegetarian diet result in generally lower P:E% than in omnivorous diets, although variation in dietary fat intake, which can vary directly with ASF intake, will tend to minimize such differences. Thus population studies in China, Japan, the UK and the USA indicate that variation in the proportion of ASF protein from 20 % in the Chinese diet to 66 % in the US diet increased the overall P:E% from 12·4 % to 15·5 %(Reference Elliott, Stamler and Dyer13). This increase would have been greater had it not been for the much greater fat intake as a percentage of energy in the USA (33 % of energy) compared with China (20 % of energy)(Reference Elliott, Stamler and Dyer13). Indeed, given that the P:E% of cereals such as hard wheat can be up to 16 %, low-fat, high-wheat diets have the potential for dietary P:E% which overlap with ASF-containing diets. At the lower extreme, relatively unsupplemented diets based on cassava or other low-protein starchy roots and tubers such as taro, sweet potato and yams can result in very low values, i.e. <5 %.
Judging by the wide availability and presumed consumption of protein supplements among many athletes and health-club habitués, many of these ‘protein-aware’ individuals are likely to exhibit much higher than average protein intakes. Since such population groups may also choose low-fat diets, they can achieve, in our experience, P:E% approaching 30 %(Reference Millward, Bowtell and Pacy8). Carnivorous population groups such as the traditional Inuit and some other hunter–gatherer societies consume diets with a relatively high P:E%, although consumption of the carcass fat can enable the protein intakes to stay within tolerable limits. As identified in the recent protein report(12), the tolerable upper limit to dietary protein intakes may be at a P:E% of about 40 % as indicated by reports of an inability of adults to tolerate diets comprising just lean meat.
Protein-quality-adjusted P:E% of the diet as a measure of dietary quality
The P:E% of the diets shown in Fig. 1 is a simple measure of dietary composition in terms of the protein concentration and is calculated without any consideration of what the metabolic fate of the utilized dietary protein will be in terms of either meeting the metabolic demands for amino acids or serving as a source of dietary energy. The use of this value as an expression of dietary protein quality requires some adjustments to the simple value. The available protein in food is determined by the food intake, the protein density (P:E%) and the protein quality in terms of both digestibility and biological value (BV). The lower digestibility usually observed with plant-derived foods(Reference Millward14) will reduce the amino acids available for metabolism. BV (retained nitrogen/absorbed nitrogen) is a function of the amino acid score(Reference Millward14), calculated from the absorbed amino acid pattern in relation to the amino acid pattern of the metabolic demands of the body. Any amino acid inadequacy indicated by an amino acid score less than 1 will lower the efficiency of utilization of food protein by the body. In practice the main potential problem in terms of amino acid score is posed by cereal-based diets because of their low lysine content. This means that the available P:E% of such diets will be, to a variable extent, lower than the measured P:E% of foods as consumed because of the poorer digestibility and low lysine content.
An extensive literature (e.g. Platt et al.(Reference Platt, Miller and Payne15), Hegsted(Reference Hegsted16)) describes the development of measures of dietary protein quality derived from the net protein utilization (NPU) value, a function of dietary protein digestibility and BV in terms of amino acid pattern. When assessed in feeding studies over a limited lower range of dietary protein concentrations, a standardized NPU value for dietary proteins or protein mixtures can be obtained that can then be used to adjust the crude P:E%, giving the net dietary protein calories per cent, i.e. the nDPcals%(Reference Platt, Miller and Payne15). After considerable debate about the derivation and interpretation of these values, and with direct assessment of NPU in human nitrogen balance trials proving very difficult(Reference Millward, Jackson and Price17), it was recommended(18, 19) that dietary protein quality should be predicted instead from a protein-digestibility-corrected amino acid score: the PDCAAS value. This is in effect a predicted NPU value. Specific amino acid scoring patterns derived for infants, children and adults with a factorial method based on patterns for maintenance (the adult amino acid requirement pattern) and growth (the tissue amino acid pattern) have now been recommended(12). Thus for human diets, variation in protein-quality-adjusted protein content, i.e. the amount of available protein in relation to the energy content of a food protein or diet, is predicted as an age-dependent PDCAAS-adjusted P:E%(12). This is calculated as:
Although the amino acid requirement is taken into account in calculating the PDCAAS value (i.e. the appropriate scoring pattern for the age group is used), the protein-quality-adjusted dietary P:E% is calculated without any consideration of what the metabolic fate of the utilized dietary protein will be in terms of either meeting the metabolic demands for amino acids or serving as a source of dietary energy, which would be the case for most high-protein diets. However, if such values are to be useful, it is necessary to derive comparable reference P:E values for the protein requirement, so that the adequacy of diets can be evaluated for individuals and different population groups. In the recent protein report(12) which drew heavily on a background paper that had been prepared during the course of the expert review(Reference Millward and Jackson20), it was stated that while reference P:E values can be very useful, the issues involved are complicated, so that care is required in both calculating and using such values.
Derivation of a reference P:E value of the protein requirement
The concept behind the use of a reference P:E value to judge the adequacy of the PDCAAS-adjusted dietary P:E value is that protein intake is determined firstly by overall food intake, mainly a function of appetite mechanisms which regulate energy intakes to match energy expenditure, and secondly by the protein or nutrient concentration in the food. This means that the P:Erequirement value will equate to the composition of a food which will meet protein needs at intakes which meet energy needs.
While the magnitude of the energy requirement for individuals and population groups is conceptually and physiologically straightforward in most cases, with a consensus agreement in its derivation by means of a factorial model involving BMR × physical activity level (PAL)(21, Reference Millward22), there is only a limited consensus over the magnitude of the protein requirement. The protein requirement is currently defined in the recent protein report(12) as: ‘the lowest level of dietary protein intake that will balance the losses of nitrogen from the body, and thus maintain the body protein mass, in persons at energy balance with modest levels of physical activity, plus, in children or in pregnant or lactating women, the needs associated with the deposition of tissues or the secretion of milk at rates consistent with good health’. Current values have been derived from nitrogen balance studies in adults as a measure of the maintenance requirement for all ages, with additions for special needs for protein deposition in childhood, pregnancy and lactation. From a metabolic perspective this minimum maintenance protein requirement (MPR) serves mainly to provide for irreversible amino acid use in non-protein pathways. Protein turnover recycles amino acids and does not necessarily contribute to irreversible amino acid consumption. The strengths and weaknesses of the currently accepted protein and amino acid requirement values have recently been reviewed elsewhere(Reference Millward2, Reference Millward3). As stated in Fig. 1, measurement of the MPR is very difficult and there is only a limited consensus on the extent to which values derived by nitrogen balance are appropriate (e.g. see Millward and Jackson(Reference Millward and Jackson23)). Several experienced investigators in the field have consistently argued that values of the MPR derived from nitrogen balance studies are likely to be lower than protein intakes which allow optimal muscle mass and function, especially in the elderly (e.g. Wolfe(Reference Wolfe24)), although admitting to a lack of convincing evidence to support such a claim. Indeed, the most recent studies of age and gender influences on protein requirements have confirmed the value of 0·66 g/kg per d for men and women of all ages identified in the protein report(Reference Campbell, Johnson and McCabe25), although these are nitrogen balance studies. The present author has shown that there are conceptual flaws in the analytical model used to interpret nitrogen balance studies(Reference Millward2) and that from the perspective of an adaptive metabolic demands model for the protein requirement(Reference Millward26), the true MPR is likely to be below the currently accepted value of 0·66 g/kg per d. However, the current value is a reasonable compromise which, in the context of judging the adequacy of diets, is unlikely to result in underestimates of protein deficiency. Thus for an individual adult for whom the energy requirement is known and with a protein requirement assumed to be the current Estimated Average Requirement (EAR) for protein, the required P:E % is:
At the current UK recommended population EAR for energy for an adult woman(21), calculated as BMR × 1·63 (PAL value), i.e. 8·7 MJ/d at 58·7 kg = 148 kJ/kg per d, the average P:Erequirement would be 7·4 %. For the newborn infant, with an average protein requirement estimated at 1·41 g/kg per d(12) and an energy requirement of 460 kJ/kg per d(21), the average P:Erequirement is 5·1 %.
However, the most likely use of P:Erequirement values is in examining diets to assess their adequacy for the population consuming them. In this case the appropriate P:E value is a population safe or reference value calculated to take into account: (i) inter-individual variation in the two requirement values; (ii) correlation between the protein and energy requirements; and (iii) variability in the intake values. In this case, as discussed elsewhere(12, Reference Millward and Jackson20), the calculation becomes more complicated and the population reference P:E value is considerably greater than the individual average values calculated above. An approximate value of a population safe, reference P:E value for adults is calculated as:
For infants and children, the calculated value corresponds to a protein value in the numerator of between 3sd and 4sd above the EAR. Thus for the average UK adult female population as identified above, the population reference P:E value would be 9·7 %. On the basis of the current UK recommendations for energy requirements(21), this value would be 8·9 % for the more active 75th centile of the assumed distribution of PAL values (PAL = 1·78) and 10·7 % for the less active 25th centile (PAL = 1·48).
The EAR for protein (as g/kg per d) as defined in the protein report is highest at birth, falls markedly in the first 2 years of life but changes only modestly after that and is assumed to be constant during adult life, regardless of age, gender or physical activity. In contrast, the high energy requirement (as kJ/kg) at birth falls throughout childhood and adolescence, falls further into old age, falls with increasing body weight, is lower in women than men because of their lower fat-free mass, and as already indicated above varies with lifestyle through variable physical activity. Because of this P:E values of the requirement vary in a complex way with age, gender, size and lifestyle mainly because of the way the energy requirement varies, and this inversely influences the P:E value. As shown in Fig. 2, the population safe or reference P:Erequirement value is low in infants, falls to its lowest value in toddlers (because the protein requirement falls more than the energy requirement) and increases after this through adolescence and into adult life, achieving the highest value in large, elderly, sedentary women. Initially these relationships appear counterintuitive but they become apparent when the actual diets of infants are compared with the adult diet. Breast milk is a low-protein, energy-dense food consumed in large quantities by the infant. While this could meet the energy needs of older children or adults, the lower intakes consumed by such population groups at energy balance would be too low to meet their protein needs. Thus adult diets, especially for sedentary populations, need to be more protein (and other nutrient) dense to meet nutrient needs without causing obesity, and indeed this is what happens in the weaning phase of human development with the transition to a more protein- and nutrient-dense diet. In fact it has been postulated that low-protein diets consumed by adults (e.g. excessive intakes of energy-dense beverages) may predispose to obesity(Reference Simpson and Raubenheimer27) if there is an appetite drive to meet protein needs, as is observed in growing animals and in infants during catch-up growth(Reference Millward28).
Use of P:E values of the diet and the requirement to assess protein deficiency
The utility of the dietary P:E value arises from the opportunity to be able to judge the adequacy of any diet by comparing it with the P:E value of the requirement as determined above. A simple comparison of the population reference P:E value of the requirement with the protein-quality-adjusted P:E value of the diet is the starting point for making such a judgement. More complex statistical probability calculations can be used to indicate proportions of the population at risk of actual deficiency (intakes below the requirement). Such comparisons were made in a modelling exercise in the recent protein report(12) and in the background paper(Reference Millward and Jackson20) between examples of typical diets in the UK (omnivores and vegetarians) and in India and the P:E values of metabolic requirements for all ages at three levels of energy expenditure and two adult body weights for men and women. An example of such a comparison for girls and women is shown in Fig. 2, in which it is immediately apparent that the average Indian diet would be associated with high prevalence rates of deficiency (intake < requirement) for the infant and the majority of adolescent and adult groups. Only those adults with the highest energy needs (small body size and high levels of physical activity) would consume enough of the diet for their protein intakes to meet requirements. However, quite unexpectedly, the analysis also indicated that the UK diets were inadequate for several population groups. As discussed in the report, such findings raise serious questions about both the model used to calculate deficiency risk and the current values for the protein and lysine requirements, which may be too high(Reference Millward2, Reference Millward3, Reference Millward and Jackson20). Although such an exercise can in theory be conducted comparing protein requirements with measured quality-adjusted protein intakes as g/kg per d, such intake values are likely to be much less accurate because of under-reporting. Indeed, in many cases actual protein intake data may not be available for those population groups likely to be at risk. Thus modelling intakes on the basis of dietary composition and predicted intakes which meet energy demands, as described here, allows a much more robust analysis of the adequacy of protein intakes.
Conclusions
Protein is usually identified as among the most extensively researched nutrients, which is undoubtedly true, with its requirement among the best understood (e.g. Beaton(Reference Beaton29)). In fact, there is some way to go in terms of reaching a consensus over protein requirements. Similarly the use of P:E values has not always been accepted by all. Nevertheless, as shown here, such values are actually very useful when used appropriately. Indeed, in the context of modelling protein intakes and likely risk of deficiency, use of P:E values to describe both requirement and intakes considerably simplifies such modelling. Also the P:E value of diets is an increasingly common descriptor of available dietary protein in many population studies. However the P:E value of the requirement is much less commonly used and is generally less well understood. Part of the reason for this is the apparently counterintuitive values for some population groups. Those with very high energy requirements, e.g. infants and young children with a high metabolic rate or physically active adults, will exhibit low P:Erequirement values and this is not always appreciated. As discussed elsewhere(Reference Millward and Stephen9), the incorrect assumption that the P:E value of the requirement was higher for a 2-year-old than at any other stage of life was largely responsible for the association of kwashiorkor with protein deficiency by FAO/WHO in 1951. The consumption of protein supplements by many who are physically active is also based on a lack of understanding of their likely intakes in relation to their needs. Thus for an athlete in competitive training, on the basis of current advice that the protein requirement is not markedly altered(12), the P:Erequirement value would fall from the 7·4 % calculated above assuming a PAL value of 1·63 to 4·8 % assuming a higher PAL value of 2·50. This is far less than the P:E value of likely diets of athletes which, for a typical ASF-rich diet, could have a P:E value of 18 % and would provide protein at 2·5 g/kg per d. This is three to four times the current estimate of their protein needs. If athletes were made aware of this simple fact it would be clear that extra protein as supplements would not be needed(Reference Millward7, Reference Millward, Bowtell and Pacy8).


Nutritional recommendations, the identification of what food should be comprised of, in both qualitative and quantitative terms, are at the heart of nutritional science. This can involve recommendations about foods and diets, individual nutrients or some combination of both. Discussions in this area are seldom without some degree of controversy and protein is an exemplar of the difficulties and debates which can occur.
In terms of food-based dietary guidelines, protein is at the heart of the debate on animal-source foods (ASF) v. vegetarian foods given that most ASF are high-protein foods(Reference Millward and Garnett1). For protein and its constituent amino acids, deciding on appropriate values for recommended intakes remains difficult in terms of both responses to international consensus statements about recommended intakes and various attempts to better define such intakes(Reference Millward2, Reference Millward3). One reason for such controversies is that identifying protein and amino acid requirements is an inherently difficult problem. The amount and type of dietary protein needed to allow optimal expression of the genome during growth and development remain poorly understood. Even the question of the nature and consequences of protein deficiency has proved controversial. For example, clinical manifestations long thought to reflect a protein-deficient diet, such as oedematous infantile malnutrition, have now been redefined as a reductive adaptation(4) to a combination of infection and micronutrient deficiency(Reference Golden5). Also there are virtually no effective markers of protein deficiency in adults(Reference Millward6). At the other end of the spectrum of public health issues, within health clubs worldwide more money is spent on protein and amino acid supplements than on any other ergogenic aid, even though the effectiveness of such expense is poorly documented to say the least(Reference Millward7, Reference Millward, Bowtell and Pacy8).
Values for protein and amino acid requirements derive from human and animal nitrogen balance and growth studies which began early in the 20th century and identified both estimates of dietary requirements and the pattern of amino acid essentiality(Reference Millward2, Reference Millward3). From the 1970s research expanded into protein and amino acid metabolism and turnover, much of it emanating from the work of John Waterlow and his students in the UK(Reference Millward and Stephen9) and Nevin Scrimshaw, Hamish Munro, Vernon Young and their colleagues and students in the USA(Reference Millward10). The development of stable isotope tracers allowed for the extension of such work to studies in human subjects ranging from newborn infants to the elderly. This work has provided insight into the regulation of protein synthesis, proteolysis, and amino acid and nitrogen metabolism in terms of quite detailed accounts of signal transduction pathways and their effectors(Reference Millward11). However, the most recent expert committee tasked with updating human protein and amino acid requirements(12) concluded from its evaluation of the methodologies available that: (i) the only method available for estimating the requirement for total protein (nitrogen) is by nitrogen balance; and (ii) at present, no method is entirely reliable for determining the dietary requirement for indispensable amino acids. Because of these limitations, the latest recommendations for protein and amino acid requirements are not entirely satisfactory(Reference Millward2) and the nature and limitations of protein requirement values are by no means widely understood.
One particular aspect of the long-running concern about protein requirements is their expression in terms of P:E ratio or P:E%, the ratio of protein, expressed as its energy content, to the energy requirement. The use of the P:E ratio was reviewed in the recent expert report(12) and it was emphasized that such use requires great care. Here, some of the issues associated with the use of the P:E ratio will be summarized, including the use of P:E ratios as measures of protein content and dietary quality and the derivation, interpretation and application of reference P:E ratios.
P:E ratios as a measure of the protein content of foods and diets
Typical values for the P:E ratios (expressed as P:E%) of foods and diets as consumed are shown in Fig. 1. In the case of individual foods, values range from only a few per cent for some starchy root staples such as cassava (3–4 %) to over 90 % for white fish fillets. However, the P:E% of individual foods can be misleading in terms of the importance of foods as dietary protein sources without taking into account: (i) their energy density (kJ/g), which determines the magnitude of their potential contribution to overall dietary energy intake; and (ii) population group energy demands. For example, breast milk has a low P:E% (6–7 %) but it is sufficiently energy dense, because of its high fat content, to meet the high energy demands when consumed as a sole food in volumes tolerated by the infant. Such volumes will also meet the high protein demands. In contrast, starchy roots or cereals with similar or even much higher P:E% (see Fig. 1) are less energy dense as edible foods or porridges and the infant is unable to consume sufficient to meet energy demands because the food intake is limited by its bulk. Because of this such foods cannot meet protein demands. Cow's milk has a similar energy density to human milk but a higher P:E% (18–19 %) and will provide protein markedly in excess of demands of infants and older children. Legumes and especially green leafy vegetables are relatively protein dense in terms of P:E% but have a low energy density and could never be consumed in sufficient amounts to meet the protein demand. In contrast, meat, fish and eggs can be sufficiently energy dense to meet energy needs but as sole foods would provide potentially toxic protein intakes.
Fig. 1 Protein in foods and diets and the recommended intake expressed in relation to energy
For diets, P:E% will reflect the balance among the food groups consumed. As shown in Fig. 1, man appears able to adapt to varying protein intakes and consequent dietary P:E% over a very wide range, with many diets providing protein intakes in excess of the minimum protein requirement. The one potential exception to this is the newborn infant, where protein intakes from breast milk do appear to match quite closely current best estimates of the protein intakes. The low levels or absence of ASF in a vegetarian diet result in generally lower P:E% than in omnivorous diets, although variation in dietary fat intake, which can vary directly with ASF intake, will tend to minimize such differences. Thus population studies in China, Japan, the UK and the USA indicate that variation in the proportion of ASF protein from 20 % in the Chinese diet to 66 % in the US diet increased the overall P:E% from 12·4 % to 15·5 %(Reference Elliott, Stamler and Dyer13). This increase would have been greater had it not been for the much greater fat intake as a percentage of energy in the USA (33 % of energy) compared with China (20 % of energy)(Reference Elliott, Stamler and Dyer13). Indeed, given that the P:E% of cereals such as hard wheat can be up to 16 %, low-fat, high-wheat diets have the potential for dietary P:E% which overlap with ASF-containing diets. At the lower extreme, relatively unsupplemented diets based on cassava or other low-protein starchy roots and tubers such as taro, sweet potato and yams can result in very low values, i.e. <5 %.
Judging by the wide availability and presumed consumption of protein supplements among many athletes and health-club habitués, many of these ‘protein-aware’ individuals are likely to exhibit much higher than average protein intakes. Since such population groups may also choose low-fat diets, they can achieve, in our experience, P:E% approaching 30 %(Reference Millward, Bowtell and Pacy8). Carnivorous population groups such as the traditional Inuit and some other hunter–gatherer societies consume diets with a relatively high P:E%, although consumption of the carcass fat can enable the protein intakes to stay within tolerable limits. As identified in the recent protein report(12), the tolerable upper limit to dietary protein intakes may be at a P:E% of about 40 % as indicated by reports of an inability of adults to tolerate diets comprising just lean meat.
Protein-quality-adjusted P:E% of the diet as a measure of dietary quality
The P:E% of the diets shown in Fig. 1 is a simple measure of dietary composition in terms of the protein concentration and is calculated without any consideration of what the metabolic fate of the utilized dietary protein will be in terms of either meeting the metabolic demands for amino acids or serving as a source of dietary energy. The use of this value as an expression of dietary protein quality requires some adjustments to the simple value. The available protein in food is determined by the food intake, the protein density (P:E%) and the protein quality in terms of both digestibility and biological value (BV). The lower digestibility usually observed with plant-derived foods(Reference Millward14) will reduce the amino acids available for metabolism. BV (retained nitrogen/absorbed nitrogen) is a function of the amino acid score(Reference Millward14), calculated from the absorbed amino acid pattern in relation to the amino acid pattern of the metabolic demands of the body. Any amino acid inadequacy indicated by an amino acid score less than 1 will lower the efficiency of utilization of food protein by the body. In practice the main potential problem in terms of amino acid score is posed by cereal-based diets because of their low lysine content. This means that the available P:E% of such diets will be, to a variable extent, lower than the measured P:E% of foods as consumed because of the poorer digestibility and low lysine content.
An extensive literature (e.g. Platt et al.(Reference Platt, Miller and Payne15), Hegsted(Reference Hegsted16)) describes the development of measures of dietary protein quality derived from the net protein utilization (NPU) value, a function of dietary protein digestibility and BV in terms of amino acid pattern. When assessed in feeding studies over a limited lower range of dietary protein concentrations, a standardized NPU value for dietary proteins or protein mixtures can be obtained that can then be used to adjust the crude P:E%, giving the net dietary protein calories per cent, i.e. the nDPcals%(Reference Platt, Miller and Payne15). After considerable debate about the derivation and interpretation of these values, and with direct assessment of NPU in human nitrogen balance trials proving very difficult(Reference Millward, Jackson and Price17), it was recommended(18, 19) that dietary protein quality should be predicted instead from a protein-digestibility-corrected amino acid score: the PDCAAS value. This is in effect a predicted NPU value. Specific amino acid scoring patterns derived for infants, children and adults with a factorial method based on patterns for maintenance (the adult amino acid requirement pattern) and growth (the tissue amino acid pattern) have now been recommended(12). Thus for human diets, variation in protein-quality-adjusted protein content, i.e. the amount of available protein in relation to the energy content of a food protein or diet, is predicted as an age-dependent PDCAAS-adjusted P:E%(12). This is calculated as:
Although the amino acid requirement is taken into account in calculating the PDCAAS value (i.e. the appropriate scoring pattern for the age group is used), the protein-quality-adjusted dietary P:E% is calculated without any consideration of what the metabolic fate of the utilized dietary protein will be in terms of either meeting the metabolic demands for amino acids or serving as a source of dietary energy, which would be the case for most high-protein diets. However, if such values are to be useful, it is necessary to derive comparable reference P:E values for the protein requirement, so that the adequacy of diets can be evaluated for individuals and different population groups. In the recent protein report(12) which drew heavily on a background paper that had been prepared during the course of the expert review(Reference Millward and Jackson20), it was stated that while reference P:E values can be very useful, the issues involved are complicated, so that care is required in both calculating and using such values.
Derivation of a reference P:E value of the protein requirement
The concept behind the use of a reference P:E value to judge the adequacy of the PDCAAS-adjusted dietary P:E value is that protein intake is determined firstly by overall food intake, mainly a function of appetite mechanisms which regulate energy intakes to match energy expenditure, and secondly by the protein or nutrient concentration in the food. This means that the P:Erequirement value will equate to the composition of a food which will meet protein needs at intakes which meet energy needs.
While the magnitude of the energy requirement for individuals and population groups is conceptually and physiologically straightforward in most cases, with a consensus agreement in its derivation by means of a factorial model involving BMR × physical activity level (PAL)(21, Reference Millward22), there is only a limited consensus over the magnitude of the protein requirement. The protein requirement is currently defined in the recent protein report(12) as: ‘the lowest level of dietary protein intake that will balance the losses of nitrogen from the body, and thus maintain the body protein mass, in persons at energy balance with modest levels of physical activity, plus, in children or in pregnant or lactating women, the needs associated with the deposition of tissues or the secretion of milk at rates consistent with good health’. Current values have been derived from nitrogen balance studies in adults as a measure of the maintenance requirement for all ages, with additions for special needs for protein deposition in childhood, pregnancy and lactation. From a metabolic perspective this minimum maintenance protein requirement (MPR) serves mainly to provide for irreversible amino acid use in non-protein pathways. Protein turnover recycles amino acids and does not necessarily contribute to irreversible amino acid consumption. The strengths and weaknesses of the currently accepted protein and amino acid requirement values have recently been reviewed elsewhere(Reference Millward2, Reference Millward3). As stated in Fig. 1, measurement of the MPR is very difficult and there is only a limited consensus on the extent to which values derived by nitrogen balance are appropriate (e.g. see Millward and Jackson(Reference Millward and Jackson23)). Several experienced investigators in the field have consistently argued that values of the MPR derived from nitrogen balance studies are likely to be lower than protein intakes which allow optimal muscle mass and function, especially in the elderly (e.g. Wolfe(Reference Wolfe24)), although admitting to a lack of convincing evidence to support such a claim. Indeed, the most recent studies of age and gender influences on protein requirements have confirmed the value of 0·66 g/kg per d for men and women of all ages identified in the protein report(Reference Campbell, Johnson and McCabe25), although these are nitrogen balance studies. The present author has shown that there are conceptual flaws in the analytical model used to interpret nitrogen balance studies(Reference Millward2) and that from the perspective of an adaptive metabolic demands model for the protein requirement(Reference Millward26), the true MPR is likely to be below the currently accepted value of 0·66 g/kg per d. However, the current value is a reasonable compromise which, in the context of judging the adequacy of diets, is unlikely to result in underestimates of protein deficiency. Thus for an individual adult for whom the energy requirement is known and with a protein requirement assumed to be the current Estimated Average Requirement (EAR) for protein, the required P:E % is:
At the current UK recommended population EAR for energy for an adult woman(21), calculated as BMR × 1·63 (PAL value), i.e. 8·7 MJ/d at 58·7 kg = 148 kJ/kg per d, the average P:Erequirement would be 7·4 %. For the newborn infant, with an average protein requirement estimated at 1·41 g/kg per d(12) and an energy requirement of 460 kJ/kg per d(21), the average P:Erequirement is 5·1 %.
However, the most likely use of P:Erequirement values is in examining diets to assess their adequacy for the population consuming them. In this case the appropriate P:E value is a population safe or reference value calculated to take into account: (i) inter-individual variation in the two requirement values; (ii) correlation between the protein and energy requirements; and (iii) variability in the intake values. In this case, as discussed elsewhere(12, Reference Millward and Jackson20), the calculation becomes more complicated and the population reference P:E value is considerably greater than the individual average values calculated above. An approximate value of a population safe, reference P:E value for adults is calculated as:
For infants and children, the calculated value corresponds to a protein value in the numerator of between 3sd and 4sd above the EAR. Thus for the average UK adult female population as identified above, the population reference P:E value would be 9·7 %. On the basis of the current UK recommendations for energy requirements(21), this value would be 8·9 % for the more active 75th centile of the assumed distribution of PAL values (PAL = 1·78) and 10·7 % for the less active 25th centile (PAL = 1·48).
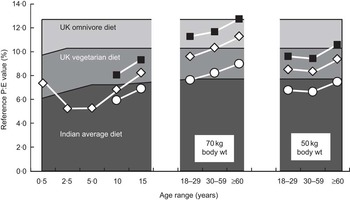
The EAR for protein (as g/kg per d) as defined in the protein report is highest at birth, falls markedly in the first 2 years of life but changes only modestly after that and is assumed to be constant during adult life, regardless of age, gender or physical activity. In contrast, the high energy requirement (as kJ/kg) at birth falls throughout childhood and adolescence, falls further into old age, falls with increasing body weight, is lower in women than men because of their lower fat-free mass, and as already indicated above varies with lifestyle through variable physical activity. Because of this P:E values of the requirement vary in a complex way with age, gender, size and lifestyle mainly because of the way the energy requirement varies, and this inversely influences the P:E value. As shown in Fig. 2, the population safe or reference P:Erequirement value is low in infants, falls to its lowest value in toddlers (because the protein requirement falls more than the energy requirement) and increases after this through adolescence and into adult life, achieving the highest value in large, elderly, sedentary women. Initially these relationships appear counterintuitive but they become apparent when the actual diets of infants are compared with the adult diet. Breast milk is a low-protein, energy-dense food consumed in large quantities by the infant. While this could meet the energy needs of older children or adults, the lower intakes consumed by such population groups at energy balance would be too low to meet their protein needs. Thus adult diets, especially for sedentary populations, need to be more protein (and other nutrient) dense to meet nutrient needs without causing obesity, and indeed this is what happens in the weaning phase of human development with the transition to a more protein- and nutrient-dense diet. In fact it has been postulated that low-protein diets consumed by adults (e.g. excessive intakes of energy-dense beverages) may predispose to obesity(Reference Simpson and Raubenheimer27) if there is an appetite drive to meet protein needs, as is observed in growing animals and in infants during catch-up growth(Reference Millward28).
Fig. 2 A comparison of available protein:energy (P:E) values of three typical diets with the population reference P:E value of the requirement of infants children and adults. The shaded areas indicate the available dietary protein in terms of age-adjusted available P:E values of the typical diets consumed in the UK by omnivores ( $$$$
) and vegetarians (
$$$$
) and vegetarians ( $$$$
) and a typical Indian diet (
$$$$
) and a typical Indian diet ( $$$$
; see Millward and Jackson(Reference Millward and Jackson20) for details). The points and lines indicate population reference P:E values (see text) for female infants and children at typical weights and for female adults at the weights indicated, calculated from protein requirements as in the recent expert report(12) and energy requirements calculated from predicted BMR values at light (
$$$$
; see Millward and Jackson(Reference Millward and Jackson20) for details). The points and lines indicate population reference P:E values (see text) for female infants and children at typical weights and for female adults at the weights indicated, calculated from protein requirements as in the recent expert report(12) and energy requirements calculated from predicted BMR values at light ( $$$$
), moderate (—
$$$$
), moderate (— $$$$
—) and heavy (—
$$$$
—) and heavy (— $$$$
—) physical activity levels (PAL = 1·55, 1·75 and 2·20, respectively). Any point which is above a shaded area indicates a requirement greater than the intake, i.e. potential protein deficiency. Small women have higher BMR/kg values than larger women, with lower required P:E values and a lower risk of protein deficiency as a result. Similarly, higher rates of energy expenditure result in higher energy requirements and food intakes and lower required P:E values. Values for boys and men (not shown) follow a similar pattern but values are in all cases lower since the energy requirements of men are higher because of their higher fat-free mass and BMR. This means that with any protein-limited diet women are more likely to be at risk than men. (Figure redrawn from reference 12)
$$$$
—) physical activity levels (PAL = 1·55, 1·75 and 2·20, respectively). Any point which is above a shaded area indicates a requirement greater than the intake, i.e. potential protein deficiency. Small women have higher BMR/kg values than larger women, with lower required P:E values and a lower risk of protein deficiency as a result. Similarly, higher rates of energy expenditure result in higher energy requirements and food intakes and lower required P:E values. Values for boys and men (not shown) follow a similar pattern but values are in all cases lower since the energy requirements of men are higher because of their higher fat-free mass and BMR. This means that with any protein-limited diet women are more likely to be at risk than men. (Figure redrawn from reference 12)
Use of P:E values of the diet and the requirement to assess protein deficiency
The utility of the dietary P:E value arises from the opportunity to be able to judge the adequacy of any diet by comparing it with the P:E value of the requirement as determined above. A simple comparison of the population reference P:E value of the requirement with the protein-quality-adjusted P:E value of the diet is the starting point for making such a judgement. More complex statistical probability calculations can be used to indicate proportions of the population at risk of actual deficiency (intakes below the requirement). Such comparisons were made in a modelling exercise in the recent protein report(12) and in the background paper(Reference Millward and Jackson20) between examples of typical diets in the UK (omnivores and vegetarians) and in India and the P:E values of metabolic requirements for all ages at three levels of energy expenditure and two adult body weights for men and women. An example of such a comparison for girls and women is shown in Fig. 2, in which it is immediately apparent that the average Indian diet would be associated with high prevalence rates of deficiency (intake < requirement) for the infant and the majority of adolescent and adult groups. Only those adults with the highest energy needs (small body size and high levels of physical activity) would consume enough of the diet for their protein intakes to meet requirements. However, quite unexpectedly, the analysis also indicated that the UK diets were inadequate for several population groups. As discussed in the report, such findings raise serious questions about both the model used to calculate deficiency risk and the current values for the protein and lysine requirements, which may be too high(Reference Millward2, Reference Millward3, Reference Millward and Jackson20). Although such an exercise can in theory be conducted comparing protein requirements with measured quality-adjusted protein intakes as g/kg per d, such intake values are likely to be much less accurate because of under-reporting. Indeed, in many cases actual protein intake data may not be available for those population groups likely to be at risk. Thus modelling intakes on the basis of dietary composition and predicted intakes which meet energy demands, as described here, allows a much more robust analysis of the adequacy of protein intakes.
Conclusions
Protein is usually identified as among the most extensively researched nutrients, which is undoubtedly true, with its requirement among the best understood (e.g. Beaton(Reference Beaton29)). In fact, there is some way to go in terms of reaching a consensus over protein requirements. Similarly the use of P:E values has not always been accepted by all. Nevertheless, as shown here, such values are actually very useful when used appropriately. Indeed, in the context of modelling protein intakes and likely risk of deficiency, use of P:E values to describe both requirement and intakes considerably simplifies such modelling. Also the P:E value of diets is an increasingly common descriptor of available dietary protein in many population studies. However the P:E value of the requirement is much less commonly used and is generally less well understood. Part of the reason for this is the apparently counterintuitive values for some population groups. Those with very high energy requirements, e.g. infants and young children with a high metabolic rate or physically active adults, will exhibit low P:Erequirement values and this is not always appreciated. As discussed elsewhere(Reference Millward and Stephen9), the incorrect assumption that the P:E value of the requirement was higher for a 2-year-old than at any other stage of life was largely responsible for the association of kwashiorkor with protein deficiency by FAO/WHO in 1951. The consumption of protein supplements by many who are physically active is also based on a lack of understanding of their likely intakes in relation to their needs. Thus for an athlete in competitive training, on the basis of current advice that the protein requirement is not markedly altered(12), the P:Erequirement value would fall from the 7·4 % calculated above assuming a PAL value of 1·63 to 4·8 % assuming a higher PAL value of 2·50. This is far less than the P:E value of likely diets of athletes which, for a typical ASF-rich diet, could have a P:E value of 18 % and would provide protein at 2·5 g/kg per d. This is three to four times the current estimate of their protein needs. If athletes were made aware of this simple fact it would be clear that extra protein as supplements would not be needed(Reference Millward7, Reference Millward, Bowtell and Pacy8).