


In Canada, the prevalence of obesity among children and youth has more than tripled since 1978/1979(Reference Shields1,Reference Rao, Kropac and Do2) . Since 1981, the average BMI of Canadian children aged 7–13 years has increased at a rate of approximately 0·1 kg/m2 per year(Reference Tremblay and Willms3), and globally, since 1975 the age-standardised mean BMI of children and adolescents increased at a rate of 0·32 kg/m2 for girls and 0·40 kg/m2 for boys(Reference Abarca-Gómez, Abdeen and Hamid4). Currently, approximately one-third of Canadian children and youth are classified as overweight or obese(Reference Rao, Kropac and Do2). Childhood overweight and obesity often persists into adulthood and increases the risk for a number of chronic diseases, including CVD, type 2 diabetes, hypertension and some cancers(Reference Janssen5–Reference Singh, Mulder and Twisk7). For the above reasons, preventing overweight and obesity early in life has become a public health priority(8). Unhealthy diet is a well-established risk factor for overweight and obesity and future development of chronic disease(Reference Mendoza, Drewnowski and Christakis9–11). The diet quality of Canadian children and youth is relatively poor(Reference Rao, Kropac and Do2), with only 24·4 % of boys and 30·7 % of girls between the ages of 12–17 years reporting consuming at least five servings of vegetables and fruit daily(Reference Garriguet12,13) . Limiting the consumption of energy-dense foods and beverages (including sugary drinks and ‘fast food’) and increasing the consumption of vegetables, fruit and whole grains are recognised as priorities for obesity and chronic disease prevention(11,14) .
Creating and improving community food environments to support behaviour change and improve available food ‘choices’ is an important strategy for the development of healthy diets and body weights. The community food environment refers to the availability and accessibility of food outlets within a geographical area(Reference Glanz, Sallis and Saelens15). Growing evidence links exposure to unhealthy food outlets, such as fast food restaurants and convenience stores, in the immediate residential neighbourhood with unhealthy diets and excess body weight in adults(Reference Stevenson, Brazeau and Dasgupta16–Reference Burgoine, Forouhi and Griffin20). However, other studies do not find the association(Reference Cobb, Appel and Franco21,Reference Wilkins, Radley and Morris22) . Evidence in children is limited(Reference Engler-Stringer, Le and Gerrard23–Reference da Costa Peres, Gardone and Costa26), but similar to adults, findings are not consistent(Reference da Costa Peres, Gardone and Costa26). Previous research suggests that fast food restaurants and convenience stores cluster around schools, especially in socio-economically disadvantaged areas(Reference Austin, Melly and Sanchez27–Reference Kestens and Daniel29). Although children spend the majority of their time at school and reside in the same neighbourhood, few studies have examined the effect of unhealthy food outlets around elementary schools with children’s diet- and weight-related outcomes(Reference Cobb, Appel and Franco21,Reference He, Tucker and Irwin30,Reference van Hulst, Barnett and Gauvin31) .
Many studies have relied on measures of absolute density (number) and proximity to fast food restaurants from home, but fewer have employed relative density (proportion) to assess the community food environment(Reference Wilkins, Radley and Morris22). Relative density refers to the availability of different food outlet types or categories in a geographical area relative to all food outlets(Reference Mahendra, Polsky and Robitaille32) and has been recognised as being a better determinant of an unhealthy diet(Reference Shareck, Lewis and Smith33,Reference Clary, Ramos and Shareck34) and increased weight status(Reference Stevenson, Brazeau and Dasgupta16,Reference Mehta and Chang18) than absolute density in the characterisation of the community food environment. A recent systematic review of Canadian studies assessing the retail food environment in relation to diet and BMI concluded that relative measures of the food environment outperform absolute measures in terms of predicting diet and BMI(Reference Stevenson, Brazeau and Dasgupta16). The authors emphasise that relative measures allow for a more complete conceptualisation of the food environment, as other food options to which people are exposed are also inherently considered. However, consideration of the relative density alone may not be enough, as demonstrated through the inconsistent findings in the literature(Reference Stevenson, Brazeau and Dasgupta16,Reference Cobb, Appel and Franco21) . Examining the interplay between absolute and relative densities may provide a more complete conceptualisation of the food environment, as the associations between relative density and diet- and weight- related outcomes may differ depending on the absolute number of unhealthy food outlets available. This was recently assessed in a Canadian study(Reference Polsky, Moineddin and Dunn19). The authors found that among adults aged 18 years or older, people living in a neighbourhood with a high number of fast food restaurants with few alternative healthy options in four major cities were 2·5 times as likely to be obese compared with people living in a neighbourhood with a low number of fast food restaurants(Reference Polsky, Moineddin and Dunn19). However, there have been no such investigations in children. As dietary behaviours and preferences are established early in life and often follow into adulthood(Reference Montaño, Smith and Dishion35,Reference Kelder, Perry and Klepp36) , we focused on this age group. Younger (school-age) children spend the majority of their time at school and usually reside in the same neighbourhood; therefore, we examined the associations between the absolute and relative densities of unhealthy food outlets within 1600 m radius (buffers) around elementary schools in two urban centres with children’s diet- and weight-related outcomes. Further, we examined the interplay of absolute and relative densities of unhealthy food outlets on children’s diet- and weight-related outcomes.
Methods
The 2014 Raising healthy Eating and Active Living Kids in Alberta (REAL Kids Alberta) study is a population-based survey of grade five students (mostly 10–11 years of age) and their parents in the province of Alberta, Canada. The sampling frame of this survey included the approximately 1400 elementary schools of Alberta(37) excluding private schools (4·7 % of all Albertan students), francophone schools (0·6 %), on-reserve federal schools (2·0 %), charter school (autonomous non-profit public schools that provide basic education in a different or enhanced way(38): 1·7 %) and colony schools (Hutterite schools supported by public school districts(39): 0·8 %). A one-stage stratified design was used to ensure balanced sampling of schools in metropolitan areas, cities and rural–town regions. Participation was open to all fifth-grade students and their parents of the selected 140 schools that agreed to participate. Of the 4993 home surveys sent home with children, 3284 were returned, and 2958 students received parental consent to participate in the study(Reference Munasinghe, Willows and Yuan40).
Dietary intake data were collected using a Canadian version of the Harvard Food Frequency Questionnaire for Children and Youth (YAQ)(Reference Rockett, Breitenbach and Frazier41), while information on lifestyle behaviours was collected through a student survey. The student survey included a twenty-nine-item physical activity questionnaire adapted from the Physical Activity Questionnaire for Older Children (PAQ-C)(Reference Janz, Lutuchy and Wenthe42). Both the YAQ and student survey were completed by grade five students during classroom time on a school day, under the supervision of a trained evaluation assistant. Evaluation assistants measured weight and standing height for all children. Weight was measured to the nearest 0·1 kg using calibrated digital scales (Health-o-metre), and height was measured to the nearest 0·1 cm using stadiometers (Seca-Stadiometers). The parent(s) or guardian(s) of students enrolled in the study completed a self-report survey on the home environment and demographic information.
The outcomes of interest were diet quality, BMI Z-score and weight status. Diet quality was measured by a Canadian adapted version of the Youth Healthy Eating Index (Y-HEI)(Reference Feskanich, Rockett and Colditz43), which assesses adherence to the 2007 Canadian food guide to healthy eating(44), calculated from the YAQ. The Y-HEI provides a healthy eating score that ranges from 0 to 100 (where 0 indicates the poorest and 100 indicates the highest diet quality). Daily servings of vegetables and fruit, as a second measure of diet quality(Reference Garriguet12), were also derived from the YAQ. BMI was calculated as weight divided by height squared and assigned WHO age- and sex- specific Z-scores(Reference de Onis, Onyango and Borghi45), which were used to categorise each student as either overweight/obese or not.
To assess the food environment surrounding schools, we used a list of all food retailers in two urban centres in 2016 provided by the Environmental Public Health Department of Alberta Health Services. Food retailers were classified by a Registered Dietitian using an adaptation of provincial nutrition guidelines(46) developed to assess the healthfulness of food retailers(Reference Prowse, Naylor and Olstad47). The Alberta Nutrition Guidelines for Children and Youth(46) is a nutrient profiling system recommended to be used by schools’ food services that classifies whether a food or beverage is Choose Most Often, Choose Sometimes, and Choose Least Often (CLO). A three-tiered ordinal classification system of retailers, termed the Nutrition Guidelines Adapted Ranking for Retailers(Reference Prowse, McGetrick and Raine48), was created to align with the Alberta Nutrition Guidelines for Children and Youth categories(Reference Prowse, Naylor and Olstad47), informed by previous research that assessed consumer nutrition environments in food retailers according to food availability, affordability, promotion and nutrition information availability(Reference Minaker, Raine and Cash49). Choose Most Often food outlets included those that were most healthful, including sandwich outlets, smoothie outlets, grocery stores and salad bars. Choose Sometimes food outlets included those that served some healthy food options, including sit-down restaurants, cafeterias, coffee outlets, supplements and processed grocery stores. CLO food outlets included pizza outlets, Asian outlets, burger and taco outlets, ice cream shops, lounges/bars and food outlets that serve fried foods.
Each school’s address was geocoded by a Geographic Information Systems analyst to identify 1600 m Euclidean buffers around each individual school. Within each 1600 m buffer, we created two continuous variables by deriving the number (absolute density) and proportion of CLO outlets relative to the total number of outlets (relative density). There is a lack of consensus in the food environment literature regarding which neighbourhood units are most appropriate to capture the community food environment. A recent systematic review that assessed the relationship between the community food environment surrounding schools and overweight/obesity in children reported that Euclidean circular buffers were most used by researchers(Reference da Costa Peres, Gardone and Costa26). Buffer distances examined in the review ranged from 100 m–4800 m, highlighting the lack of consensus about which buffer sizes are relevant to students(Reference da Costa Peres, Gardone and Costa26). We used Akaike Information Criterion statistics to test whether 800 m, 1000 m or 1600 m buffers provided the best model fit. The 1600 m buffers persisted (data not presented).
Covariates included gender, total energy intake (for dietary quality outcomes)(Reference Willet50), physical activity level (for weight status outcomes), parent’s education (high school or less, college or university, graduate university), household income (<$25 000, $25 000–$50 000, $50 001–$75 000, $75 001–$100 000, >$100 000) and area-level material deprivation (quintile 1 being least deprived area and quintile 5 being most deprived area)(Reference Pampalon, Hamel and Gamache51). Area-level material deprivation was measured by an area-based index constructed from Census data to differentiate socio-economic deprivation across neighbourhoods or communities based on a number of geographic characteristics (% of the population employed; % of the population without a high school diploma and average income). Prior studies have found a preponderance of fast food outlets in lower socio-economic status neighbourhoods, suggesting that individuals who live in socio-economically disadvantaged neighbourhoods may be at an increased risk for unhealthy diets and body weights(Reference Kestens and Daniel29,Reference Smoyer-Tomic, Spence and Raine52) .
Data analyses
Associations of community food environments with each outcome variable were assessed using multilevel mixed-effects regression models to account for the nested data structure (i.e. students within schools) and were adjusted for potential confounders. First, associations of absolute and relative densities of CLO outlets within 1600 m buffers around schools were examined (found in Table 3). Then, if an interaction term between absolute and relative densities of CLO food outlets within 1600 m buffers around schools was significant, the absolute density (#CLO) was categorised into tertiles (≤20 outlets; 21–35 outlets and ≥36 outlets), and the stratum-specific effect of the relative density of CLO food outlets (% CLO) on each outcome was estimated (Table 4). All coefficients were multiplied by 10 for ease of interpretation. Figure 1 provides an illustration of absolute density of CLO food outlets for participating schools in two urban areas in Alberta.
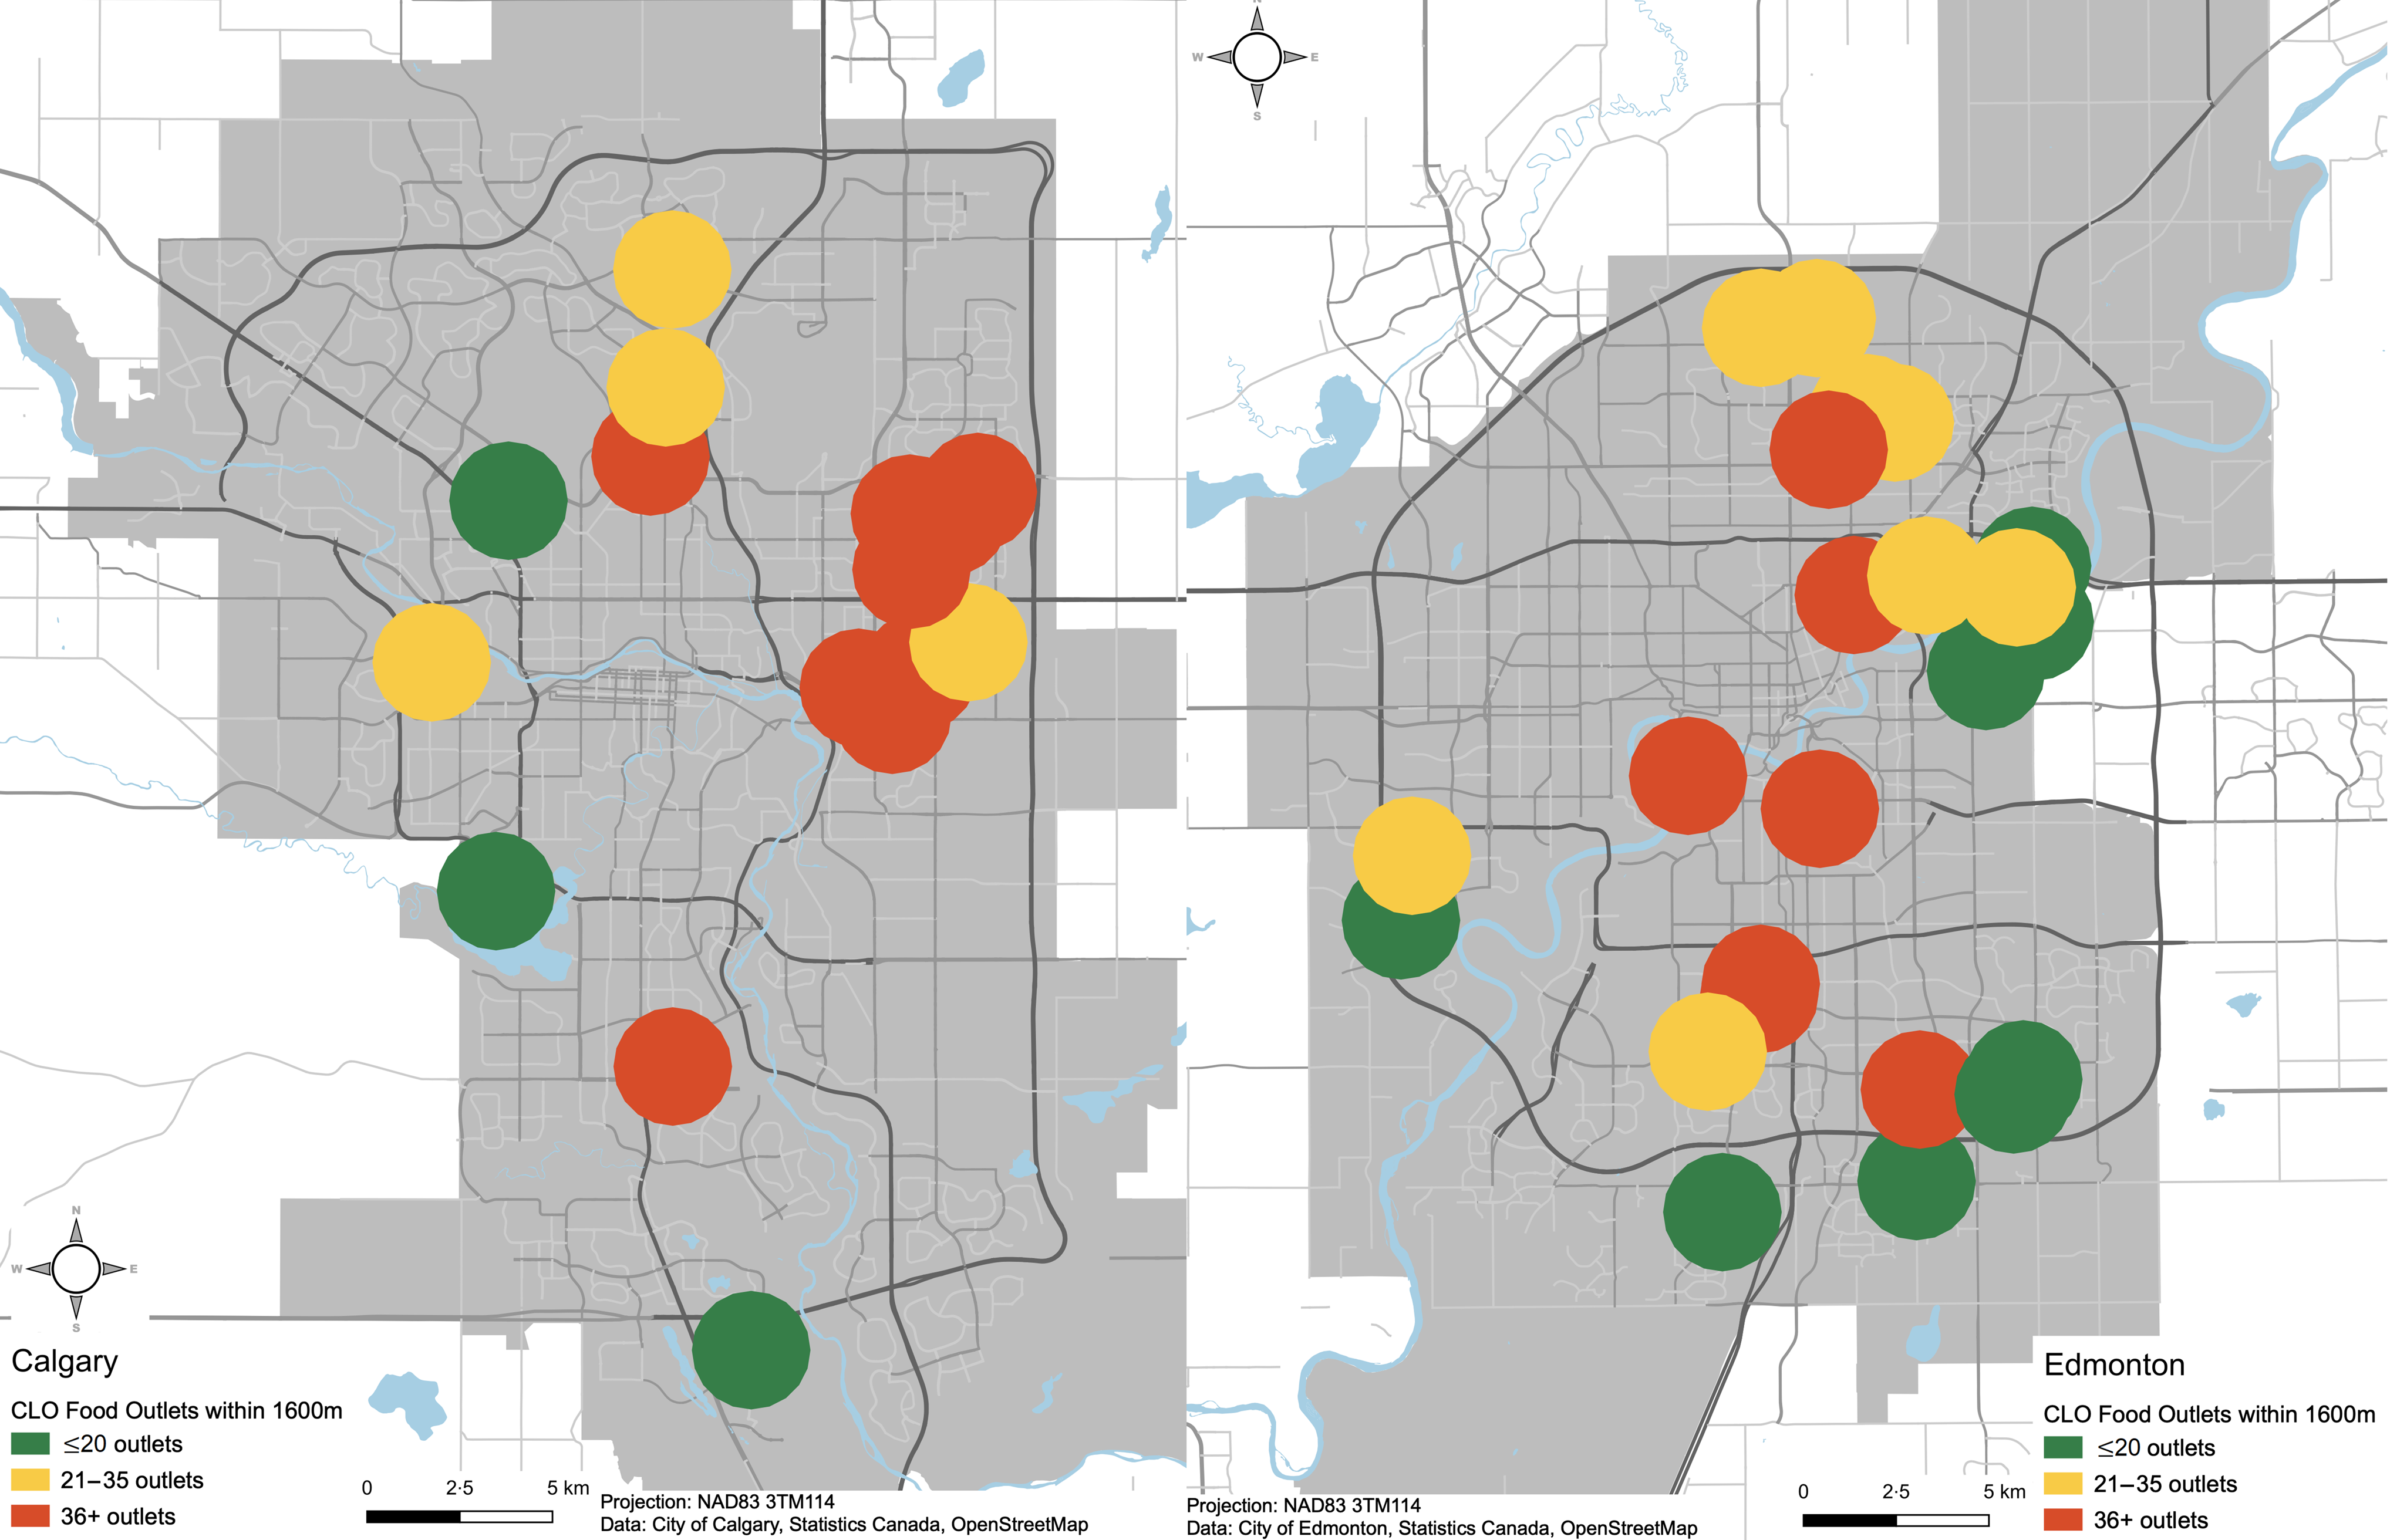
Fig. 1 Absolute density of Choose Least Often (CLO) food outlets for schools in two urban areas in Alberta. Each circle represents the 1600 m circular buffer around each school
For the current study, we worked with the subsample of students who reside in two urban centres, as the community food environment differs for schools located in urban v. rural environments. A study that investigated the community food environments of over 400 schools across Canada found that schools located in rural settings tend to have fewer unhealthy food outlets (including fast food restaurants, coffee shops and convenience stores) in their surrounding neighbourhoods compared with schools located in urban settings(Reference Browning, Laxer and Janssen53). Therefore, our sample was restricted to 989 students and forty-one schools. Two schools had less than five students participate; multi-level analysis requires at least five students (units) per school (cluster), and therefore, students attending these two schools were excluded from our analysis, leaving 984 students from thirty-nine schools. Additionally, 133 students who were missing exposure and/or outcome data were also eliminated from analyses, leaving 851 students from thirty-nine schools. It is recommended that children with caloric intakes less than 500 or greater than 5000 be excluded from analyses(Reference Willet50); therefore, an additional 39 students were excluded, leaving 812 students from thirty-nine schools.
Missing values for covariates combined with ‘prefer not to answer’ were considered as a separate category in regression analyses. Due to a high number of parent responses of ‘prefer not to answer’ to the survey question on household income (n 349), we conducted a sensitivity analysis with and without household income included as a covariate (see online supplementary material, Supplemental Table 1). Since results remained robust, the present analyses are based on the full sample and include household income as a covariate. We similarly conducted a sensitivity analysis for parental education; results also remained robust and the final analyses include parental education as a covariate (see online supplementary material, Supplemental Table 2). All data analyses were performed with Stata/se 15 statistical software package (Stata Corp.).
Results
Among the 812 participants, the average Y-HEI score was mean (sd) 63·5 (9·3) (out of 100) and students consumed, on average, 4·8 (3·4) vegetables and fruit servings per day (Table 1). The average BMI Z-score was 0·7 (1·3), and 39·9 % of children were overweight or obese (Table 1). Over half of the participants were girls (53·2 %), and three-quarters (75·9 %) of parents reported at least college or university education (Table 1). There were median (IQR) 46 (33–77) food outlets within 1600 m of schools, ranging from eleven to 124 outlets. There were 9 (6–17) Choose Most Often outlets, 6 (3–11) Choose Sometimes outlets and 35 (20–50) CLO outlets (Table 2) (consistent with other food environment literature(Reference Laska, Hearst and Forsyth24,Reference Barrett, Crozier and Lewis54) ). The median relative density of CLO outlets within 1600 m of schools was 64·7 % (60·8 %-72·9 %) (Table 2). Among children who attended schools in areas with a higher exposure to CLO food outlets (36+) within 1600 m, one-third had parents with high school education or less, compared with children with lower (10·4 %) or medium (19·0 %) exposure (Table 1). Additionally, for children who attended schools in areas with higher exposure to CLO food outlets (36+) within 1600 m, more than 40 % were overweight or obese, while approximately one-third of children who attended schools in areas with a lower number of CLO food outlets (≤20) were overweight or obese (Table 1).
Table 1 Characteristics of grade 5 students (mean age 10·3 years) residing in two urban centres and participating in the 2014 REAL kids Alberta study (n 812)*
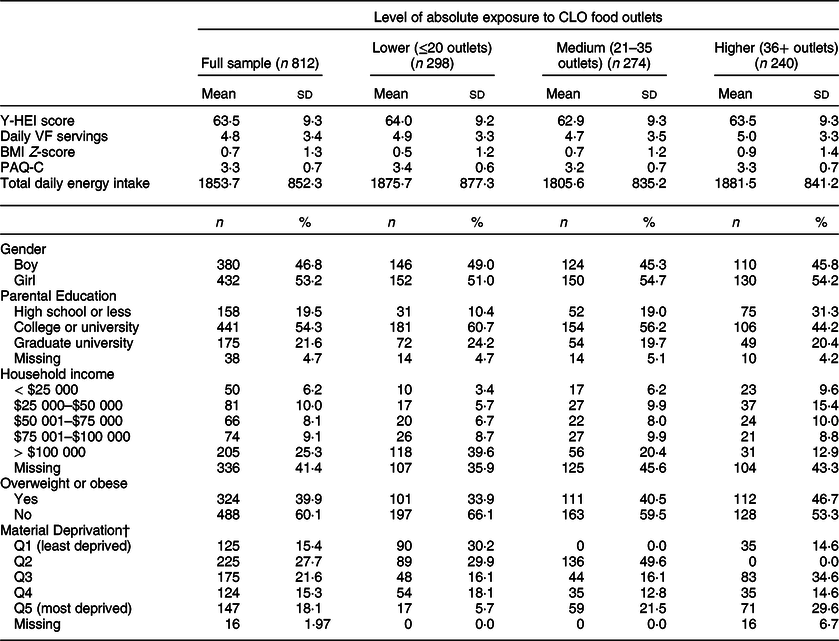
CLO, Choose Least Often; Y-HEI, Youth Healthy Eating Index; VF, vegetables and fruit; PAQ-C, Physical Activity Questionnaire for Children Score; Q, quintile.
* Lower refers to 1600 m buffers with ≤20 CLO food outlets; medium refers to 1600 m buffers with 21–35 CLO food outlets; higher refers to 1600 m buffers with 36 or more CLO food outlets.
† Y-HEI was calculated from dietary intake data collected with a Canadian version of the Harvard Food Frequency Questionnaire for Children and Youth (YAQ).
Table 2 Food outlet availability within 1600 m buffers around schools*
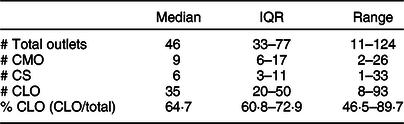
IQR, interquartile range (25th–75th percentiles); CMO, Choose Most Often; CS, Choose Sometimes; CLO, Choose Least Often; % CLO, proportion of CLO food outlets.
* The Pearson’s correlation coefficient between # CLO and % CLO is 0·16.
Table 3 Univariable and multivariable associations of absolute and relative density of Choose Least Often (CLO) food outlets within 1600 m of schools with diet quality and BMI in the REAL Kids Alberta Study (n 812)

Y-HEI, Youth Healthy Eating Index; CLO, Choose Least Often; VF, vegetables and fruit; % CLO, proportion of CLO food outlets relative to all.
* Coefficients and 95 % CI from multilevel mixed-effect linear regression models (multiplied by 10).
† OR and 95 % CI from multilevel mixed-effect logistic regression models (multiplied by 10).
‡ Multivariable models adjusted for absolute density of CLO outlets, gender, total energy intake (or physical activity for models examining BMI or weight status), parental education, household income and area-level material deprivation.
Table 4 Multivariable associations of relative density of Choose Least Often (CLO) food outlets with diet quality and daily vegetables and fruit servings for each level of absolute exposure to CLO outlets within 1600 m buffers around schools*
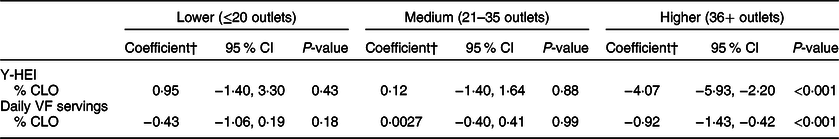
Y-HEI, Youth Healthy Eating Index; VF, vegetables and fruit; CLO, Choose Least Often; % CLO, proportion of CLO food outlets relative to all.
* Lower refers to 1600 m buffers with ≤20 CLO food outlets; medium refers to 1600 m buffers with 21–35 CLO food outlets; higher refers to 1600 m buffers with 36 or more CLO food outlets.
† Coefficients and 95 % CI from multilevel mixed-effect linear regression models (multiplied by 10). All models adjusted for gender, total energy intake, parental education, household income and area-level material deprivation.
Table 3 shows the unadjusted and adjusted associations of the absolute and relative densities of CLO food outlets surrounding schools with dietary and weight outcomes. Before adjustment for covariates, a higher relative density of CLO outlets within 1600 m of schools was associated with lower Y-HEI scores (coef = −1·75 (95 % CI: −2·74, −0·75), P = 0·001), lower daily vegetables and fruit intake (coef = −0·30 (95 % CI: −0·67, 0·056), P = 0·097), increased BMI Z-scores (coef = 0·20 (95 % CI: 0·055, 0·35), P = 0·007) and higher likelihood of being overweight or obese (coef = 1·38 (95 % CI: 1·08, 1·78), P = 0·012). The absolute density of CLO food outlets was associated with lower Y-HEI scores (coef = −0·14 (95 % CI: −0·51, 0·23), P = 0·46), lower daily vegetables and fruit intake (coef = −0·031 (95 % CI: −0·17, 0·10), P = 0·66), higher BMI Z-scores (coef = 0·069 (95 % CI: 0·013, 0·13), P = 0·015) and an increased likelihood of being overweight or obese (OR = 1·10 (95 % CI: 1·00, 1·21), P = 0·041). After adjusting for covariates, most coefficients remained in the same direction.
There was a significant interaction between the absolute and relative density of CLO food outlets for Y-HEI (coef = -0·12 (95 % CI: −0·18, −0·057), P < 0·001) and daily vegetables and fruit intake (coef = −0·022 (95 % CI: −0·040, −0·0047), P = 0·013), but not for BMI Z-score (coef = 0·0013 (95 % CI: −0·0087, 0·011), P = 0·80) or overweight/obese status (OR = 1·00 (95 % CI: 0·98, 1·01), P = 0·91). Stratum-specific effects of the relative density of CLO food outlets on Y-HEI and daily vegetables and fruit consumption were estimated for each level (tertile) of absolute density. For children attending schools with a higher absolute number (36+) of CLO food outlets within 1600 m, every 10 % increase in the proportion of CLO food outlets was associated with lower Y-HEI scores (−4·07 (95 % CI: −5·93, −2·20), P < 0·001) and lower daily vegetables and fruit consumption (coef = −0·92 (95 %CI: −1·43, −0·42), P < 0·001) (Table 4). No associations were observed for students attending schools with lower (≤20 outlets) or medium (21–35 outlets) absolute exposure to CLO food outlets. Models stratified by absolute number of total outlets (all food outlet types) showed similar results (Annex Table 1).
Discussion
Three key findings emerge from this study. First, children exposed to a higher relative density of unhealthy (CLO) food outlets surrounding a school have lower diet quality, particularly when their schools located are in an area with a high absolute number of unhealthy food outlets. Specifically, for students attending schools with thirty six or more unhealthy food outlets within 1600 m, every 10 % increase in the proportion of unhealthy food outlets was associated with 4·1 lower diet quality score and 0·9 fewer vegetables and fruit servings daily. Second, examining multiple dimensions of the food environment (i.e. both absolute and relative density simultaneously) might better capture the relationship between the availability of unhealthy food outlets with diet- and health-related outcomes than considering these dimensions separately. We observed associations of the joint effects of the proportion and number of unhealthy food outlets with diet and weight, independent of covariates. Last, we did not observe an effect of the proportion of unhealthy food outlets and weight-related outcomes for varying levels of absolute exposure to unhealthy food outlets.
In the current study, we found that children attending schools in areas with both a higher number and proportion of unhealthy food outlets had lower diet quality scores and consumed less vegetables and fruits daily. This finding suggests that schools located in neighbourhoods with a higher number of unhealthy food outlets have the worst effect on children’s diet when the proportion of unhealthy food outlets is also high. We did not find an association between the proportions of unhealthy food outlets and diet quality for children attending schools in neighbourhoods with lower or medium absolute exposure to unhealthy food outlets. Community food environments where both the number and proportion of unhealthy food outlets are high may be considered obesogenic – an environment that supports unhealthy choices such as consuming energy-dense foods and drinks and sedentary behaviours(Reference Swinburn, Egger and Raza55). Obesogenic food environments, like those with an abundance of unhealthy food options and few healthy choices, may greatly affect the individual’s ability to make healthy choices(Reference Swinburn, Sacks and Hall56). This was reflected in our study, as we observed that children attending schools in neighbourhoods with the most unhealthy food environments also had lower quality diets. Although our study population consisted of school-age children who may not have the opportunity to walk to and from school or shop at food retailers surrounding their schools, we assumed that children reside in the same neighbourhood as their school, and their parents may source food from the surrounding neighbourhood. Even without the assumption of children residing in the same neighbourhood as their school, examining the community food environment around the school is still important, as children who are exposed to more unhealthy food outlets on a daily basis (e.g. on their commute to and from school) may normalise the obesogenic environment in their perception(Reference Maximova, McGrath and Barnett57).
Our study findings align with previous literature that has emphasised the importance of using relative density to measure the food environment(Reference Stevenson, Brazeau and Dasgupta16,Reference Mehta and Chang18,Reference Clary, Ramos and Shareck34) . However, we have demonstrated that the relationship between the relative density of unhealthy food outlets with diet quality changes according to the absolute number of unhealthy food outlets. When examined separately the associations between the relative density of unhealthy food outlets with diet- and weight-related outcomes were marginal or null. This finding is corroborated by previous research(Reference Cobb, Appel and Franco21,Reference Wilkins, Radley and Morris22,Reference Shareck, Lewis and Smith33,Reference An and Sturm58,Reference Larsen, Cook and Stone59) . When considered together, a clear relationship emerged: children attending schools in the unhealthiest community food environments, characterised by a high absolute number of food outlets with few alternative healthy options, had worse diets. To our knowledge, only one previous study has examined multiple dimensions of the food environment simultaneously. Using a sample of Canadian adults drawn from the Canadian Community Health Survey, Polsky et al. found that among participants residing in a dissemination block with a high number (five or more) of fast food restaurants within 720 m from the centre, for every unit increase in the proportion of fast food restaurants, adults had 2·1 kg/m2 higher BMI and were 2·5 times more likely to be obese(Reference Polsky, Moineddin and Dunn19). They also found that the number or proportion of fast food restaurants within about a 10-min walking distance (720 m) from the centre of each participant’s dissemination block did not yield meaningful results when considered separately(Reference Polsky, Moineddin and Dunn19). Our results further corroborate the use of multiple dimensions of the food environment.
In the current study, we observed an association of the joint effects of the proportion and number of unhealthy food outlets with diet outcomes, but not with BMI or overweight/obese status. In the Polsky et al. study based on Canadian Community Health Survey data, significant associations were observed with both BMI and obesity(Reference Polsky, Moineddin and Dunn19) and may suggest that the effect of the food environment on weight status may not yet manifest by age 10–11 years. Indeed, obesity is a distal outcome and takes time to develop. The population assessed in the current study are children and may not have yet developed clinical overweight or obesity. The dietary behaviours are a more proximal outcome and may be more appropriate to capture the immediate effects of the surrounding food environment among children and youth. Future studies are needed to elucidate the timing of how and when surrounding food environments may influence the development of overweight and obesity in children. Longitudinal follow-up would enhance our understanding of how the food environment influences both diet- and weight-related outcomes in children, who are still growing and establishing eating behaviours(Reference Harris60). In addition to longitudinal follow-up, future studies should employ food environment indicators, such as the Nutrition Guidelines Adapted Ranking for Retailerss, that consider the types of food offered at an establishment, rather than focusing on the type of outlet, which may lead to misclassification error. This study examined the food environment surrounding children’s schools, but future studies should assess the joint effects of the number and proportion of food outlets around children’s homes and in their activity spaces. Further, future studies should consider the relative cost of healthy food options at surrounding food outlets.
There are several limitations to consider. This study was cross-sectional, and therefore temporal sequence cannot be established. The list of food retailers used to measure the food environment was based on businesses operating up to 2016, while dietary assessment and weight status data were collected in 2014. A temporal lag of exposure and outcome of 2 years is common in food environment research and generally not considered a major concern in light of the fact that temporal changes in dietary patterns and in food environments are typically gradual(Reference Burgoine, Forouhi and Griffin61,Reference Charreire, Casey and Salze62) . However, the fact that dietary patterns and food environments change gradually make estimates of the importance of the food environment for diet quality prone to underestimation. Therefore, this study and other cross-sectional studies assessing the role of the food environment on diet quality warrant cautious interpretations. We adjusted for several potential confounding variables that are commonly reported in the literature to minimise confounding, though we acknowledge that residual confounding may still exist, for example, because confounding variables had been categorised. We also acknowledge residual confounding due to unmeasured confounders, such as ethnicity and/or immigration status, which may have distorted the relationship between the community food environment, diet quality and overweight/obesity. Dietary intake data were collected through self-report FFQ, which may be prone to measurement error and may not accurately capture the absolute level of food intake. However, FFQ is the most commonly used method of dietary assessment in population-based research(Reference Shim, Oh and Kim63). We adjusted for total energy intake to take into account the absolute level of food intake(Reference Willet50). REAL Kids Alberta is a population-based study, but we only included children from two urban centres in our analyses, which precludes our ability to generalise findings to rural settings. Finally, we used 1600 m buffers to assess the community food environment, but other buffer distances and measures may also be relevant. By using Euclidean buffers, we may have excluded food outlets that fall right outside of the buffer but are still accessible.
The current study has several strengths. We used data from a population-based survey that collected dietary data with a validated FFQ and used standardised tools to measure each child’s height and weight. The food environment indicator was derived from a food retailer list obtained from the public health inspector, which is preferred over business data lists, which may lack validity(Reference Powell, Han and Zenk64). The novel food environment indicator used in our study (Nutrition Guidelines Adapted Ranking for Retailers), based on previous research that considers multiple aspects of the consumer food environment within a food retailer(Reference Minaker, Raine and Cash49), may offer greater precision compared with classifications based on store type, such as the Modified Retail Food Environment Index(65). We used both relative and absolute densities among children’s food environment to better capture their combined effect on diet and weight outcomes. Lastly, we adjusted for area-level material deprivation to account for clustering of unhealthy food outlets in lower SES neighbourhoods(Reference Smoyer-Tomic, Spence and Raine52). The area-level SES tool used in this study has been validated for use in Canada(Reference Pampalon, Hamel and Gamache51).
Conclusion
The study findings highlight the importance of the relative density of unhealthy food outlets in urban areas, as this is associated with poor diet. To our knowledge, we are the first to examine this association in Canadian children. The findings suggest that areas with a higher number of unhealthy food outlets and few healthy options (high proportion of unhealthy outlets) are in need of public health intervention. Interventions should target lowering the proportion of unhealthy food outlets in these areas, by either increasing the number of healthy food outlets or decreasing the number of unhealthy outlets. Other potential avenues for prevention may include implementing zoning by-laws or improving the nutritional quality of foods served at unhealthy food outlets.
Acknowledgements
Acknowledgements: The present study made use of data collected through the Raising healthy Eating and Active Living Kids in Alberta (REAL Kids Alberta) survey, a joint project of the School of Public Health of the University of Alberta and Alberta Health. The research team is grateful to all grade five students, parents and schools for their participation in the REAL Kids Alberta study. The authors thank the evaluation assistants for their contribution in data collection and Connie Lu for data management and validation. Financial support: REAL Kids Alberta was funded through a contract by PJV with Alberta Health. The present study was funded through a Canadian Institutes of Health Research (CIHR) Master’s Award: Frederick Banting and Charles Best Canada Graduate Scholarship to SS. All interpretations and opinions in the present study are those of the authors. Alberta Health had no role in the design, analysis, interpretation or writing of this article. Conflict of interest: There are no conflicts of interest. Authorship: S.S., P.J.V. and K.M. conceived and supervised the study. S.S. conducted the statistical analyses and drafted the manuscript. R.P. developed the methodology for the food outlet assessment, contributed to interpretation and manuscript development. C.I.J.N. advised on the analyses, helped interpret the data and contributed to the development of the manuscript. All authors read and approved the final manuscript. Ethics of human subject participation: The REAL Kids Alberta survey and the present study were conducted according to the guidelines laid down in the Declaration of Helsinki, and all procedures involving research study participants were approved by the Health Research Ethics Board (REB) of the University of Alberta. Written informed consent was obtained from all parents of participating students.
Supplementary material
For supplementary material accompanying this paper visit https://doi.org/10.1017/S1368980020004437


