


Nowadays, as shown in many studies, snacks provide a considerable proportion of daily energy intake(Reference Duffey, Pereira and Popkin1–Reference Ovaskainen, Reinivuo and Tapanainen3). However, the important point is the type and amount of snacks a person eats. As highlighted in the nutrient profile model of the WHO, less healthy foods are usually defined as foods that are high in energy, saturated fats, trans-fatty acids, salt and sugar but low in nutrients(4). In Iran, the Community Nutrition Improvement Department of the Ministry of Health and the Health Affairs Office affiliated with the Ministry of Education have jointly developed a healthy canteen guideline. In this guideline, snacks that are low in nutrients and high in fat, sugar and salt are considered unhealthy(5).
Adolescents’ dietary decisions have turned into a big worry in recent years. Unhealthy eating behaviours and habits are claimed as risk factors for non-communicable diseases such as cancer, obesity, high blood pressure, CVD and diabetes. Although chronic diseases are not predominant among young people, there is developing proof that risk factors begin early in life(Reference Fismen, Smith and Samdal6). Thus, a strong predictor of overweight and obesity is junk food consumption(Reference Bagherniya, Sharma and Mostafavi7). A national survey conducted on Iranian children and adolescents aged 6 to 18 years concluded that the intake of sweets, fast foods, sweet beverages and salty snacks was significantly associated with some anthropometric indices and blood pressure levels. In addition, children and adolescents who consumed sweet beverages daily were at a higher risk of general obesity(Reference Payab, Kelishadi and Qorbani8).
Overweight and obesity are now major public health challenges that also show a more or less increasing trend in Iran. Results of national surveys on the risk factors of non-communicable diseases show that the overall prevalence of obesity among adults aged 25 to 64 years has increased from 13·6 % in 1999 to 22·3 % in 2007. For overweight, the rates were 32·2 and 36·3 %, respectively(Reference Esteghamati, Khalilzadeh and Mohammad9). Furthermore, the results of a systematic review showed that the overweight prevalence trend in Iranian children aged 7 to 11 years has increased from 10·4 to 10·8 % during 2005 to 2010(Reference Kelishadi, Haghdoost and Sadeghirad10). In another systematic review, the range of overweight and obesity prevalence in national studies was 5·0–13·5 and 3·2–11·9 %, respectively(Reference Jafari-Adli, Jouyandeh and Qorbani11).
Improved food habits among adolescents are probably going to lessen the population-based rate of chronic diseases, since these habits set up at an early age to adulthood(Reference Due, Krølner and Rasmussen12). Food habits are also profoundly relevant in terms of social inequalities in health, because dietary imbalance is linked to health inequality(Reference Dowler13). Policy makers worldwide are concerned with socio-economic inequality in health and, hence, its mitigation is a key public health priority(Reference Fismen, Smith and Samdal6, Reference Marmot14). In this regard, some evidence shows a relationship between low socio-economic status (SES) and higher risk of morbidity and mortality, especially for non-communicable diseases(Reference Méjean, Droomers and van der Schouw15, Reference Mackenbach, Stirbu and Roskam16). Also, it is suggested that SES may create and distribute (un)healthy behaviours(Reference Pampel, Krueger and Denney17). It is important to study SES-related inequalities in health behaviours, particularly in the adolescence period, since they can form future patterns of adult health status(Reference Sawyer, Afifi and Bearinger18). Dietary and nutritional behaviours are among the most common behaviours that are differently distributed among high- and low-SES groups.
According to several studies, food consumption in adolescents is related to socio-economic factors such as parental education(Reference Mackenbach, Stirbu and Roskam16), parental occupation(Reference Pampel, Krueger and Denney17) and household income(Reference Sawyer, Afifi and Bearinger18). It is claimed that socio-economic factors can explain some food consumption patterns among different socio-economic groups(Reference Duffey, Pereira and Popkin1). For example, groups with low socio-economic level are associated with lower consumption of healthy foods(Reference Ovaskainen, Tapanainen and Pakkala2, Reference Ovaskainen, Reinivuo and Tapanainen3). Inequality in food consumption is important to understand because it is a key element of inequality in overall health during the lifespan(4) as well as an explanatory contributor to such inequality. A few studies have explored the role of schools in food consumption inequality(Reference Duffey, Pereira and Popkin1).
For the first time in Iran, we hypothesized in the present study that unhealthy snacks consumption was unequally distributed among adolescents with different SES. This hypothesis was tested via the concentration index method. We also tested the contribution of explanatory variables to inequality in unhealthy snacks consumption using decomposition of the concentration index. Better understanding of the attributable factors in distribution of unhealthy snacks consumption could provide insight for policy makers to redesign school-based interventions, such as the Iranian Health Promoting School (IHPS) programme. So, the aims of the present study were to examine the socio-economic inequality in unhealthy snacks consumption and to decompose the measured inequality among adolescent students in Kerman Province.
Methods
Data
The data used in the present study were obtained from a cross-sectional survey conducted in forty secondary schools of Kerman Province in Iran in 2015. The participants were selected through the proportional stratified random sampling method. The sample population included 1320 eighth-grade adolescent students. The schools were randomly selected from the provincial list of schools stratified by gender, type of school (public/private) and involvement in the IHPS programme (IHPS/non-IHPS). More details about the sample size and sampling method are presented elsewhere(Reference Yazdi-Feyzabadi, Keshavarz Mohammadi and Omidvar19).
Definition of variables
Unhealthy snacks consumption was selected as a binary outcome variable; that is, whether each of the adolescent students consumed a high level of unhealthy snacks during one week prior to the study. Unhealthy snacks included thirty-two snacks with added salt, sugar and fat based on the national rule set for unhealthy foods in school canteens(Reference Lindström, Hanson and Wirfält20). As the mentioned national rule defined no cut-off point to distinguish between high and low levels of unhealthy snacks consumption, the median was used as the cut-off point to distinguish between the students in terms of their levels of unhealthy snacks consumption. Hence, we developed a binary variable comprising a ‘low’ and a ‘high’ level of unhealthy snacks consumption. It is notable that we used the high level of unhealthy snacks consumption for measuring and decomposing inequality.
It is evident that a wide range of individual and environmental factors may theoretically affect eating behaviours in adolescents(Reference Story, Neumark-Sztainer and French21). For this reason, we selected the explanatory variables according to a previous study conducted to determine the factors affecting adolescents’ unhealthy snacks consumption(Reference Yazdi-Feyzabadi, Keshavarz Mohammadi and Omidvar19). Thus, for better understanding, the variables were categorized into individual and environmental factors. The individual factors included the students’ gender (male/female), taste and sensory perception, perceived self-efficacy, nutritional knowledge, cost sensitivity (completely disagree, disagree, unsure, agree, completely agree) and self-body image (very underweight, underweight/fitness, slightly overweight, very obese). The environmental factors included family structure (dual-parent, single-parent/living with others), receiving pocket money allowance (yes/no), SES, school size (≤150, 151–300 and >300), snacks sold at school (yes/no), school type (public/private), school with IHPS programme (IHPS/non-IHPS), social norms pressure, perceived parental control, media advertisements and easy accessibility of unhealthy snacks. The IHPS is a whole-school programme focused on improving high-risk behaviours of adolescents in Iran. In some Iranian schools, this programme is implemented and one of the components covered is nutritional behaviours(Reference Yazdi-Feyzabadi, Omidvar and Keshavarz Mohammadi22).
The SES of the adolescents’ families was constructed using principal component analysis(Reference Vyas and Kumaranayake23). The following variables were used in the principal component analysis: mother’s and father’s educational level (illiterate, primary school, secondary school, high school and university), their occupational status, type of house ownership, number of rooms per capita and possession of private room (i.e. adolescent having his/her own bedroom without sharing it). To avoid multicollinearity, a Z-score of the first component was extracted and subsequently grouped into five SES quintiles including the poorest, poorer, middle, richer and the richest.
Description of main measures
Three items with a 5-point Likert scale (ranging from ‘strongly disagree’ = 1 to ‘strongly agree’ = 5) were used to assess taste and sensory perception, which indicated to what extent the adolescents agreed that better taste and appeal of unhealthy snacks stimulated them to consume junk foods. Perceived self-efficacy, including three items with response options ranging from 1 (‘not at all confident’) to 5 (‘extremely confident’), was used as the adolescents’ belief in their ability to succeed in controlling unhealthy snacks consumption and weight gain. For example, one item was: ‘How confident are you that if you want, you can reduce the consumption of certain unhealthy snacks?’ In the case of the nutritional knowledge measure, the ability to differentiate between the most common healthy and unhealthy snacks was asked through four multiple-choice questions (e.g. ‘Which of the following items is a healthy drink?’). The total score ranged from 0 (none of the questions was correctly answered) to 4 (all four questions were correctly answered).
Cost/price sensitivity was a single item measured with a 5-point Likert scale (ranging from ‘very low’ = 1 to ‘very high’ = 5) in which the adolescents were asked to indicate their extent of agreement with the item: ‘Because unhealthy snacks are less expensive I eat them’. This measure indicated whether the students were cost/price-sensitive to junk foods or not. Self-body image was a single-item variable denoting the body fitness perceived by the adolescents (ranging from ‘very underweight’ = 1 to ‘very obese’ = 5).
Social norms pressure refers to the pressure exercised by peers, friends, family and generally society to consume junk foods. It was assessed using seven items with a 5-point Likert scale (from ‘strongly disagree’ = 1 to ‘strongly agree’ = 5). For example, one of the statements presented was: ‘Society expects me as an adolescent to eat unhealthy snacks’.
Perceived parental control was a three-item variable measuring the control of parents over the consumption of junk foods. For example, one statement included was: ‘My parents tell me how much junk food I may consume’. The response options ranged from ‘strongly disagree’ = 1 to ‘strongly agree’ = 5.
Media advertisements included two items to measure the extent to which the adolescents agreed that advertisements on television/radio or local outdoor advertisements stimulated junk foods consumption. A statement used to measure this variable was: ‘Advertisement on television or radio stimulates me to eat unhealthy snacks’. The response options were the same as for other measures.
Easy accessibility, a two-item measure with 5-point Likert scale, referred to the easiness of access to unhealthy snacks at home or in shops. One item of this variable was: ‘If I had access to unhealthy snacks at home, it would make it more difficult for me to avoid them’. More details about these measures, content and face validity and their reliability are presented elsewhere(Reference Yazdi-Feyzabadi, Keshavarz Mohammadi and Omidvar19).
Measuring inequality
Inequality in unhealthy snacks consumption was assessed using the concentration index (CI) approach(Reference O’Donnell, Van Doorslaer and Wagstaff24), which is widely used to measure inequality in health(Reference Friel, Kelleher and Nolan25, Reference Amini Rarani, Rashidian and Khosravi26). The CI is defined based on a concentration curve(Reference O’Donnell, Van Doorslaer and Wagstaff24). The concentration curve plots the cumulative percentage of the health variable (vertical axis) against the cumulative percentage of individuals, ranked by their SES from the poorest to the richest (horizontal axis). If everyone, regardless of their SES, has precisely the same value of the health variable, the concentration curve will be a 45° line named the line of equality. In comparison, if the health variable takes higher (lower) values among the poor, the concentration curve will lie above (below) the line of equality. The further the curve is above (below) the line of equality, the more concentrated the health variable is among the low-SES individuals (high-SES individuals). The CI is measured as twice the covariance of a health variable and fractional rank of a socio-economic variable divided by the mean health-related variable, as follows:
 $$C = {\frac{2}\over{{n\mu }}}\sum\limits_{y = 1}^n {{y_i}{R_i} - 1,}$$
where yi denotes the health variable (i.e. unhealthy snacks consumption) of the ith adolescent student, n denotes sample size, μ indicates its mean and Ri denotes the fractional rank of the ith adolescent student in terms of the index of his/her SES. CI values can vary between −1 and +1; the negative and positive values indicate that inequality disproportionally concentrates on the low- and high-SES individuals, respectively, and it will be zero in the case of equality(Reference O’Donnell, Van Doorslaer and Wagstaff24). In the present study, the unhealthy snacks consumption was a binary variable. Wagstaff’s CI normalization was used to measure inequality in unhealthy snacks consumption(Reference Wagstaff27) as follows:
 $${{\mathop{\rm CI}\nolimits} _{{\mathop{\rm normalized}\nolimits} }} = {\frac{C}\over{{1 - \mu }}}.$$
Decomposing inequality
Decomposition of CI into its determinants identifies the contribution of each explanatory variable to the measured health inequality (e.g. unhealthy snacks consumption). Following Wagstaff et al.(Reference Wagstaff, van Doorslaer and Watanabe28), for any linear regression model linking unhealthy snacks consumption (y) to a set of k explanatory variables (xk ):
 $${y_i} = \alpha + \sum\limits_k {{\beta _k}{x_{ki}} + {\varepsilon _i},}$$
where α is parameter vector, xki is a set of k repressor variables for the ith student, βk denotes the coefficient and εi is an error term. Given the association of yi and xki in equation (3), CI for y can be written as:
 $$C = \sum\limits_k {\left( {{\frac{{{\beta _k}{{\overline x}_k}}}\over{\mu }}} \right)} {C_k} + {\frac{{G{C_\varepsilon }}}\over{\mu }} = {C_{\hskip 1.8pt\scale 160%\hat {\hskip -1.8pt \vskip -1.25pt y}}} + {\frac{{G{C_\varepsilon }}}\over{\mu }},$$
where μ is the mean of y, ${{\overline x}_k}$
is the mean of xk
, Ck
is the concentration index for xk
defined precisely like C (namely, normalized CI (NCI)),
${{\overline x}_k}$
is the mean of xk
, Ck
is the concentration index for xk
defined precisely like C (namely, normalized CI (NCI)), ${{{\beta _k}{{\overline x}_k}} \mathord{\left/ {\vphantom {{{\beta _k}{{\bar x}_k}} \mu }} \right.} \mu }$
is the elasticity of unhealthy snacks consumption with explanatory variables and GCε
is the generalized CI for εi
(residual component). Equation (4) is composed of the deterministic or explained component (the left-hand side of the equation, denoted with Cy
ˆ) and the unexplained or residual component (the right-hand side). The former indicates the amount of inequality that can be explained by the explanatory variables included in the regression model. The latter is the part of the inequality that cannot be defined by systematic variation in the explanatory variables across SES classes. To decompose, one needs first to conduct a suitable regression model in order to calculate coefficients of the explanatory variables. In the current study, unhealthy snacks consumption was considered as a binary variable. Thus, following Yiengprugsawan et al. (Reference Yiengprugsawan, Lim and Carmichael29), we applied a generalized linear model to calculate the coefficients. In generalized linear models, the explanatory variables are not sensitive to the choice of reference groups.
${{{\beta _k}{{\overline x}_k}} \mathord{\left/ {\vphantom {{{\beta _k}{{\bar x}_k}} \mu }} \right.} \mu }$
is the elasticity of unhealthy snacks consumption with explanatory variables and GCε
is the generalized CI for εi
(residual component). Equation (4) is composed of the deterministic or explained component (the left-hand side of the equation, denoted with Cy
ˆ) and the unexplained or residual component (the right-hand side). The former indicates the amount of inequality that can be explained by the explanatory variables included in the regression model. The latter is the part of the inequality that cannot be defined by systematic variation in the explanatory variables across SES classes. To decompose, one needs first to conduct a suitable regression model in order to calculate coefficients of the explanatory variables. In the current study, unhealthy snacks consumption was considered as a binary variable. Thus, following Yiengprugsawan et al. (Reference Yiengprugsawan, Lim and Carmichael29), we applied a generalized linear model to calculate the coefficients. In generalized linear models, the explanatory variables are not sensitive to the choice of reference groups.
The absolute contribution of each explanatory variable to inequality can be identified by equation (4). The percentage contribution of each variable can also be calculated through the division of absolute contribution by the measured CI (of unhealthy snacks consumption). All analyses were done using the statistical software package Stata version 14·0.
Results
The data of 1242 adolescent students were complete and analysed in the current study. Table 1 shows brief statistics of unhealthy snacks consumption and its explanatory variables. About half of the adolescent students consumed unhealthy snacks. Regarding environmental variables, the majority of the adolescent students were in the middle category of SES, living with both parents and received pocket money allowance regularly. Snacks were sold in 85 % of the schools. Forty-eight per cent of the adolescent students were highly subjected to snack advertisements and 47 % of them had easy access to snacks at home and in shops. Regarding individual variables, about two-thirds of the students (69 %) imagined their bodies to be underweight or fit and more than half of them were not cost-sensitive. Over two-thirds of the adolescent students (69 %) had low taste and sensory perception and 60 % had a low perceived self-efficacy.
Table 1 Summary statistics about unhealthy snacks consumption and its determinants among eighth-grade adolescent students (n 1242) from forty secondary schools of Kerman Province in Iran, 2015

IHPS, Iranian Health Prooting School.
Figure 1 depicts the concentration curve for unhealthy snacks consumption. As illustrated, the curve is below the line of equality with a positive value of 0·179 (95 % CI 0·056, 0·119) and indicates that unhealthy snacks consumption is more concentrated among adolescent students belonging to households with higher SES. In other words, it indicates that there is inequality in the distribution of unhealthy snacks consumption disfavouring those of high SES in Kerman, Iran (Table 2).
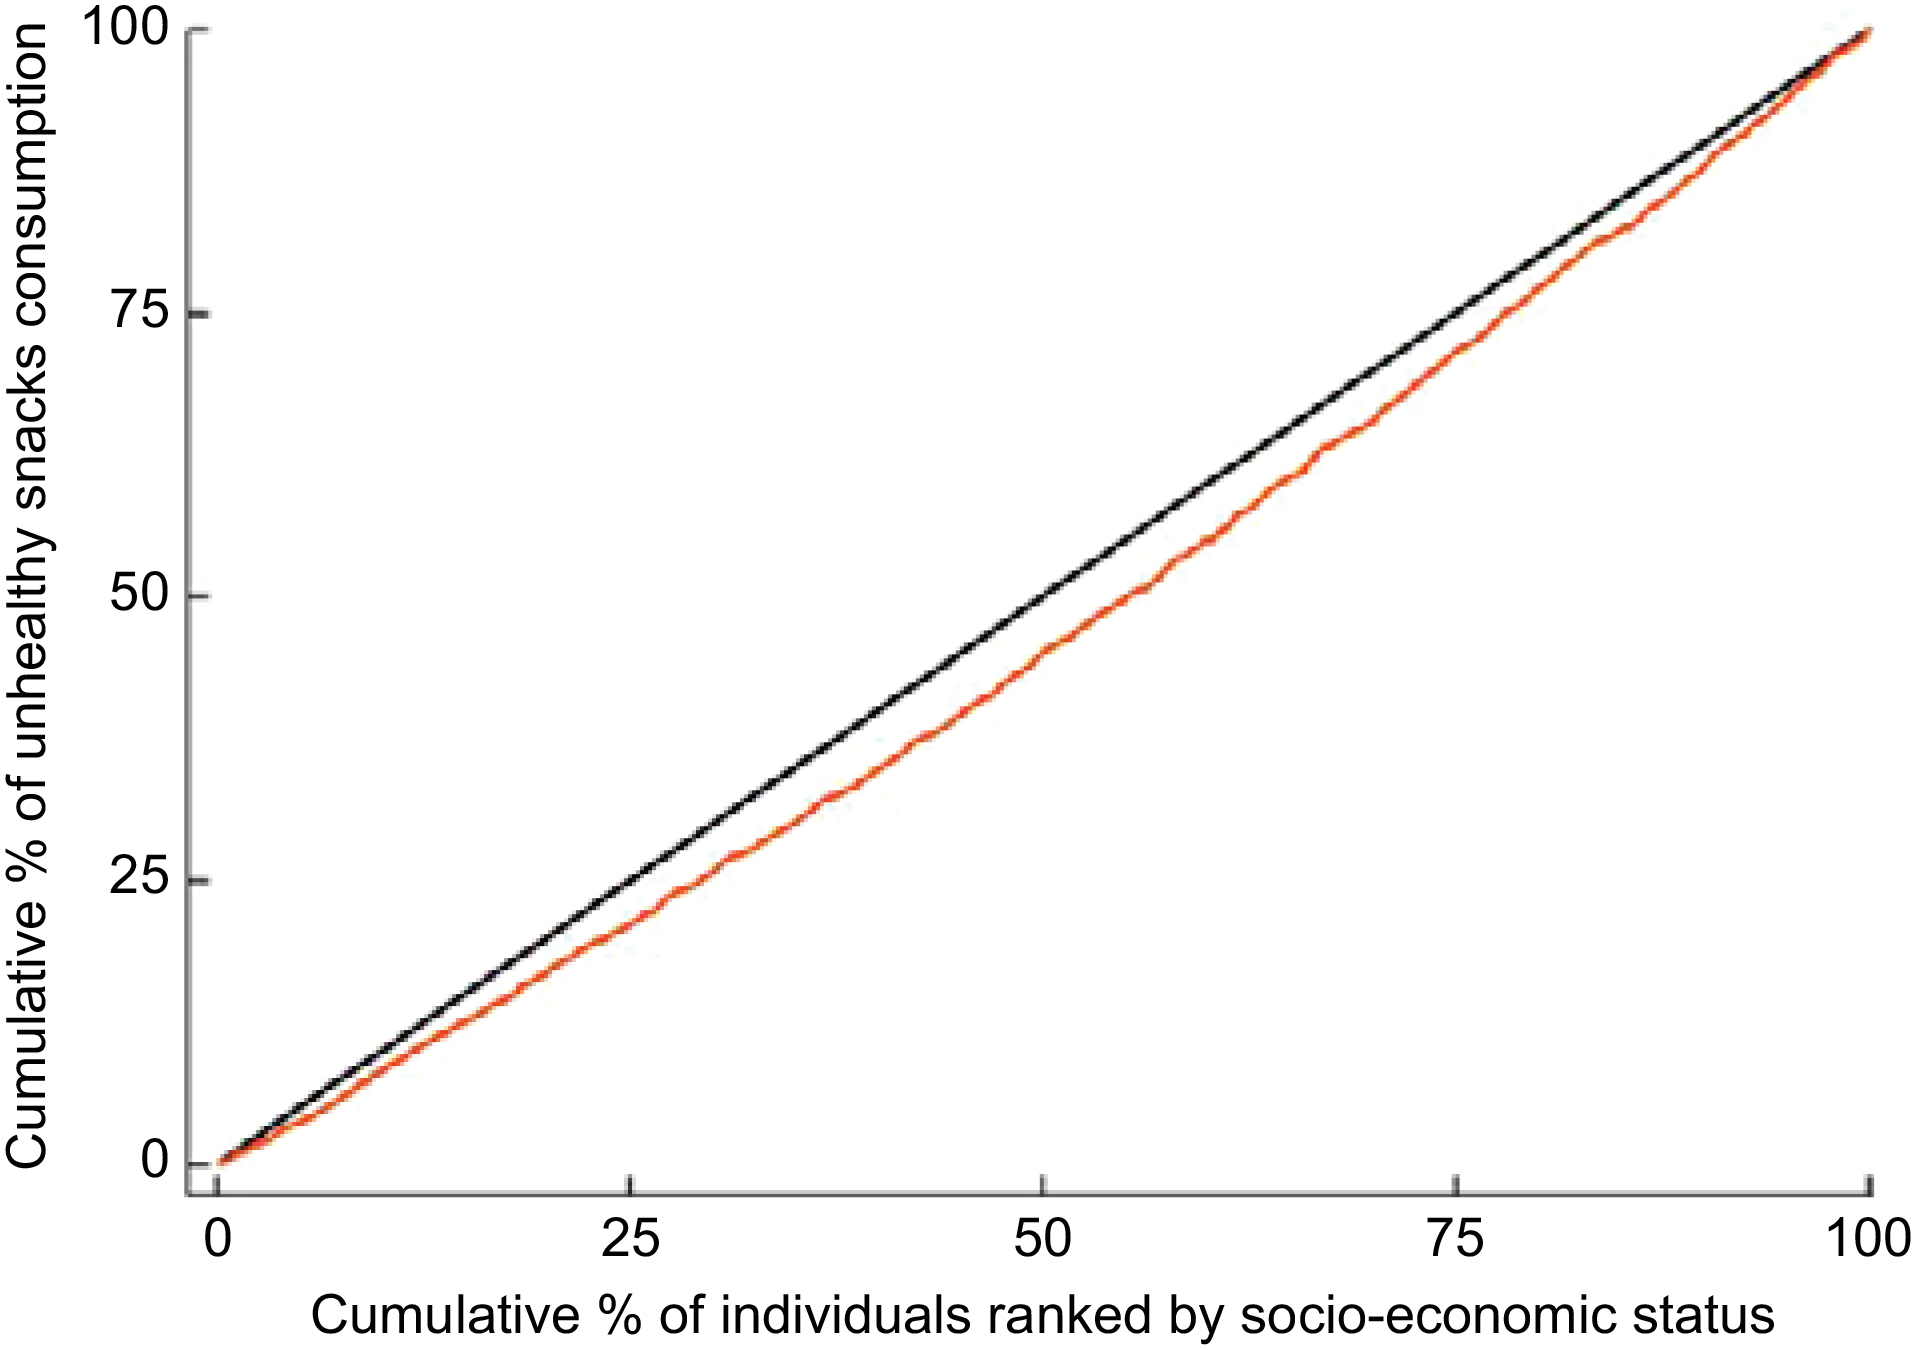
Fig. 1 The concentration curve (![]() ) for unhealthy snacks consumption among eighth-grade adolescent students (n 1242) from forty secondary schools of Kerman Province in Iran, 2015.
) for unhealthy snacks consumption among eighth-grade adolescent students (n 1242) from forty secondary schools of Kerman Province in Iran, 2015. ![]() represents the line of equality
represents the line of equality
Table 2 Normalized concentration index (NCI), 95 % CI, SE and P value for consumption of unhealthy snacks among eighth-grade adolescent students (n 1242) from forty secondary schools of Kerman Province in Iran, 2015
The results of decomposition of unhealthy snacks consumption according to the environmental and individual variables are presented in Table 3. The NCI of the explanatory variables including IHPS programme, (very) underweight, high perceived self-efficacy and low parental control, high cost sensitivity and high nutritional knowledge were negative, implying that all were more concentrated among adolescent students of lower SES. In contrast, private schools, students living with both parents, pocket money allowance, overweight, small-size schools, low cost sensitivity, low social norms pressure and easy access to unhealthy foods were more concentrated in adolescent students of higher SES. Regarding the contribution of the explanatory variables, if the value of the contribution of variable X is x and positive (negative), the inequality in unhealthy snacks consumption would decrease (increase) by x % if the variable was equally distributed among the SES groups. The largest contribution to inequality in unhealthy snacks consumption was attributed to SES (about 62 %) which was an environmental variable; that is, if educational and occupational opportunities as well as economic resources were equally distributed among households, the inequality in unhealthy snacks consumption would decline by 62 %. Another environmental variable contributing to the inequality in unhealthy snacks consumption was receiving pocket money allowance (31 %). It was followed by two individual variables: taste and sensory perception (7 %) and cost sensitivity (5 %). Table 3 also represents the residual component. The total NCI of unhealthy snacks consumption was 0·179. The observed component of the total NCI was 0·115. This component indicates that explanatory variables entered in the current model were able to explain 64 % of the measured inequality in unhealthy snacks consumption; that is, environmental and individual factors contributed 51 and 13 % of the observed inequality, respectively. The rest of the inequality (36 %) was the residual component of the total NCI. The residual component implied that there was some inequality in unhealthy snacks consumption which could not be explained by systematic variation in the explanatory variables among SES groups. To be exact, there were other contributors that accounted for this unobserved portion of inequality, but the data for those contributors were not gathered.
Table 3 Decomposition of normalized concentration index (NCI) for consumption of unhealthy snacks among eighth-grade adolescent students (n 1242) from forty secondary schools of Kerman Province in Iran, 2015
IHPS, Iranian Health Promoting School.
* Denotes reference group.
Discussion
The present study tried to shed light on socio-economic inequalities and the contribution of their influencing factors in unhealthy snacks consumption among a sample of adolescent students in Kerman city, located in south-east Iran. The study found that unhealthy snacks consumption was unequally distributed among the studied adolescents. Surprisingly, socio-economic inequality in unhealthy snacks consumption concentrated more among the high-SES adolescent students. In terms of the determinants affecting the inequality, there were positive (negative) contributions which decreased (increased) the inequality observed, if the variable were to be equally distributed among various SES groups(Reference Zhang and Wang30, Reference Omani-Samani, Rarani and Sepidarkish31). In this regard, an interesting finding was that among the environmental factors, SES and receiving pocket money allowance were influential positive contributors to decreasing inequality in unhealthy snacking consumption, if they were equality distributed across the different SES groups. Thereafter, two positive individual contributors, namely taste and sensory perception and low cost sensitivity, were placed later in a sequential line-up. A systematic review conducted on adolescents and children concluded that high-income and educated populations had an unhealthy diet(Reference Hinnig, Monteiro and de Assis32). Another study conducted in Brazil showed that foods rich in fat, salt and sugar were positively associated with SES among adolescents(Reference Borges, Slater and Santaliestra-Pasías33).
It has also been shown that unhealthy snacks consumption is associated with weight gain(Reference Bagherniya, Sharma and Mostafavi7). In this regard, some studies conducted in Iran(Reference Maddah and Nikooyeh34, Reference Shafaghi, Shariff and Taib35) concluded that obesity and overweight were more prevalent in children and adolescents with more affluent and well-educated parents, indicating that they highly consumed unhealthy snacks and junk foods. Furthermore, one systematic review of studies conducted on the association between SES and obesity among children and adolescents concluded that higher-SES groups in most developing countries with varied income levels and socio-economic measures, including Iran, India, Vietnam, Ukraine, Colombia, Sri Lanka, South Africa and Guatemala, had more overweight and obesity compared with lower-SES groups(Reference Dinsa, Goryakin and Fumagalli36). In contrast, such an association was mostly inverse in developed countries(Reference Hulshof, Brussaard and Kruizinga37, Reference Wang and Lim38), indicating that the consumption pattern of unhealthy snacks by SES was not the same in developing and developed countries. This heterogeneity might be due to at least two reasons.
First, some important factors affecting obesity are food quality, prices and availability in a community(Reference Cummins and Macintyre39). In this regard, our study highlighted that families with higher economic, educational and job status, who consequently spent less time in family activities and parenting children than in paid work, had more consumption of junk foods. A study conducted by Bauer et al. also concluded that employed mothers and fathers reported less time spent on food preparation, and employed mothers reported having fewer family meals, less frequent encouragement of their adolescents’ healthful eating, and lower and fruit and vegetable intake, compared with not-employed mothers, after adjusting for sociodemographic factors(Reference Bauer, Hearst and Escoto40).
Second, more affluent adolescents spend more time with their friends in coffee shops and fast-food restaurants, providing opportunities to higher consumption of unhealthy snacks, particularly with regard to the fact that eating is an important expressive of socialization and recreation(Reference Yazdi-Feyzabadi, Omidvar and Keshavarz Mohammadi22, Reference Sawka, McCormack and Nettel-Aguirre41). Another important finding in the present study was that pocket money allowance might increase a risk for the inequality of unhealthy snacks consumption among adolescents with higher SES. This is because adolescents living in families with higher SES most likely received more pocket money allowance and this directly affected their food choices. This result is also supported by Haye et al.(Reference Haye, Robins and Mohr42) and Li et al. (Reference Li, Xue and Jia43) who concluded that pocket money was associated with higher intake of sugary beverages, fast foods or foods at street-food stalls.
The current study found that the good taste and sensory perceptions of junk foods, compared with healthy ones, were additional factors contributing to the increased inequality in unhealthy snacks consumption among higher SES. This view was also echoed by previous research which delineated a ‘healthy = less tasty’ intuition. The intuition resulted in consumers’ feeling to perceive foods called healthy as less tasty than the same food called unhealthy and vice versa(Reference Raghunathan, Naylor and Hoyer44). Of course, evidence shows that focusing on both healthiness and tastiness of healthy foods(Reference Petit, Merunka and Anton45) and the role of health consciousness(Reference Mai and Hoffmann46) may lead consumers to healthier decisions.
In the case of cost sensitivity, the current study found that low cost (price) sensitivity increased the inequality of unhealthy snacking behaviours among adolescents with higher SES. A possible explanation for this might be that the cost and price of unhealthy and junk foods in Iran are at the extent which would not reduce demands for buying them by adolescents with higher SES. This was also proved by a meta-analysis which concluded that less healthy foods had lower costs than healthier ones(Reference Rao, Afshin and Singh47). A key policy priority should therefore be to plan for taxing unhealthy snacks and junk foods so that the taxation levels would have a significant effect on reducing consumption of unhealthy snacks. Mytton et al. examined the evidence and found that generally imposing taxes on unhealthy foods might decrease unhealthy snacks consumption(Reference Mytton, Clarke and Rayner48). Of course, it was shown that poorer individuals are more sensitive to price changes(Reference Powell and Chaloupka49, Reference Smed, Jensen and Denver50). Therefore, in order to decrease the consumption of unhealthy snacks, as suggested by evidence, the tax should be at least 20 % to have a significant effect on population health(Reference Mytton, Clarke and Rayner48). In brief, adolescents with higher SES consume both healthy and unhealthy snacks more(Reference Yazdi-Feyzabadi, Omidvar and Keshavarz Mohammadi22), since they have financial means and easy access to such snacks.
Study strengths and limitations
A strength of the present study was its novelty as it is the first conducted on inequality analysis of unhealthy snacks consumption. In the study, we utilized a composite index as a proxy variable of SES to estimate and decompose inequality. The composite index encompassed most key indicators known for SES of adolescents including parental education level, parental employment status, and household income and conditions, as supported by Galobardes et al.(Reference Galobardes, Shaw and Lawlor51). This composite index enabled us to obtain a variable highly reflective of an adolescent’s SES. The study also had some limitations that should be kept in mind. First, although we utilized a relatively large-scale population based on sampling which might result in more internal validity, the participants were not sufficiently representative of Iranian adolescent students due to the heterogeneity in the population. Therefore, we suggest further research on the inequality of unhealthy snacks consumption at national and provincial levels in Iran. Second, as there was no cut-off point for what should be considered high unhealthy snacks consumption, we used the median as a cut-off to group the students into two categories of high and low unhealthy consumption. This might affect our findings in some ways and requires careful and cautious consideration to interpret the results. Future studies in Iran are necessary to define a standard cut-off point for the consumption of unhealthy snacks. Finally, as the data were extracted from a cross-sectional study, any causal interpretations should be made with caution, as longitudinal or experimental studies can better explore such attributions.
Implications for policy makers
1. Measuring inequality of unhealthy snacks consumption and decomposing the contributing factors help policy makers to adopt tailored policies for tackling inequality in food consumption.
2. The most important contributors to inequality of unhealthy snacks consumption, disfavouring the high-SES adolescents, were attributable to individual and environmental factors including SES, receiving pocket money allowance, better taste and sensory perception, and low cost sensitivity.
3. It is suggested that policy makers account for taxing of unhealthy and junk foods to control the demands for them by higher-SES populations.
Conclusion
We conclude that health promotion strategies should be applied not only at environmental and individual levels, but also at different settings including schools, families and suppliers of unhealthy snacks. This implicitly pinpoints the key role of schools, where adolescents spend a considerable time of their lives every day, to adopt tailored health promotion policies. In this regard, it is suggested that private schools, where adolescents with higher SES attend more, should raise knowledge, promote the consumption of healthy snacks and limit the consumption of unhealthy ones. This would be facilitated by a collaborative approach among parents, schools’ staff and food suppliers.
Acknowledgements
Acknowledgements: The authors greatly thank Mr Keivan Rahmani for help preparing the initial draft of this manuscript. Financial support: This work was supported by the Kerman University of Medical Sciences (grant number 95/341). Kerman University of Medical Sciences contributed to the study design and conduct of the study. Conflict of interest: None. Authorship: V.Y.-F. formulated the research question, designed the study and carried it out with contribution from A.R. M.A.R. analysed the data and interpreted the results. V.Y.-F. and M.A.R. wrote the manuscript draft and revised the final version. Ethics of human subject participation: This study was conducted according to the guidelines laid down in the Declaration of Helsinki and all procedures involving research study participants were approved by the Kerman University of Medical Sciences Research Ethics Committee (ethical code number IR.KMU.1395·568). Written informed consent was obtained from all subjects.
Author ORCID
Mostafa Amini Rarani, 0000-0002-4809-2237.


