


Lifelong risk of obesity and chronic disease is partially determined in early life (i.e. conception to 2 years of age)(Reference Mameli, Mazzantini and Zuccotti1). During this time, nutritional, hormonal and environmental exposures can result in physiological adaptations that persist throughout life, influencing chronic disease risk(Reference Agosti, Tandoi and Morlacchi2–Reference Godfrey and Barker4). The mother’s diet during pregnancy is the sole source of fuel for fetal growth and overall diet quality impacts fetal development and health trajectories(Reference Agosti, Tandoi and Morlacchi2), making prenatal diet a target for improving population health.
While the risk of poor health outcomes can be mitigated by increasing prenatal diet quality, current studies indicate that prenatal diet quality in the USA is generally poor(Reference Shin, Lee and Song5,Reference Rifas-Shiman, Rich-Edwards and Kleinman6) . For example, in a nationally representative sample, the average Healthy Eating Index-2010 score of pregnant women participating in the National Health and Nutrition Examination Survey from 2003 to 2012 was 50·7 out of 100(Reference Shin, Lee and Song5), which is lower than the average score of 54·3 for all adult participants (2007–2008)(7) and nearly 30 points below the score recommended for disease prevention(Reference Banfield, Liu and Davis8). Furthermore, studies have indicated the majority of pregnant women in the USA are not consuming enough fibre, whole grains, fruits or vegetables, and are consuming excessive amounts of sodium and fat in the form of heavily processed foods(Reference Shin, Lee and Song5,Reference Rifas-Shiman, Rich-Edwards and Kleinman6,Reference Bodnar and Siega-Riz9–Reference Laraia, Bodnar and Siega-Riz11) .
Although prenatal diet quality in the USA is generally poor, it is unlikely that all populations are proportionately impacted. In the broader US population, individuals with low socio-economic status (SES) and individuals of minority races/ethnicities experience health and diet quality disparities(Reference Kirkpatrick, Dodd and Reedy12,Reference Satia13) . While these disparities may be similarly present in populations of pregnant women, to date, relatively few high-quality studies have examined prenatal diet quality disparities. In the current literature, pregnant women of higher SES generally have more healthful diets(Reference Shin, Lee and Song5,Reference Rifas-Shiman, Rich-Edwards and Kleinman6,Reference Bodnar and Siega-Riz9,Reference Siega-Riz, Bodnar and Savitz10) . However, many studies examining SES disparities in prenatal diet quality utilized samples comprised of either mostly high- or mostly low-income women(Reference Rifas-Shiman, Rich-Edwards and Kleinman6,Reference Bodnar and Siega-Riz9,Reference Laraia, Bodnar and Siega-Riz11) and only one study has examined whether participation in nutrition assistance programmes (e.g. Special Supplemental Nutrition Program for Women, Infants, and Children (WIC), which provides healthful foods to low-income pregnant women) impacts prenatal diet quality(Reference Suitor, Gardner and Feldstein14). Similarly, studies examining differences in prenatal diet quality do not consistently find that racial/ethnic minorities have poorer or healthier dietary quality than their non-Hispanic White (NHW) counterparts(Reference Shin, Lee and Song5,Reference Rifas-Shiman, Rich-Edwards and Kleinman6,Reference Bodnar and Siega-Riz9,Reference Siega-Riz, Bodnar and Savitz10) . While an unadjusted analysis of pregnant women in the National Health and Nutrition Examination Survey 2003–2012 found that NHW women had significantly lower Healthy Eating Index-2010 scores than all other racial/ethnic groups(Reference Shin, Lee and Song5), it has been suggested that racial disparities in diet quality may be confounded by SES(Reference Kirkpatrick, Dodd and Reedy12) which was rarely controlled for in studies examining pregnant women. Furthermore, in a nationally representative sample of US adults, diet quality was similar among NHW and non-Hispanic Black (NHB) individuals after controlling for SES(Reference Wang, Leung and Li15). Therefore, a more thorough examination of the relationship between race/ethnicity (hereafter referred to as ‘race’), SES (including poverty income ratio and WIC participation) and prenatal diet quality in a diverse sample, and with adjustment for confounding variables, is currently needed.
The present study seeks to explore racial and SES disparities in prenatal diet quality. We hypothesized that after adjustment for covariates, differences for prenatal diet quality across race and SES groups would reflect findings from nationally representative samples of US adults and that WIC participants would have higher diet quality compared with income-eligible non-participating women.
Methods
The present secondary, cross-sectional analysis was completed using publicly available data from the longitudinal Infant Feeding Practices Study II cohort conducted by the Centers for Disease Control and Prevention and the Food and Drug Administration, which aimed to better understand infant feeding practices and their impact on health(Reference Fein, Labiner-Wolfe and Shealy16). Details regarding data collection methods have been previously reported(Reference Fein, Labiner-Wolfe and Shealy16). Briefly, 4902 women who were approximately 7 months pregnant were recruited between May and December of 2005 from a national US consumer opinion panel of over 500 000 households. Upon recruitment, participants completed demographic and prenatal surveys. A subset of 1444 women completed a modified Diet History Questionnaire, a validated FFQ developed by the National Cancer Institute(17); modifications to better assess prenatal diet included changing the time frame to reflect a month of intake rather than a year and questions were added about supplements and foods of interest during pregnancy (e.g. fish). The Diet History Questionnaire was mailed to women who returned the prenatal questionnaire with adequate time to complete the Diet History Questionnaire prior to birth. Using the National Cancer Institute’s Diet*Calc software, the responses were analysed for intakes of food groups, nutrients and other dietary constituents.
Women were included in the original Infant Feeding Practices Study II if they and their infant were free of health conditions that impact feeding, the infant was born after 34 weeks of gestation from a singleton pregnancy with a birth weight >2·3 kg (5 lb) and had not stayed in the intensive care unit longer than 3 d. In the year after birth, ten follow-up surveys were sent along with an additional follow-up survey when the child was about 6 years old.
Measures
Data for the present analysis included self-reported items collected prenatally. The exposure variables, race and SES, were created using variables from the demographic questionnaire. Diet quality, the outcome variable, and energy intake, a covariate, were assessed using data from the Diet History Questionnaires and Diet*Calc output. Additional covariates included maternal age and education from the demographic survey, as well as smoking status, pre-pregnancy BMI and parity from the prenatal survey.
Data on household poverty income ratio and WIC participation status were combined to create a variable to reflect SES to simultaneously assess the relationship between both WIC participation and income on prenatal diet quality. On the prenatal survey, mothers reported their WIC participation status in the past month (note: mothers indicating that only their child was enrolled in WIC were not counted as WIC participants). The SES variable had four levels: WIC participants, low-income (poverty income ratio ≤1·85, WIC income-eligible but not participating(18)), middle-income (poverty income ratio >1·85 but <4) and high-income (poverty income ratio ≥4). On the demographic questionnaire, women identified themselves as NHW, NHB, Hispanic, Asian/Pacific Islander or other/multiple races. The present analysis focused primarily on differences between NHW and NHB due to consistent evidence of disparities between these groups in the broader US population(Reference Kirkpatrick, Dodd and Reedy12). Therefore, women who identified as Hispanic, Asian/Pacific Islander or other/multiple races were grouped in the Other races group.
Diet History Questionnaire responses and Diet*Calc output were used to calculate prenatal diet quality scores with the Alternative Healthy Eating Index for Pregnancy (AHEI-P), a modified version of the Alternative Healthy Eating Index-2010, a validated measure of diet quality(Reference Chiuve, Fung and Rimm19). The AHEI-P used in the present study was adapted by Poon et al.(Reference Poon, Yeung and Boghossian20). The AHEI-P includes ten out of the eleven Alternative Healthy Eating Index-2010 components, including vegetables, whole fruit, whole grains, sugar-sweetened beverages (including fruit juice), nuts and legumes, red and processed meat, trans-fat, fatty acids (EPA and DHA), PUFA and sodium. Modifications made to the Alternative Healthy Eating Index-2010 for creation of the AHEI-P included the addition of three components for micronutrients important during pregnancy (calcium, iron and folate; note: supplementation did not contribute to micronutrient scores) and the omission of the alcohol component (in this sample, less than 9 % of respondents reported any alcohol consumption on the FFQ). The AHEI-P is comprised of thirteen components which all contribute equally (10 points/component) to the total maximum score of 130 points. Intermediate intakes were scored proportionately. For example, four servings of whole fruit per day correlates with a maximum score of 10 points, so an intake of two servings per day equates to 5 points. Components were classified as either moderation or adequacy components. Moderation components (sugar-sweetened beverages, red and processed meat, trans-fat and sodium) were scored inversely (i.e. lower intake results in a higher score) because limited intake is recommended. Higher scores for adequacy components (e.g. whole fruit, whole grains, vegetables) indicate better adherence to recommendations for healthful foods.
Potential covariates were selected based on the previous literature and included maternal age, education, parity, smoking status, pre-pregnancy BMI and energy intake(Reference Shin, Lee and Song5,Reference Rifas-Shiman, Rich-Edwards and Kleinman6,Reference Bodnar and Siega-Riz9,Reference Siega-Riz, Bodnar and Savitz10) . In the models examining SES, race was considered as a covariate and in the models examining race, WIC participation and income were considered as individual covariates in order to examine the variables’ individual impacts (rather than composite). Maternal age was a continuous variable. Education was recategorized from the original seven categories (ranging from some grade school to post-college graduate education) into three categories: high school or less, some college and college graduate. Parity was categorized as primiparous or multiparous based on the mothers’ previous births. Smoking status was categorized into currently non-smoking (0 cigarettes/d) and smoking (>0 cigarettes/d). Pre-pregnancy BMI was categorized into four groups defined by the Centers for Disease Control and Prevention: underweight (<18·5 kg/m2), normal weight (≥18·5–24·9 kg/m2), overweight (≥25·0–29·9 kg/m2) or obese (≥30·0 kg/m2)(21). The Diet*Calc output informed energy intake (in kcal/d).
Data analysis
Of the 1444 women with dietary data, one had an implausible BMI value of 9·25 kg/m2. Due to implausible energy intakes, we excluded 121 participants where energy intake was <4·5 MJ/d (1075 kcal/d) or >20 MJ/d (4777 kcal/d). Two ranges of plausible energy intake were examined: (i) 2·5–15 MJ/d (1075–4777 kcal/d), a range specific to pregnancy identified by Meltzer et al. in a prospective Norwegian pregnancy cohort based on FFQ completed in mid-pregnancy(Reference Meltzer, Brantsaeter and Ydersbond22); and (ii) 2·1–14·5 MJ/d (500–3500 kcal/d), a range commonly used in studies of non-pregnant women(Reference Willett23). Using the more liberal, pregnancy-specific range, we excluded n 93 where energy intake ranged from 2·8 to 4·5 MJ/d (674–1070 kcal/d) and n 28 where energy intake ranged from 20·2 to 29·2 MJ/d (4819–6264 kcal/d). Continuous data were examined for normality using Q–Q plots. Descriptive statistics including means and frequencies were calculated for the total sample and among SES and racial groups. Comparisons of descriptive statistics across SES and racial groups were completed using χ 2 tests for categorical variables and unadjusted ANOVA for continuous variables.
Generalized linear models compared AHEI-P total and component scores across SES and racial groups. Preliminary models were age-adjusted since age is often correlated with diet quality(Reference Hiza, Casavale and Guenther24) and fully adjusted models were further adjusted for selected covariates as well as energy intake as the AHEI-P does not control for energy intake. Covariates were selected to include in the final models if they were both significant when added singly into the model and determined by the researchers to be impactful on scores in comparison to age-adjusted scores. The final model for SES included covariates for age, race, smoking and energy intake. The final model for race included covariates for age, income, smoking, WIC participation and energy intake. When a significant main effect was detected in the overall model, post hoc between-group comparisons were made with the Tukey adjustment. We tested interactions between variables that have been related in previous studies including: (i) SES and (a) kcal(Reference Drewnowski and Darmon25) and (b) education; and (ii) race and (a) BMI(Reference Beydoun and Wang26) and (b) income(Reference Kirkpatrick, Dodd and Reedy12), using a threshold of P < 0·05 to determine significance. In the case of significant interactions, we conducted stratified analyses. All analyses were completed using the statistical software package SAS version 9.4. All significance tests were two-sided and used P < 0·05 to indicate significance.
Results
In this sample of 1322 women from the Infant Feeding Practices Study II, participants had a mean age of 28·9 (se 5·6) years and were generally highly educated (40 % college graduates), NHW (84 %) and multiparous (71 %; Table 1). Nearly 30 % participated in WIC and about 18 % of women reported high household incomes. The mean AHEI-P score was 61·7 out of 130 points. Across different SES groups, significant differences were detected for age (P < 0·0001), AHEI-P score (P < 0·0001), pre-pregnancy BMI (P = 0·002), education (P < 0·0001), parity (P < 0·0001), race (P = 0·007) and smoking (P < 0·0001). Descriptively, compared with high- and middle-income, low-income and WIC participants had a higher proportion of women who were younger, less educated, NHB, smokers and underweight; high-income and WIC-participating women were more often primiparous than low- and middle-income women. Significant differences were detected across different races in age (P = 0·001), AHEI-P score (P = 0·04), pre-pregnancy BMI (P = 0·03) and SES (P = 0·007). Descriptively, NHB women were younger and of lower SES and a higher proportion of Other races and NHB women were of normal weight compared with NHW women.
Table 1 Maternal characteristics for the sub-sample of 1322 women in the Infant Feeding Practices Study II who completed the prenatal Diet History Questionnaire

WIC, Special Supplemental Nutrition Program for Women, Infants, and Children; SES, socio-economic status; AHEI-P, Alternative Healthy Eating Index for Pregnancy.
Missing data were present among education (n 128), race (n 46), parity (n 66), SES (n 38), smoking (n 42), pre-pregnancy BMI (n 54) and gestational weight gain (n 414). Of the 1444 participants who completed the prenatal Diet History Questionnaire, 121 were excluded for implausible energy intake and one was excluded for implausible BMI.
Significant differences across racial and SES groups were assessed using the χ 2 test for categorical variables and unadjusted ANOVA for continuous variables.
* Other races include including Hispanic, Asian/Pacific Islander, multiracial, and other races.
† Mother participated in WIC during pregnancy.
‡ Low-income (poverty income ratio ≤1·85) does not include women who are WIC participants.
§ Poverty income ratio >1·85 but <4.
‖ Poverty income ratio ≥4.
¶ Significant differences across races.
** Significant differences across SES levels.
†† Gestational weight gain category was determined according to the 2009 Institute of Medicine’s pre-pregnancy BMI-dependent gestational weight gain recommendations.
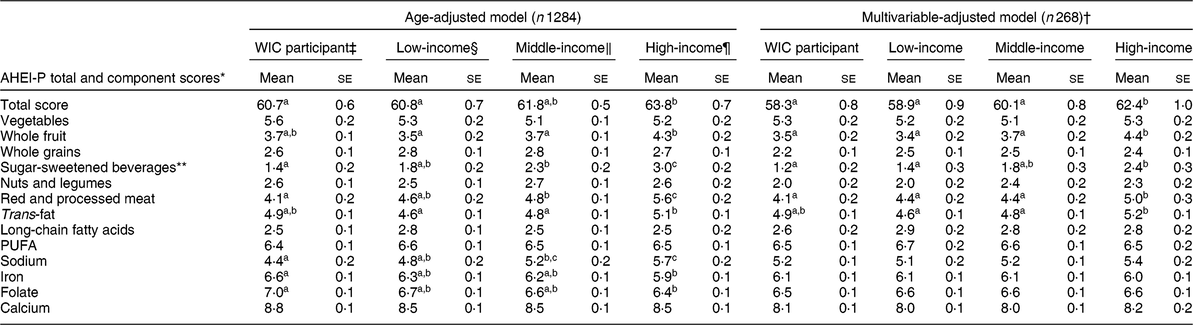
Table 2 presents age- and multivariable-adjusted total and component AHEI-P scores among SES groups to examine contributors to differences in overall diet quality. In both age- and multivariable-adjusted models, mean total score was significantly (P < 0·001) different across SES groups. In the age-adjusted model, post hoc comparisons indicated that high-income women (63·8 (se 0·7)) scored significantly higher than WIC participants (60·7 (se 0·6), P = 0·01) and low-income non-participants (60·8 (se 0·7), P = 0·01) but similar to middle-income women (61·8 (se 0·5), P = 0·08). Associations were similar in the multivariable-adjusted model where high-income women (62·4 (se 1·0)) scored significantly higher than middle-income women (60·1 (se 0·8), P = 0·02), low-income women (58·9 (se 0·9), P < 0·001) and WIC participants (58·3 (se 0·8), P < 0·001). All interactions tested were non-significant.
Table 2 Age- and multivariable-adjusted Alternate Healthy Eating Index for Pregnancy (AHEI-P) total and component scores by income and Special Supplemental Nutrition Program for Women, Infants, and Children (WIC) participation status of participants in the Infant Feeding Practices Study II
Missing data were present among race (n 46), socio-economic status (n 38) and smoking (n 42). Of the 1444 participants who completed the prenatal Diet History Questionnaire, 121 were excluded for implausible energy intake and one was excluded for implausible BMI.
a,b,cMean values within a row for each model with unlike superscript letters were significantly different in Tukey-adjusted post hoc differences between groups (P < 0·05).
* Higher scores indicate better adherence to dietary recommendations. Total scores are out of 130 points and all components are out of 10 points. Inverse scoring (where lower consumption equates to a higher score) was used for the following categories: sugar-sweetened beverages (and fruit juice), red and processed meat, trans-fat and sodium.
† The multivariable-adjusted model was adjusted for age, smoking, race and energy intake.
‡ The mother participated in WIC during pregnancy (n 366).
§ Poverty income ratio ≤1·85 (WIC income-eligible) and not participating in WIC during pregnancy (n 240).
‖ Poverty income ratio of >1·85 but <4 (n 451).
¶ Poverty income ratio ≥4 (n 227).
** Sugar-sweetened beverages includes fruit juice.
Significant differences in AHEI-P component scores were also detected in the multivariable-adjusted analysis. In addition to higher mean total AHEI-P score in the high-income group, higher mean component scores were observed for whole fruit, sugar-sweetened beverages, red and processed meat, and trans-fat. For whole fruit, high-income women (4·4 (se 0·2)) scored significantly higher (P < 0·001) than all other groups (3·7 (se 0·2) for middle-income, 3·4 (se 0·2) for low-income, 3·5 (se 0·2) for WIC participants). For sugar-sweetened beverages, high-income women (2·4 (se 0·3)) scored significantly higher (P < 0·001) than WIC participants (1·2 (se 0·2)) and low-income women (1·4 (se 0·2)). In the red and processed meat component, high-income women scored significantly higher (by 0·6–0·9 points) than WIC-participating (P = 0·003) and middle-income women (P = 0·04) and although low-income women scored similarly to middle-income women, there was no significant difference between low- and high-income women (P = 0·06). In the trans-fat component, high-income women (5·2 (se 0·1)) scored significantly higher than both middle-income (4·8 (se 0·1), P = 0·048) and low-income (4·6 (se 0·1), P = 0·002) women.
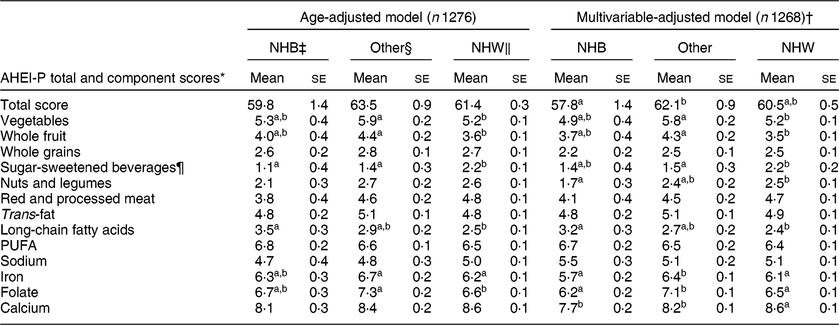
Table 3 displays age- and multivariable-adjusted AHEI-P total and component scores among racial groups to further examine differences in total diet quality. In both the age- and multivariable-adjusted models, mean total AHEI-P score was significantly (P < 0·001) different across NHB, NHW and Other races. However, in the age-adjusted model (Table 3), no significant post hoc differences between groups were observed after adjusting for multiple comparisons. After further adjustment for income, smoking status, WIC participation and energy intake, women in the Other races group (62·1 (se 0·9)) scored highest, significantly higher than NHB women (57·8 (se 1·4), P = 0·02), while NHW women (60·5 (se 0·5)) scored similarly to both NHB and Other races women. All interactions tested were non-significant.
Table 3 Age- and multivariable-adjusted Alternate Healthy Eating Index for Pregnancy (AHEI-P) total and component scores by race of participants in the Infant Feeding Practices Study II
NHB, non-Hispanic Black; NHW, non-Hispanic White.
Missing data were present among race (n 46), socio-economic status (n 38) and smoking (n 42). Of the 1444 participants who completed the prenatal Diet History Questionnaire, 121 were excluded for implausible energy intake and one was excluded for implausible BMI.
a,bMean values within a row for each model with unlike superscript letters were significantly different in Tukey-adjusted post hoc differences between groups (P < 0·05).
* Higher scores indicate better adherence to dietary recommendations. Total scores are out of 130 points and all components are out of 10 points. Inverse scoring (where lower consumption equates to a higher score) was used for the following categories: sugar-sweetened beverages (and fruit juice), red and processed meat, trans-fat and sodium.
† The multivariable-adjusted model was adjusted for age, poverty income ratio, smoking, Special Supplemental Nutrition Program for Women, Infants, and Children (WIC) participation during pregnancy and energy intake.
‡ Non-Hispanic Black (n 55).
§ Other races (n 150) was comprised of the following races/ethnicities: Hispanic (n 88), Asian/Pacific Islander (n 34) and other (n 28). Unadjusted mean scores for the subgroups were: 61·1 (se 10·2) for Hispanic, 67·9 (se 9·7) for Asian/Pacific Islander and 61·0 (se 12·6) for other.
‖ Non-Hispanic White (n 1071).
¶ Sugar-sweetened beverages includes fruit juice.
In addition to differences in total AHEI-P score observed among racial/ethnic groups, differences in component scores were also observed for vegetables, whole fruits, sugar-sweetened beverages, nuts and legumes, long-chain fatty acids, iron, folate and calcium. Women of Other races scored significantly higher than NHW women on components for vegetables (0·6 points higher, P = 0·02) and whole fruit (0·8 points higher, P = 0·003) and significantly lower than NHW women on the sugar-sweetened beverages component (0·7 points lower, P = 0·02). On the nuts and legumes component, NHW women (2·5 (se 0·1)) scored significantly higher than NHB women (1·7 (se 0·3), P = 0·03) and on the long-chain fatty acids component, NHB women (3·2 (se 0·3)) scored significantly higher than NHW women (2·4 (se 0·1), P = 0·01). Compared with Other races, NHB and NHW women scored significantly lower (0·3–0·9 points lower) on the components iron (P < 0·005) and folate (P < 0·001). In the calcium component, NHB women (7·7 (se 0·2), P < 0·001) and women in the Other races group (8·2 (se 0·1), P = 0·03) scored significantly lower than NHW women (8·6 (se 0·1)).
Discussion
The present study examined SES and racial disparities in prenatal diet quality in a national convenience sample and, similarly to previous studies(Reference Shin, Lee and Song5,Reference Rifas-Shiman, Rich-Edwards and Kleinman6,Reference Bodnar and Siega-Riz9,Reference Laraia, Bodnar and Siega-Riz11) , differences in total diet quality were observed across different SES and racial groups. While overall diet quality was low in this sample of pregnant women from the Infant Feeding Practices Study II, we identified several high-risk groups (WIC participants, low- and middle-income women, NHB women). Importantly, component scores potentially contributing to the observed disparities in total prenatal diet quality differed among groups: NHB women generally scored lower in adequacy components (e.g. nuts and legumes, micronutrients, etc.) compared with women of Other races while WIC participants and low- and middle-income women had higher intakes of moderation components (e.g. sugar-sweetened beverages, red and processed meat, trans-fat, etc.) compared with their high-income counterparts.
While some groups experienced disparities in prenatal diet quality, overall AHEI-P scores were low in this sample with a mean score of 61·7 (se 10·8) out of 130 points (or about 47·5 % of the maximum score), similar to a study on pregnant women in the National Health and Nutrition Examination Survey 2003–2012 where the average score was 50·7 points out of 100 (or 50·7 %) on the Healthy Eating Index-2010(Reference Shin, Lee and Song5). In the overall sample, component scores were low for sugar-sweetened beverages, nuts and legumes, long-chain fatty acids and whole grains, and high in the micronutrients (folate, iron and calcium) and PUFA components.
In SES analyses, high-income women had better scores than lower-SES women in three out of four AHEI-P moderation components (sugar-sweetened beverages, red and processed meat, and trans-fats) and one out of seven adequacy components (whole fruit), suggesting that in this sample, SES disparities are primarily driven by differences in unhealthful (rather than healthful) food consumption. These component score findings are inconsistent with previous research in regional convenience samples which have observed SES differences throughout both moderation and adequacy components(Reference Rifas-Shiman, Rich-Edwards and Kleinman6,Reference Bodnar and Siega-Riz9) . However, since high-income women in our sample scored higher than lower-SES women in only one adequacy component, these findings collectively imply that there is substantial need for dietary interventions during pregnancy across all SES levels. Pregnancy represents a time when many women are amenable to making lifestyle and dietary changes(Reference Forbes, Graham and Berglund27–Reference O’Keeffe, Dahly and Murphy29); therefore, nutrition education and counselling interventions broadly targeting pregnant women should be explored as a means for increasing diet quality across SES groups and subsequently impacting health outcomes in future generations.
The SES disparity we observed in moderation component scores could potentially be influenced by cost barriers to healthful foods. Food costs, or more specifically differences in food prices according to healthfulness, have been suggested as driving factors for diet quality and health disparities(Reference Darmon and Drewnowski30). Although many factors influence food purchasing decisions (e.g. taste, convenience, cultural norms)(Reference Darmon and Drewnowski30), due to the inverse association between food cost and energy density, shoppers with financial constraints may purchase energy-dense foods (e.g. foods with refined grains, added sugar and fat) in order to save money(Reference Drewnowski and Darmon25). Furthermore, food insecurity was not evaluated in the Infant Feeding Practices Study II but may be influential in food purchasing(Reference Morales and Berkowitz31) and subsequently diet quality.
In contrast to SES findings, differences across racial/ethnic groups appeared to be driven by lower healthful food consumption by NHB women. Scores were similar across racial/ethnic groups in the moderation component scores except for sugar-sweetened beverages, where women of Other races scored lowest. However, although sugar-sweetened beverages scores were low for women of Other races, higher scores in whole fruit, vegetables, iron and folate contributed to the highest overall scores in this group. Women in the Other races group represented several different minority racial and ethnic groups including Hispanic (n 88), Asian or Pacific Islander (n 34) and Other/multiple races (n 28). Due to the diversity within our Other races group, it is difficult to speculate on the mechanism underlying higher overall diet quality in this group; however, there is likely substantial variation in dietary patterns. Factors such as acculturation, language barriers and cultural norms can influence diet quality in minority racial/ethnic groups(Reference Satia13). For instance, in Hispanic US populations, as the amount of time spent in the USA increases, diet quality tends to decrease(Reference Duffey, Gordon-Larsen and Ayala32). Furthermore, since only English-speaking women were included in the original study, our findings are not reflective of the overall population.
Although our findings indicated a positive association between SES and diet quality, consistent with our initial hypotheses, WIC participation did not appear to mitigate the SES disparities in prenatal diet quality experienced by low-income women. Since WIC aims to improve the health of low-income pregnant women by providing nutritious food packages (including juice, milk, cereal, eggs, legumes and peanut butter)(18), the similar scores observed in both WIC participants and low-income (WIC income-qualified) non-participants were unexpected.
There are a few potential explanations for the similar scores observed between WIC participants and low-income non-participants. Since diet quality was assessed at only one point in time, we were unable to assess how much WIC participation may have changed diet quality. Additionally, WIC packages may be used to obtain foods that are already consumed in the normal diet, resulting in little change in overall dietary intake. Furthermore, unmeasured confounders obscuring the differences between WIC participants and low-income non-participants may have been present as previous research has indicated that structural barriers such as time, childcare and transportation may contribute to the decision not to participate in WIC(Reference Liu and Liu33), suggesting that systematic differences between WIC participants and low-income non-participants could be present. Importantly, similar adequacy component scores across income groups (high-/middle-income, WIC participants and WIC income-eligible non-participants) suggest that supplementary income may not be enough to improve dietary patterns during pregnancy. Therefore, behaviour change interventions such as prenatal nutrition education and counselling, which have been shown to improve pregnancy-related health outcomes (e.g. improved gestational weight gain, reduced risk of anaemia and preterm birth)(Reference Stang and Huffman34,Reference Girard and Olude35) , should be further explored as a mechanism for improving prenatal diet quality.
It should also be noted that changes made to the WIC package in 2009 increased the amount of high-quality foods provided(36). These changes came into effect after Infant Feeding Practices Study II data collection which took place in 2005–2007. With the 2009 revisions, which resulted in less fruit juice, more whole fruits and vegetables, and replacement of refined grains with whole grains(Reference Schultz, Byker Shanks and Houghtaling37), WIC participation may now have a more substantial impact on prenatal diet quality. Therefore, further research is needed to examine the influence of the updated WIC package on prenatal diet quality.
Our results also highlight the need for greater research on racial disparities in prenatal diet quality as findings in the present study and in the collective previous research(Reference Shin, Lee and Song5,Reference Rifas-Shiman, Rich-Edwards and Kleinman6,Reference Bodnar and Siega-Riz9,Reference Laraia, Bodnar and Siega-Riz11) are inconsistent with findings from the broader US population where racial minorities, specifically NHB individuals, are at increased risk for diet-related disparities(Reference Kirkpatrick, Dodd and Reedy12,Reference Satia13,Reference Kant, Graubard and Kumanyika38) . Although we observed significant differences between NHW and NHB only in component scores for nuts and legumes, long-chain fatty acids and calcium, in most of the remaining component scores NHB women had descriptively (but not significantly) lower scores compared with NHW and Other races women. The sample size for NHB women was relatively small and it is possible that there are disparities between NHW and NHB women that were not detected in the current analysis due to sample size constraints.
The present analysis is not without limitations. The data were collected in 2005–2007 and the sample was predominantly NHW women and highly educated women, which lessens the generalizability of the results. Despite the sample limitations, disparities were still present among SES and racial groups. In examining SES, we were unable to assess how factors such as Supplemental Nutrition Assistance Program participation and food insecurity may also be related to prenatal diet quality. Dietary history was self-reported, which is subject to measurement error and susceptible to bias(Reference Subar, Freedman and Tooze39). It should also be noted that although the AHEI-P is based on a validated index(Reference Poon, Yeung and Boghossian20), the AHEI-P itself is not validated. Currently, there are no known diet quality indices that have been validated for use in pregnancy. Validating a diet quality index for pregnancy is an important step in furthering the understanding of the predictors of prenatal diet quality.
In designing the present analysis, we sought to address the collective limitations present in previous studies such as use of homogeneous, regional samples, lack of a holistic assessment of diet quality and lack of control for confounding variables. The present study contributes to the current understanding of racial and ethnic disparities in diet quality by examining a large national convenience sample, using a holistic indicator of diet quality and controlling for confounding variables. Additionally, we examined the relationship between WIC participation and prenatal diet quality which, to our knowledge, only one previous study conducted approximately 30 years ago has examined(Reference Suitor, Gardner and Feldstein14).
Conclusion
In this sample of women in the Infant Feeding Practices Study II cohort, diet quality differed across SES and racial groups. Findings of the study suggest that racial and income-based disparities may be influenced prior to birth. Further research is necessary to determine the consistency and magnitude of SES and racial prenatal diet quality disparities as well as the influence of the updated WIC packages on prenatal diet quality. Since prenatal diet impacts lifelong health outcomes in the offspring, identification of the subgroups at increased risk of poor prenatal diet quality is essential so that limited resources for public health interventions and nutrition assistance programmes can make the biggest impact. Across all groups, interventions are needed to increase the intake of adequacy components (particularly in NHB women) and decrease the intake of moderation components (particularly in low- and middle-income women and WIC participants). While higher priority should be given to high-risk subgroups, an urgent need for nutrition education interventions aiming to broadly improve prenatal diet quality exists across all groups of pregnant women in the USA.
Acknowledgements
Acknowledgements: This manuscript has been adapted from H.W.P.’s master’s thesis. Financial support: This research received no specific grant from any funding agency in the public, commercial or not-for-profit sectors. Conflicts of interest: None. Authorship: H.W.P., A.T., K.M. and M.V. contributed to formulating the research questions and designing the study. H.W.P. completed the analysis and the first draft of the manuscript. A.T., M.K. and M.V. provided assistance with the analysis and critical edits to the manuscript. Ethics of human subject participation: For the original study, the Food and Drug Administration’s Research Involving Human Subjects Committee and the US Office of Management and Budget reviewed and approved the study procedures and participant materials. The University of Rhode Island Institutional Review Board deemed the present secondary analysis exempt from review.


