


Feeding difficulties in childhood are a matter of concern for parents and health workers. Food neophobia is considered a behaviour trait linked to adverse eating patterns and, therefore, requires addressing early in childhood. Although food neophobia does not appear to be associated with the child’s weight status(Reference Brown, Vander Schaaf and Cohen1), it may negatively interfere with the development of food preferences and consequently with food choices and nutrient intake(Reference Russell and Worsley2). Moreover, longitudinal studies have revealed that early neophobic behaviour negatively impacts food intake at later ages(Reference Oliveira, Jones and de Lauzon-Guillain3,Reference Moding and Stifter4) .
Food neophobia is defined as the reluctance to eat or the avoidance of new or unfamiliar foods(Reference Brown, Vander Schaaf and Cohen1,Reference Dovey, Staples and Gibson5) . It has been described that all children naturally present some degree of food neophobia because it is a genetic predisposition of omnivorous species to protect against the ingestion of potentially toxic substances, but this reaction/behaviour tends to decrease following the learning generated by repeated exposure to new foods(Reference Birch6). Thus, neophobia can be discreetly observed in the first year of life in the introduction phase of complementary foods to breast milk, peaks between 2 and 6 years of age and decreases at later ages(Reference Cooke, Wardle and Gibson7).
Although food neophobia is a behaviour determined by genetic and hereditary aspects (sensory sensitivity and temperament), environmental and social factors, such as eating behaviour and parental style, and food environment (food availability and accessibility) play a crucial role in the behaviour intensity and duration(Reference Cooke, Carnell and Wardle8,Reference Blissett and Fogel9) . Thus, such factors determine individual variations in the degree of neophobic behaviour.
Although the topic of childhood food neophobia has been extensively investigated, most studies have been conducted with populations from developed countries (the United Kingdom, Australia, the USA, Japan and France)(Reference Cooke, Wardle and Gibson7,Reference Bell, Jansen and Mallan10–Reference Yuan, Rigal and Monnery-Patris13) , which represent a scenario that may differ from that in developing countries, such as Brazil, and in families with low socio-economic conditions. Thus, due to the lack of research on neophobia in these different environmental and cultural scenarios, further studies on these subjects are warranted, representing the possibility of identifying different associations.
The food intake of neophobic children is related to the low intake of vegetables(Reference Johnson, Davies and Boles11,Reference Tsuji, Nakamura and Tamai12,Reference Kaar, Shapiro and Fell14,Reference Koziol-Kozakowska, Piorecka and Schlegel-Zawadzka15) , and in some cases, it is also associated with low fruit intake(Reference Oliveira, Jones and de Lauzon-Guillain3,Reference Cooke, Wardle and Gibson7,Reference Yuan, Rigal and Monnery-Patris13,Reference Helland, Bere and Bjornara16) . However, aspects such as low protein-rich food intake and increased consumption of low nutritional quality food(Reference Cooke, Carnell and Wardle8,Reference Koziol-Kozakowska, Piorecka and Schlegel-Zawadzka15–Reference Perry, Mallan and Koo18) are still controversial. Despite several studies evaluating food consumption related to neophobia, to date, none has used the method of dietary pattern analysis, which would allow a multidimensional approach that considers the interactions between nutrients and foods consumed by these children.
The dietary patterns of preschoolers in Brazil, despite the heterogeneity between regions of the country and socio-economic conditions of families, follow the global trend characterised by low consumption of meat, fruits and vegetables and high consumption of fried foods, sweets, sodas and salt(Reference Souza Rde, Madruga and Gigante19–Reference Mello, Barros and de Morais21), which are associated with nutritional deficiencies and overweight. Considering that neophobic behaviour has been associated with low diet quality and variety(Reference Bell, Jansen and Mallan10,Reference Kaar, Shapiro and Fell14,Reference Falciglia, Couch and Gribble17,Reference Perry, Mallan and Koo18) , investigating dietary patterns in groups of greater social and biological vulnerability, such as low-income neophobic preschoolers, would better inform policies and future interventions for prevention of nutritional deficiencies and disorders, as well as the promotion of healthy eating habits. Therefore, this study aimed to associate dietary patterns and food neophobia in low-income Brazilian preschoolers.
Methods
Participants
This cross-sectional study included children aged 3 to 6 years of both sexes enrolled in semi-full-time philanthropic public schools of early childhood education located in Aracaju, northeast Brazil. The study was conducted from July to December 2017. Philanthropic public schools are non-profit educational institutions that provide educational, pedagogical, speech-language, nutritional, legal, psychological and social assistance to children from low-income families. These institutions are funded by nongovernmental organisations and rely on financial, food, material and physical donations. The institutions were found through an existing formal register, which contained the names and addresses of the philanthropic schools incorporated into the local education system. The first meeting with the institutions was a phone call to schedule a meeting for clarifying the study aims and to invite them to participate. All semi-full-time philanthropic schools were eligible for the study (n 5).
Of the total eligible preschoolers (n 350), 238 participated in the study with their respective parents. Twenty-four children were excluded, twenty of them due to preexisting disease (neurological diseases, autism spectrum disorder, allergies and/or food intolerances) and four because of a lack of information on questionnaires fulfilled by their parents. Written informed consent was obtained from all the parents.
To obtain the characteristics of the studied sample (sex, age, maternal education, birth order, gestational age, birth weight and breast-feeding history), a structured questionnaire was provided to parents by trained interviewers when children arrived at or left school. The Child Food Neophobia Scale and a semi-quantitative FFQ were also collected. For parents who were not able to complete the questionnaire, a new date was scheduled. The children’s anthropometric measurements were collected at school in the week following the interview with the parents.
Food neophobia
A validated Portuguese version of the Child Food Neophobia Scale(Reference Gomes, Barros and Pereira22) was used to assess the parents’ perceptions about their child’s food neophobia. Responses were registered on a five-point Likert scale by the degree of agreement. Scale results ranged from ten to fifty points, where higher scores indicated higher levels of food neophobia. The classification of neophobia levels was based on the study by Kozial-Kozakowska et al. (Reference Koziol-Kozakowska, Piorecka and Schlegel-Zawadzka15), where a high level of neophobia was defined as a score >1 SD above the mean of the study. In the present study, the mean score of the neophobia scale was 30·5, and the sd was 7·5. Thus, three groups were identified: a low level (≤ 22 points), medium level (≥ 23 and ≤ 37) and high level of food neophobia (≥ 38 points). The Cronbach’s α for the ten-item neophobia scale applied in the present study was α = 0·86, ensuring the internal reliability of this instrument.
Food consumption
A validated semi-quantitative FFQ was administered to parents(Reference Souza Rde, Madruga and Gigante19). This questionnaire included fifty-six food items divided into nine food groups (cereals, legumes, vegetables, fruits, milk and dairy products, meats, fats, sugars and some foods such as chips, cookies, coffee and gelatine). The average portion of the food was defined based on the 50th percentile of the distribution of the amount ingested. Small portions were defined as half of the middle portions, large portions as twice the middle portions and extra-large portions as 2·5 times the portion averages. The FFQ asked how often in the last 6 months the child has consumed each item, with frequencies ranging from 0 to 10 times per d, week and month, as well as the portion size consumed.
Anthropometric measurement
The children’s weight and height were measured in duplicate by a trained team according to anthropometric standardisation(23). Height was measured using a portable wall-mounted anthropometer with a capacity of 213 cm and graduation of 0·1 cm, and weight was measured with a digital scale for up to 150 kg and 100 g graduation.
The Z-scores of the anthropometric indexes of BMI-for-age and height-for-age were calculated using WHO Anthro Plus software, version 1.0.4. BMI-for-age was classified as underweight (< –2 Z-score), normal weight (≥ –2 and ≤ +1 Z-score), risk of overweight (> +1 and ≤ +2 Z-score for children ≤ 5 years old), overweight and obese (> +2 Z-score for children ≤ 5 years old) and overweight and obese (> +1 Z-score for children > 5 years old). Height-for-age was classified as stunted (< –2 Z-score) and adequate height (≥ –2 Z-score). All parents received the individual diagnosis of their children’s current anthropometric status.
Statistical analysis
Data were tabulated in the Epidata version 3.1 programme, except for the FFQ, which was tabulated using Microsoft Excel, version 2013. Statistical analyses were performed using Stata 13 software (StataCorp.), and the significance level adopted was 5 %.
Data are presented as the means and standard deviations for continuous variables and frequencies for categorical variables. The Kolmogorov–Smirnov test was performed to verify the normality of the data distribution, supporting the choices of the statistical tests employed. Student’s t-test for independent samples was used to assess the association between food neophobia scores and socio-demographic variables, birth conditions, breast-feeding history and anthropometric data. ANOVA followed by Bonferroni’s post hoc test was performed to evaluate the association between food neophobia scores and dietary patterns (in tertiles).
Consumption of food groups according to the level of food neophobia was assessed using radar charts. To identify preschoolers’ dietary patterns, the FFQ was used. Foods were grouped into twenty-four groups according to nutritional value, culinary use and regional eating habits. The food groups were submitted to exploratory factor analysis to obtain dietary patterns. Initially, factors with an eigenvalue greater than or equal to 1·25 were maintained, retaining nine factors to represent the dietary pattern. In the second stage, a visual inspection of the scree plot graph was performed, which suggested the maintenance of three dietary pattern factors. Next, a Varimax orthogonal rotation was applied to improve the interpretability of the factor load matrix. Factor loads greater than or equal to | 0·30 | were considered to contribute to the dietary pattern. Three patterns were identified: traditional, snacks and school snacks. The three patterns retained in the factor analysis were ‘named’ based on the interpretation of the factor loads, eating habits, foods with higher factor loads and traditional Brazilian cuisine. Factor scores were estimated by multiple regression analysis, and each individual received a score for each dietary pattern. These scores indicate the degree to which each participant adhered to the pattern. The Kaiser–Meyer–Olkin (KMO) measure of sample adequacy was used to assess data adequacy for exploratory factor analysis.
Multiple linear regression models were used to investigate the association between neophobia and adherence to dietary patterns. Confounding factors used in the study were selected based on earlier studies on factors influencing infant feeding and food neophobia. The dependent variable was the food neophobia score. Independent variables were dietary patterns (tertiles), adjusted for sex(Reference Cao, Svensson and Marcus24,Reference Migraine, Nicklaus and Parnet25) , age(Reference Łoboś and Januszewicz26), gestational age(Reference Johnson, Matthews and Draper27), birth weight(Reference Howard, Mallan and Byrne28), birth order(Reference Sanchez-Escobedo, Azcorra and Bogin29), maternal education(Reference Migraine, Nicklaus and Parnet25) and BMI-for-age (Z-score)(Reference Dubois, Farmer and Girard30).
Results
The final sample consisted of 214 children and their respective parents. Most of the children evaluated were female, 5–6 years old, normal weight, term, adequate birth weight, breastfed and with mothers with <11 years of schooling (Table 1). The prevalence of low/medium and high food neophobia among preschoolers was 85·9 % and 11·2 %, respectively.
Table 1 Characteristics of low-income preschoolers and their parents

There were no underweight children (BMI-for-age < –2 Z-score) in this sample.
* n 214.
† n 210.
‡ n 77.
§ n 115.
|| n 199.
¶ n 208.
As shown in Fig. 1, children with low/medium neophobia presented varied consumption of food groups such as potatoes, coffee, red meat, non-leafy vegetables and chocolate powder. By contrast, children with high neophobia consumed ultra-processed foods (snack foods and filled cookies), unfilled cookies, sweets, white meat, cheese and yogurt. Low consumption of beans, fruits and tubers (yam and cassava) was observed at both levels of neophobia.
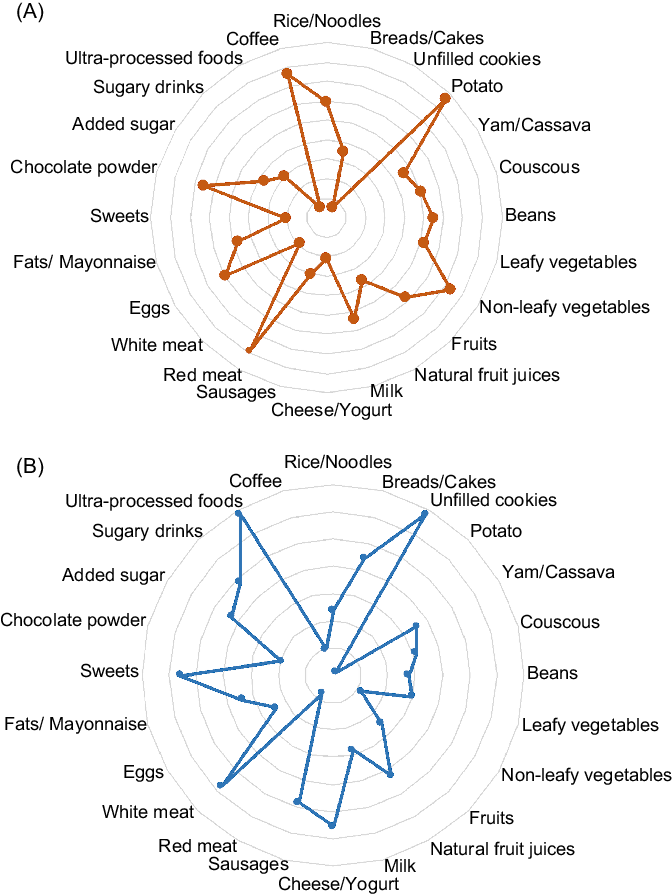
Fig. 1 Radar plot of preschooler food group intake according to levels of food neophobia (A – medium and low neophobia, B – high neophobia)
Exploratory factor analysis identified three dietary patterns classified as traditional, snacks and school snacks (Table 2). These patterns explained 28·9 % of the total variance of the data. The traditional pattern is basically composed of foods typical of the Brazilian diet and culture, including rice/noodles, beans, yam/cassava, leafy and non-leafy vegetables and fruits as well as unfilled cookies, milk, cheese/yogurt, red and white meat, eggs, sweets, chocolate powder and added sugar (positive charges). The traditional pattern explained 13·5 % of the data variance. The snack pattern included breads/cakes, sausages, fats (margarine, butter and mayonnaise), sweets, sugary drinks and ultra-processed foods (cookies and Cheetos) (positive charges) and leafy vegetables (negative charge) and explained 8·2 % of the data variance. The pattern school snacks included breads/cake, unfilled cookies and natural juice (positive charges) and leafy vegetables, sweets and added sugar (negative charges). The school snack pattern explained 7·2 % of the data variance.
Table 2 Factor loading for dietary patterns obtained in factor analysis

Food groups with factor loadings lower |0·30| were omitted.
Table 3 presents the food neophobia scores according to general characteristics and dietary patterns. Food neophobia was more frequent among children with stunted height (P = 0·032) and among those with less adherence to the traditional eating pattern (P = 0·005).
Table 3 Food neophobia (mean and sd) according to general characteristics and dietary patterns of low-income preschoolers

* Significant difference between tertiles 1 and 3 (Bonferroni post hoc test).
Table 4 shows the associations between food neophobia scores and dietary patterns adjusted for confounding factors. The traditional pattern was inversely associated with food neophobia, regardless of the other variables. The snack and school snack patterns were not associated with food neophobia.
Table 4 Multiple linear regression analysis between food neophobia scores and dietary patterns of low-income preschoolers

ref, reference category.
* All models were adjusted for sex, gestational age, birth weight, birth order, maternal education and BMI-for-age (Z-score).
Discussion
This study demonstrates that low-income Brazilian preschoolers with a high level of food neophobia have lower adherence to traditional dietary patterns and distinct food preferences than their peers with low-middle food neophobia and, therefore, were more likely to eat ultra-processed foods, such as chips, cookies (with and without filling) and sweets and protein-rich foods, such as dairy (cheese and yogurt) and white meat (particularly chicken). It should be noted that these foods have in common increased palatability due to their content of sugars and fats, low fibre content and soft consistency. This finding could be explained by the increased taste and smell sensitivity in neophobic children, which in turn leads to a lower tolerance to variations in food appearances, smells and flavours(Reference Coulthard and Blissett31), justifying their preference for foods with sensory characteristics similar to those of ultra-processed foods.
Studies with preschoolers from high-income populations showed a relationship between food neophobia and increased intake of unhealthy foods (such as snack foods and sweets) and with a reduction in the consumption of protein-rich foods, such as fish, chicken and cheese(Reference Cooke, Carnell and Wardle8,Reference Helland, Bere and Bjornara16) . However, our findings with a low-income population indicated both a reduction in healthy foods and fruits and vegetables, as well as consumption of lower nutritional quality.
Overall, three eating patterns were identified in the present study: traditional, snacks and school snacks. The so-called traditional dietary pattern is based on typical foods of Brazilian culture and can be considered the healthiest pattern observed, as it includes a variety of food groups, mostly fresh and minimally processed foods (rice/noodles, beans, tubers, leafy and non-leafy vegetables, fruits, dairy foods and meat). However, it also features ultra-processed foods, such as sweets, chocolate and unfilled cookies. The snack pattern was considered the most inappropriate dietary pattern observed, based on ultra-processed foods, which are salty, sugary and fatty foods depleted in protein, fibre and micronutrients, such as sausages, cookies, snacks, sugary drinks and sweets. The school snack pattern was based on minimally processed foods, such as breads, unfilled cookies, cakes and natural juice, which are the main foods offered as morning and afternoon snacks at schools. Such foods are often obtained by donations or purchased by schools due to their low cost and long shelf life(Reference Nasreddine, Shatila and Itani32).
Children with a high level of food neophobia showed a decreased adherence to traditional dietary patterns, which may interfere negatively with diet variety and lead to unbalanced nutrient intake(Reference Bell, Jansen and Mallan10,Reference Kaar, Shapiro and Fell14,Reference Falciglia, Couch and Gribble17) . Other studies described a reduced intake of fruits and vegetables by neophobic children, although most of these studies did not investigate dietary patterns(Reference Oliveira, Jones and de Lauzon-Guillain3,Reference Cooke, Carnell and Wardle8,Reference Johnson, Davies and Boles11–Reference Helland, Bere and Bjornara16) . Children with high levels of neophobia are more likely to reject foods before tasting them based on their appearance(Reference Russell and Worsley2,Reference Kaar, Shapiro and Fell14,Reference Perry, Mallan and Koo18) , especially vegetables(Reference Oliveira, Jones and de Lauzon-Guillain3,Reference Cooke, Carnell and Wardle8,Reference Johnson, Davies and Boles11,Reference Tsuji, Nakamura and Tamai12,Reference Kaar, Shapiro and Fell14,Reference Koziol-Kozakowska, Piorecka and Schlegel-Zawadzka15) . The rejection of vegetables by neophobic children has been justified by the natural survival mechanism of the human species to avoid potentially poisonous plants/substances. However, in some cases, refusal may be occasioned by negative previous feeding experiences with bitter tastes (naturally less accepted than sweet tastes)(Reference Tsuji, Nakamura and Tamai12). Other evidence suggests that difficulties related to tactile sensory processing and food acceptance found in neophobic children also exist in their parents. Thus, parents who have tactile sensitivity are unlikely to expose children to an environment with a wide range of textures(Reference Coulthard and Sahota33). The pattern analysis in the present study identified an impairment in the combination of foods/food groups in the diet of highly neophobic children, as it deviates from the healthiest dietary pattern of this population.
Children with lower levels of neophobia showed a more varied dietary pattern based on foods with different sensory characteristics, such as vegetable foods (non-leafy vegetables and potatoes), red meat, coffee and chocolate powder. It is noteworthy that the studied children who presented lower levels of neophobia also consumed ultra-processed foods and sugar added to coffee. Additionally, despite the level of neophobia, children showed low consumption of fresh and minimally processed foods, such as leafy vegetables (lettuce, cabbage and broccoli), fruits, beans and roots or tubers (yam and cassava), traditional foods of northeastern Brazil and important sources of nutrients. The substitution of fresh foods by ultra-processed foods is a current behaviour in Brazil, regardless of socio-economic status(Reference Martins, Levy and Claro34).
Food neophobia was not associated with childhood overweight and obesity, the most prevalent nutritional disorder identified in this study. Similar results have been described in a recent systematic review of food neophobia and children’s weight status(Reference Brown, Vander Schaaf and Cohen1). The univariate analysis showed that stunted preschool children had higher neophobia scores, indicating that children with high levels of neophobia in socially vulnerable conditions should receive special attention on growth trajectory.
School is an important environment for the development of eating habits and feeding behaviour. For socially vulnerable children, school meals are also an important source of nutrient supply; therefore, institutions should provide fresh and minimally processed meals. A study by Horta et al. (Reference Horta, Carmo and Junior35) confirmed the positive effect of having meals in public schools for 8–12-year-old Brazilian children living in areas of high social vulnerability. Children who eat school meals had higher consumption of unprocessed and minimally processed foods and sweets. Vieira et al. have also found that at day-care centres, traditional dietary patterns ensure lower consumption of sugars and saturated and trans fats and higher fibre intake(Reference Vieira, Castro and Fisberg20).
As a limitation of the study, we mention the impossibility of inferring a causal relationship between neophobia and the other variables due to the cross-sectional design. Another limitation is that the use of exploratory factor analysis to obtain dietary patterns requires arbitrary assumptions relevant to food grouping, the number of factors retained and their naming. However, to minimise the arbitrariness of choices, we followed the protocols commonly adopted in nutritional epidemiology(Reference Hu36). It is noteworthy that this is one of the few studies enrolling socially vulnerable children in the context of food neophobia, and it is the first study with Brazilian children that evaluates food neophobia using a validated and specific method.
Conclusion
A high level of food neophobia is associated with low consumption of vegetables and fruits and low adherence to the traditional dietary pattern of Brazilian food culture. This finding highlights neophobic feeding behaviour in socially vulnerable preschool children as a potential short- and long-term public health problem that requires increased attention from institutions, teachers, caregivers and parents. Moreover, this research may be used to better target the planning of public health policies.
Acknowledgements
Acknowledgements: The authors thank the schools and families who participated in the study. Financial support: This work was supported by the Coordenação de Aperfeiçoamento de Pessoal de Nível Superior – Brasil (CAPES) – Finance Code 001 and the Fundação de Apoio à Pesquisa e a Inovação Tecnológica do Estado de Sergipe (Fapitec/se) – Brazil. CAPES and Fapitec/se had no role in the design, analysis or writing of this article. Conflict of interest: There are no conflicts of interest. Authorship: L.A.A. contributed to the interpretation of data and wrote the manuscript. D.A.S.V. contributed to the analysis, interpretation of data and wrote the manuscript. B.N.F.S. conceived and designed the study and contributed to revising the article critically. D.G.S. conceived the study, designed the study and wrote the manuscript. S.M.V. and A.J.B. contributed to the analysis, interpretation of data and substantially revising the manuscript. All authors read and approved the submitted version. Ethics of human subject participation: This study was conducted according to the guidelines laid down in the Declaration of Helsinki, and all procedures involving human subjects were approved by the Ethics Committee of the Federal University of Sergipe, Brazil. Written informed consent was obtained from all subjects.


