


Front-of-pack (FOP) nutrition labelling is a policy intervention to address the growing global burden of diet-related non-communicable diseases(Reference Branca, Lartey and Oenema1). FOP labels aim to provide simplified or interpretative information on the nutritional quality or critical nutrient quantity (nutrients that may pose a substantial public health concern due to overconsumption, such as saturated fat, sugar and Na)(Reference McGuire2) of a food product or about the health consequences of consuming nutrients or products, to help consumers make inferences about the healthfulness of the product and support more nutritious choices(Reference Wartella, Lichtenstein and Yaktine3,4) . However, more research is needed to inform countries’ decisions about which FOP system to use(4), and to assess potential differential effects among sub-groups(4,Reference Ikonen, Sotgiu and Aydinli5) .
Various FOP labelling systems are implemented or being considered by governments globally(Reference Kanter, Vanderlee and Vandevijvere6). Labelling systems can be classified as interpretive (i.e. providing nutrition information as guidance rather than specific facts) or reductive (i.e. showing information only, with no specific judgement, opinion or recommendation), as summary indicators (i.e. providing an overall qualification of the product healthfulness) or nutrient-specific systems (i.e. providing nutrition information for a set of nutrients)(Reference Kanter, Vanderlee and Vandevijvere6). Some of the most commonly employed systems include the Guideline Daily Amounts (GDA), Multiple Traffic Lights (MTL), Health Star Rating (HSR), ‘High-in’ Warning Labels (HIWL) and Health Warning Labels (HWL) (Fig. 1). GDA are a reductive approach with no interpretative information developed by the food industry, which provide information about the nutrient amounts within a food and its contribution to adult recommended daily intake. This labelling format is voluntarily implemented by the food industry in several countries, including Canada and the United States (US) and was mandatory in Mexico from 2014 to 2020(Reference Kanter, Vanderlee and Vandevijvere6), when they were replaced by warning labels. MTL are interpretive nutrient-specific labels which provide similar information as GDA, but colour code each nutrient in order to communicate whether the product contains relatively low (green), average (yellow) or high (red) levels of critical nutrients. MTL have been implemented voluntarily in the United Kingdom (UK) since 2013, and approximately two-thirds of products in the UK carried the MTL in 2016(Reference Kanter, Vanderlee and Vandevijvere6,Reference Morrison7) . MTL have been implemented similarly in other countries, including Ecuador(8), Sri Lanka(9) and Iran(Reference Zargaraan, Dinarvand and Hosseini10). The HSR, an interpretive summary indicator endorsed by the governments of Australia and New Zealand for voluntary implementation since 2014, synthesises positive and negative nutrient information into a single dimension of healthfulness, rating the overall nutritional quality of the product from 0·5 to 5 stars(11). In 2017, the HSR system appeared on 28 % of foods(Reference Kanter, Vanderlee and Vandevijvere6,Reference Jones, Shahid and Neal12) . HIWL are interpretive nutrient-specific labels that show warning symbols (often octagonal) on food packages if energy and key nutrients (sugar, saturated fat and Na) exceed established thresholds and were first introduced in Chile in 2015(Reference Kanter, Vanderlee and Vandevijvere6). From an international regulatory and trade perspective, HIWL have been identified as a feasible mandatory system to implement(13), and legislations for mandatory HIWL have been implemented in Israel, Uruguay, Peru and Mexico(Reference Kanter, Vanderlee and Vandevijvere6,14) , and proposed or approved in Brazil(15), Argentina(Reference Argentina16) and Canada(17). Lastly, an interpretive nutrient-specific text-only HWL for sugar-sweetened beverage advertisements has been enacted in San Francisco, US but is being challenged in court and has also been proposed in seven US states(Reference Pomeranz, Mozaffarian and Micha18).

Fig. 1 Front-of-pack labels shown on product during experiment. (1) Guideline Daily Amounts (GDA), (2) Multiple Traffic Lights (MTL), (3) Health Star Rating (HSR), (4) ‘High-in’ Warning Labels (HIWL) and (5) Health Warning Labels (HWL)
FOP labels are theorised to shape purchasing and consumption behaviours through several mechanisms. Once noticed by the consumer, FOP labels may change the motivation to consume food products by modifying the way in which they are perceived(Reference Roberto, Ng and Ganderats Fuentes19). For example, highlighting the high content of nutrients of public health concern may decrease perceived healthfulness of a product previously misperceived as healthy (e.g. sweetened yogurt or sugary fruit drinks). Indeed real-life experiments suggest that changes in the perceived healthfulness of food products may influence consumption.(Reference Burton, Tangari and Howlett20,Reference Sogari, Li and Lefebvre21) Studies examining the effects of FOP labels on perceived healthfulness suggest that nutrient-specific labels (e.g. MTL, HIWL) and the HSR may be more effective in leading to lower ratings of unhealthy foods compared with GDA(Reference Ikonen, Sotgiu and Aydinli5,Reference Franco-Arellano, Vanderlee and Ahmed22–Reference Khandpur, de Morais Sato and Mais24) . A meta-analysis of experimental studies found that sugar-sweetened beverage warnings (including both HIWL and HWL) successfully lowered healthfulness perceptions compared with control conditions(Reference Grummon and Hall25). Finally, a recent scoping review of experimental studies of HIWL reported that these labels led to lower perceived healthfulness of products compared with control conditions or other labelling formats (i.e. GDA)(Reference Taillie, Hall and Popkin26).
However, a key question is whether FOP label effects are generalisable across countries. Previous international studies exploring country differences on labelling outcomes (e.g. perceived product healthfulness, label perceptions) have found inconclusive results, with some reporting differences across countries(Reference Möser, Hoefkens and van Camp27–Reference Grunert, Fernández-Celemín and Wills29), whereas others have not(Reference Talati, Egnell and Hercberg30–Reference Van Herpen, Seiss and Van Trijp32). To date, most of these international studies have been conducted in Europe(Reference Möser, Hoefkens and van Camp27,Reference Grunert, Fernández-Celemín and Wills29,Reference Feunekes, Gortemaker and Willems31) , with less representation of other regions in the world(Reference Egnell, Talati and Hercberg28,Reference Talati, Norman and Pettigrew33) . Additionally, a call has been made to focus research on the reach of FOP labels’ effects across sub-groups of consumers such as those with varying levels of nutrition knowledge, or among low-income populations(Reference Ikonen, Sotgiu and Aydinli5,Reference Taillie, Hall and Popkin26) .
The objective of this study was to test the effect of different kinds of FOP labels (GDA, MTL, HSR, HWL and HIWL) on the perceived product healthfulness in an international sample of adult consumers, including evaluation of differences by socio-demographic characteristics and country.
Methods
Study design and recruitment
A six-arm, unblinded online randomised experiment was conducted as part of the broader 2018 International Food Policy Study (IFPS), a cross-sectional survey of adults aged ≥18 years (n 22 824) from Australia, Canada, Mexico, the UK and the US, who completed an online survey in 2018. The IFPS assesses seven primary policy domains including price/taxation, food packaging and labelling, retail food policies, food marketing, nutritional labelling in restaurants, nutrition information and education, and food guide/dietary recommendations. For the present study, we analysed responses to one single question regarding the perceived healthfulness of a fruit drink labelled with differing FOP labels. The countries represent different policy approaches to FOP labels, as outlined above.
Approximately 2·9 % of participants (n 684) were excluded due to missing data in the outcome (n 634) or a technical glitch in the survey platform making participants view all experimental conditions on the screen (n 50), leaving 22 140 participants for analyses (Australia = 3964; Canada = 4311; Mexico = 4057; UK = 5290; US = 4518). Small differences between included and excluded participants were observed (P < 0·01) (online supplementary material, Supplemental Table 2). Missing data in the outcome across label conditions ranged from 1·8 to 3·7 % (P < 0·001) (online supplementary material, Supplemental Table 3).
Participants were recruited through the Nielsen Consumer Insights Global Panel and their partners’ panels using both probability and non-probability sampling methods. Random samples were drawn from online panels in each country, stratified by age and sex proportional to the general population in each country. Respondents provided consent prior to completing the survey and received remuneration in accordance with their panel’s usual incentive structure (e.g. points-based or monetary rewards). Surveys were conducted in English in Australia and the UK; Spanish in Mexico; English or French in Canada; and English or Spanish in the US.
Participants’ allocation and intervention
Using a central computer system, participants were randomly assigned to view on screen one of six images (6·5 cm × 13 cm) of a sweetened fruit drink with differing labelling: no label (control), GDA, MTL, HSR, HWL or HIWL (Fig. 1). These labelling systems were selected as they are either implemented or being considered as a policy option in the five IFPS countries. Researchers were blinded to the assigned intervention, but blinding of participants was not possible given the nature of the intervention.
FOP labels were displayed in the upper right corner of the front of the pack (Fig. 2 and online supplementary material, Supplemental Fig. 1). A sweetened fruit drink was utilised as the test product because processed fruit drinks are considered to be sugar-sweetened beverages and are commonly misperceived as healthy(Reference Moran and Roberto34,Reference Auerbach, Dibey and Vallila-Buchman35) , despite their high added sugar content and high contribution to energy intake(Reference Popkin and Hawkes36). The sweetened fruit drink box image was modelled after a popular drink package to appear authentic, but digitally altered to display fictitious brand names. Package text language and units of measures were altered to match typical product packaging in each country.
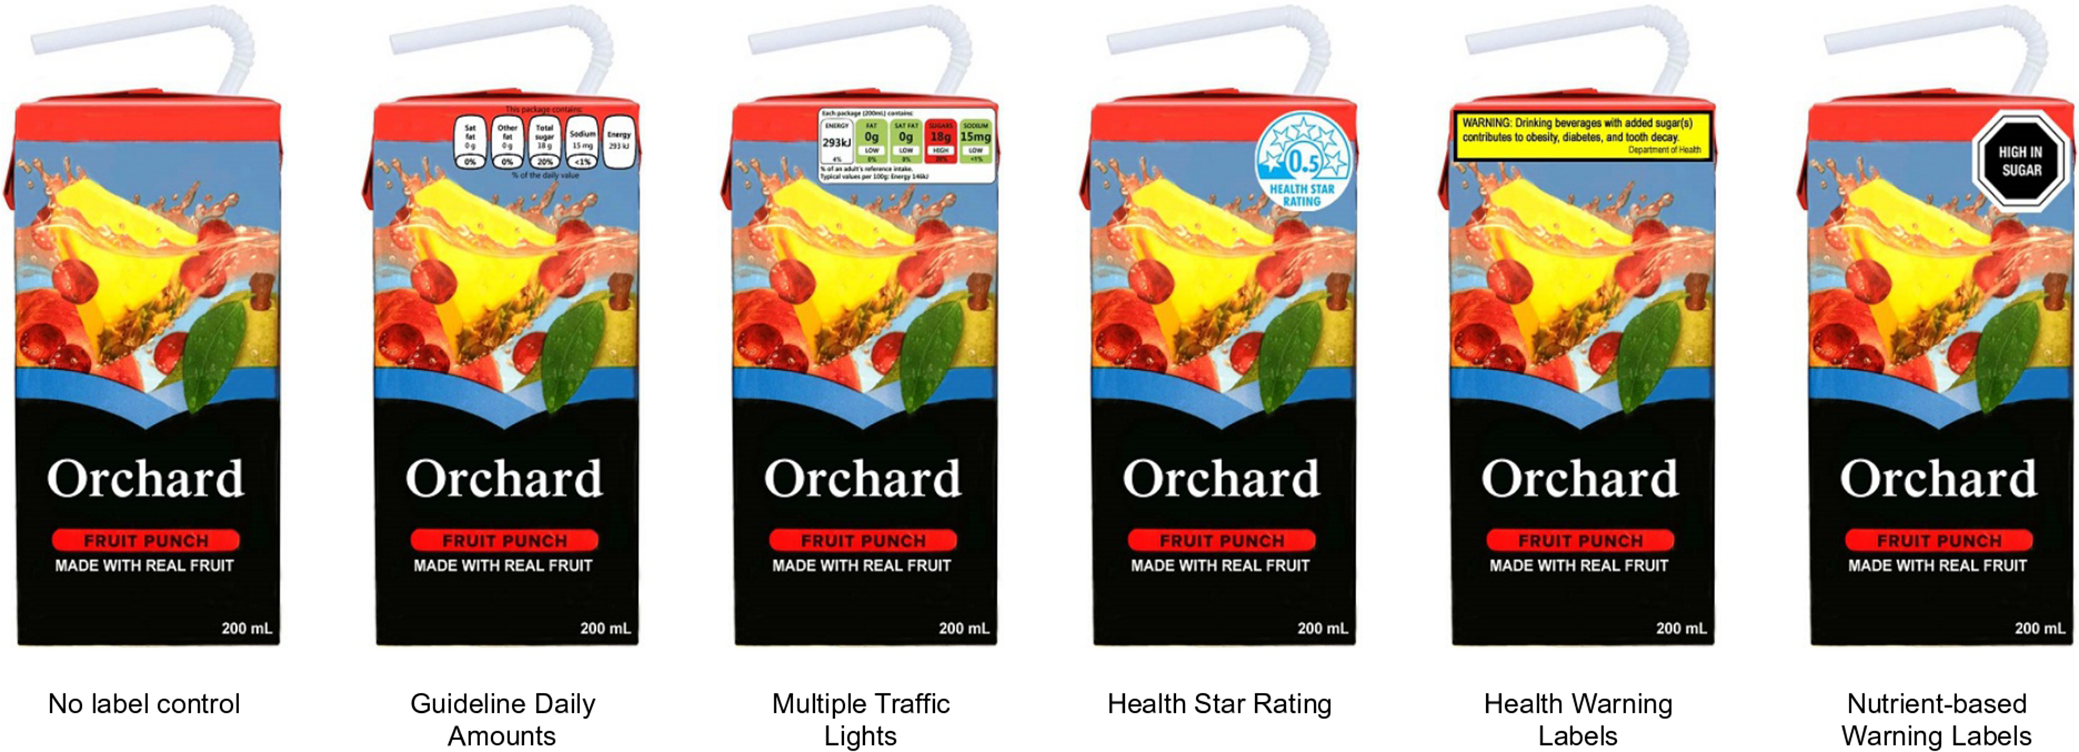
Fig. 2 Images with front-of-package labels displayed on screen during experimental task. Note: each participant was only shown one image, corresponding to their assigned condition. Images above were shown in Australia surveys; product and labels varied slightly by country (see online supplementary material, Supplemental Fig. 1)
Nutritional criteria for labelling systems
Online supplementary material, Supplemental Table 1 shows the nutrition information used in the development of the FOP labels for the sweetened fruit drink. The nutrient content in the MTL condition was classified according to criteria set out by EU Regulation No. 1169/2011 (e.g. sugar content >13·5 g/portion coded red with ‘high’ text)(37). The online HSR Calculator was utilised to calculate an HSR of 0·5 stars(38). The ‘High in Sugar‘ warning label was applied based on a cut-off of 18 g of sugar per serving size(Reference Corvalán, Reyes and Garmendia39) or 5 g/100 ml, as per criteria used in Chile(Reference Ministerio and Gobierno40).
Outcome
Participants were asked ‘In your opinion, is this product…’ with nine response options: (1) very unhealthy, (2) unhealthy, (3) a little unhealthy, (4) neither unhealthy nor healthy,(5) a little healthy, (6) healthy, (7) very healthy, (8) don’t know and (9) refuse to answer. Those answering options (8) or (9) (n 634, 2·9 %) were considered as missing and excluded from analyses.
Covariates
Demographic information was assessed using survey measures(Reference Hammond, White and Mahamad41) from population-level surveys within each country(42–Reference Institito Nacional46). Variables were recoded and harmonised for comparison across countries and included gender, age group, education, ethnicity, income adequacy(Reference Litwin and Sapir47), self-reported nutrition knowledge, household responsibility for food shopping, frequency of using a nutrition facts table and self-reported BMI (see Table 1). Further details on the IFPS are available elsewhere(Reference Hammond, White and Rynard48).
Table 1 Demographic characteristics in the total sample and by experimental condition (weighted)
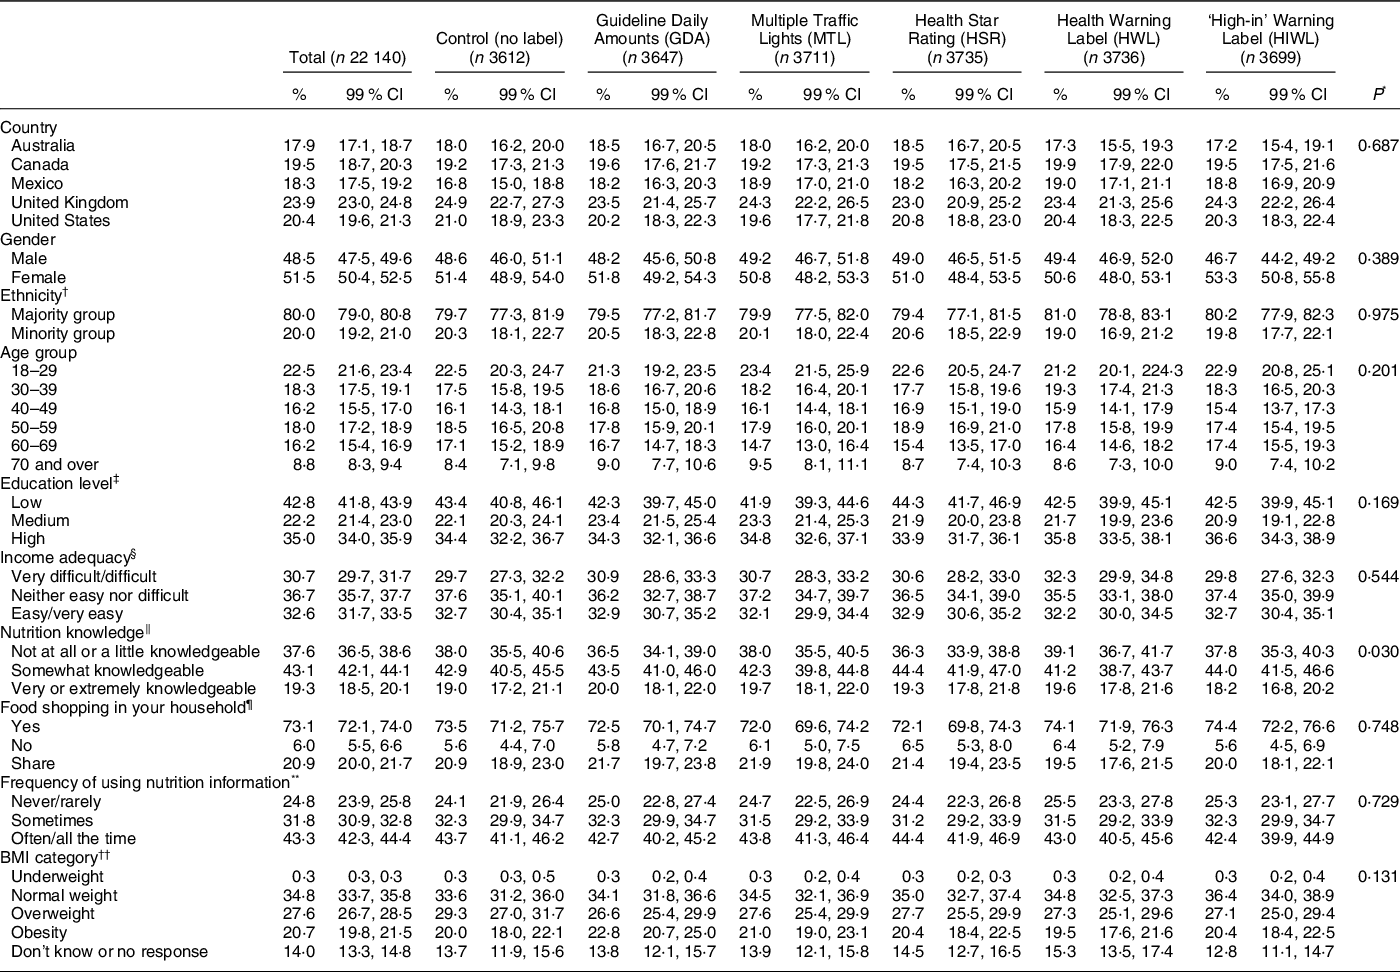
* Pearson χ 2 tests were calculated to determine differences by socio-demographic characteristics and ethnicity.
† Ethnic categories in each country as per census questions asked in each country: (1) Australia majority = only speaks English at home, minority = speaks a language besides English at home; (2) Canada majority = White, minority = other ethnicity; (3) Mexico majority = non-indigenous, minority = indigenous; (4) United Kingdom majority = White, minority = other ethnicity; and (5) US majority = White, minority = other ethnicity.
‡ Education level was categorised as ‘low’ (i.e. completed secondary school or less), ‘medium’ (i.e. some post-secondary qualifications) or ‘high’ (i.e. university degree or higher) according to country-specific criteria related to the highest level of formal education attained.
§ Perceived income adequacy was measured with the following question: ‘Thinking about your total monthly income, how difficult or easy is it for you to make ends meet?’ (very difficult; difficult; neither easy nor difficult; easy; very easy).
‖ Nutrition knowledge was measured with the following question: ‘How would you rate your nutrition knowledge?’ (not at all knowledgeable; a little knowledgeable; somewhat knowledgeable; very knowledgeable; extremely knowledgeable).
¶ Household shopping role was measured with the following question: ‘Do you do most of the food shopping in your household?’ (yes; no; share equally).
** Frequency of using nutrition information was measured with the following question: ‘How often do you use this type of food label when deciding to buy a food product?’ and were shown country-specific images of the Nutrition Facts information table or equivalent that is shown on the back of package in each country (never; rarely; sometimes; often; all the time).
†† BMI classification: underweight (<18·5 kg/m2) normal weight (18·5–24·9 kg/m2), overweight (25·0–29·9 kg/m2) and obesity (≥ 30 kg/m2).
Data were weighted using survey weights.
Statistical analysis
The IFPS study sample size was powered to examine differences in nutritional outcomes between countries over time and not for each task within the survey. Post-hoc analyses indicated that with a sample size of 650 participants in each labelling condition per country and a standard deviation of 1·5, this study had an estimated 85 % power to detect a 0·25 mean difference on the 7-point Likert scale. We tested the success of randomisation of covariates by comparing variables between experimental groups using χ 2 tests.
Preliminary analyses indicated differences in label effects across countries (overall interaction effect: X 2 = 41·66, P = 0·003); thus, separate country models were estimated. Linear regression modelling was used to evaluate the effect of the labels on perceived healthfulness. Comparisons among label groups were made using Wald tests after running linear regression models.
We tested for possible interactions between label condition and demographic characteristics (i.e. gender, age group, income adequacy, education, nutrition knowledge, food shopping in the household, frequency of using the nutrition facts table or BMI category). For this purpose, multiplicative interactions between each demographic variable and label condition were introduced in individual country models, but only significant interactions (P < 0·01) were retained. In cases where demographic × label interactions were significant, associations within the demographic variables were presented, stratified by country.
Additional sensitivity analyses were performed to check the robustness of the results. Participants considering the food product as very healthy (7), healthy (6) or a little healthy (5) were classified as perceiving the product as ‘healthy’; those choosing options (4), (3), (2) or (1) were classified as perceiving the product as ‘not healthy’. We regressed this binary outcome on the experimental group.
To account for the use of several models and multiple comparisons within each, significance was set at P < 0·01 for regression models and test comparisons. All analyses were weighted with post-stratification sample weights constructed using a raking algorithm with population estimates from the census in each country based on age group, sex, region, ethnicity (except in Canada) and education (except in Mexico). Data analysis was performed using STATA 14.
Results
A total of 22 140 participants were analysed (control = 3612, GDA = 3647, MTL = 3711, HSR = 3735, HIWL = 3699, HWL = 3736). No differences were observed between experimental conditions in characteristics (Table 1). Participants were evenly distributed between conditions by country, gender, age group and education level. Most (70–80 %) belonged to a majority ethnic group and were responsible for food shopping in their household, with slightly more females than males.
Stratified models showed that HIWL were the most effective label in reducing the perceived healthfulness of the fruit drink compared with the control group in all countries (range of β: −1·20 in the UK to −0·62 in Canada), as well as compared with the rest of the labels in Canada, Mexico, the UK and the US (Table 2).
Table 2 Means and regression coefficients of perceived healthfulness by label condition across countries * , †
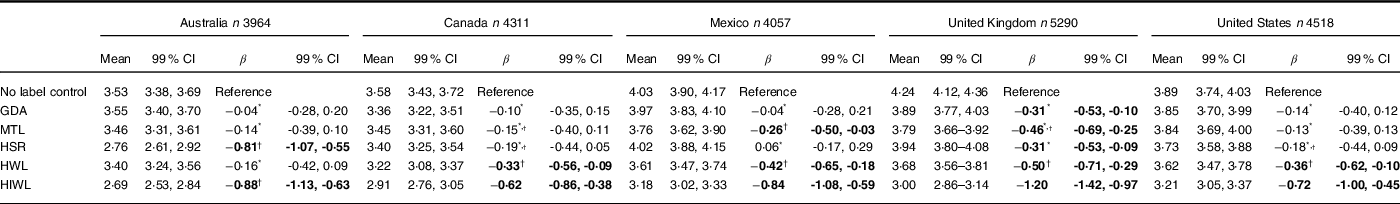
GDA, Guideline Daily Amounts; HSR, Health Star Rating; HWL, Health Warning Labels; MTL, Multiple Traffic Lights; HIWL, ‘High-in’ Warning Labels.
* Bold face indicates statistically significant (P < 0 01) effects compared with the control condition within each country.
† Similar superscripts within columns indicate that contrasts are not significantly different within countries (columns) (P < 0 01).
In Canada, Mexico and the US, HWL also led to lower perceived product healthfulness compared with the control group, but to a lesser magnitude than HIWL (range of β: −0·50 to −0·33). In Mexico, MTL also led to a decreased perceived healthfulness of the fruit drink compared with the control condition, with similar effects as the HWL (β = −0·26, 95 % CI −0·50, −0·03).
In Australia, those in the HIWL and the HSR conditions had similar decreased perceptions of product healthfulness compared with the control group (range of β: −0·81 to −0·88), as well as compared with the GDA, the MTL and the HWL (Table 2).
In the UK, all label conditions led to a decreased perceived healthfulness of the fruit drink compared with the control condition (Table 2). GDA, MTL and the HSR decreased the perceived product healthfulness to a similar extent in comparison with the control condition (range of β: −0·31 to −0·46). HWL (β = −0·50, 95 % CI −0·71, −0·29) had a larger effect in decreasing perceived product healthfulness than GDA and the HSR.
In the UK, a statistically significant interaction between label condition and age group was observed (interaction effects P < 0·001) (Fig. 3). This interaction indicated that the magnitude of the impact of HIWL compared with the control condition was greater among older age groups (i.e. 40–49 years: β = −1·15, 95 % CI −1·64, −0·66; 50–59 years: β = −1·64, 95 % CI −2·04, −1·23; and 60 years and over: β = −1·71, 95 % CI −2·03, −1·39) than it was among those aged 18–29 years (β = −0·63, 95 % CI −1·02, −0·24) or 30–39 years (β = −0·45, 95 % CI −0·92, 0·02).

Fig. 3 Predicted perceived healthfulness by label condition across age groups in the UK. Predictions and 95 % CI were estimated after running a linear regression model adjusted for the interaction term ‘label condition × age group’ and post-stratification sample weights. ![]() , Control;
, Control; ![]() , Guideline Daily Amounts (GDA);
, Guideline Daily Amounts (GDA); ![]() , Multiple Traffic Lights (MTL);
, Multiple Traffic Lights (MTL); ![]() , Health Star Rating (HSR);
, Health Star Rating (HSR); ![]() , Health Warning Labels (HWL);
, Health Warning Labels (HWL); ![]() , ‘High-in’ Warning Labels (HIWL)
, ‘High-in’ Warning Labels (HIWL)
No other differences in label effects across key demographic characteristics (i.e. gender, income adequacy, education, nutrition knowledge, food shopping in the household, frequency of using the nutrition facts table or BMI category) were observed within countries.
Sensitivity analyses suggested that there were few differences in key outcomes when comparing linear and logistic regression outcomes (online supplementary material, Supplemental Table 4).
Discussion
This study showed that the effect of FOP labels differed across countries. HIWL were the only FOP labels which consistently led participants to perceive the sweetened fruit drink as less healthy compared with the same drink without a label across all countries. In Australia only, there was a similar effect of HSR and HIWL. Other labels were effective in decreasing the perceived healthfulness of the drink within some countries only, but to a lower extent. The GDA did not exert this effect in most of the countries included in the study except the UK. In the UK, the effect of HIWL differed by age group, with greater impact among participants aged 40 and over. There were no other variations across key demographic characteristics in most countries, suggesting that different population sub-groups had similar responses to the various labelling systems.
These findings are consistent with a meta-analysis examining warning labels on sugary drinks, which showed that sugary drink warnings (HIWL or HWL) led to lower perceived product healthfulness compared with controls(Reference Grummon and Hall25). Similarly, recent studies comparing the effect of interpretive (e.g. HIWL, HSR and MTL) and reductive (i.e. GDA) FOP labelling schemes showed that interpretive labels had the greatest influence on product healthfulness perceptions(Reference Arrúa, MacHín and Curutchet49), with HIWL being the most effective among interpretive labels(Reference Lima, Ares and Deliza50–Reference Acton, Vanderlee and Hammond52). However, our findings are somewhat contrasting to reports by Ikonen et al. (Reference Ikonen, Sotgiu and Aydinli5), a meta-analysis where increases in the perceived healthfulness of unhealthy products were observed for MTL and GDA, whereas no effect was reported for the HSR or HIWL. Differences may be explained by the types and relative healthfulness of products tested, and the amount of ambiguity related to their perceived healthfulness among consumers. Ikonen et al. included a variety of studies exploring the effects among different products, which were then re-classified as unhealthy or healthy products. However, studies suggest that larger impacts in perceived healthfulness are observed among products with intermediate healthfulness scores (e.g. breakfast cereals, yogurt, orange juice, bread), but less impact in products that people already believe are healthy (i.e. lentils and green beans) or unhealthy (i.e. potato chips)(Reference Arrúa, MacHín and Curutchet49–Reference Acton, Vanderlee and Hammond52). In our study, we used a sweetened fruit drink, which is often assumed to be a healthy option despite its high sugar content(Reference Moran and Roberto34,Reference Auerbach, Dibey and Vallila-Buchman35) . Given that only one type of food product was used in the experiment, one cannot assume the reported effect of labels will hold true for other food products, as has been demonstrated in other research(Reference Ikonen, Sotgiu and Aydinli5). Nonetheless, results build on evidence indicating that interpretive labelling schemes may be useful for decreasing perceived healthfulness of products with high content of nutrients associated with non-communicable diseases.
HIWL have become increasingly popular as a FOP label option to help consumers make healthier choices(53). In contrast to most other labelling systems tested in this study, HIWL only highlight products with high amounts of critical nutrients (i.e. energy, fat, sugar and salt). Studies have shown that HIWL make excessive nutrient content and its negative health consequences more salient in consumers’ minds(Reference Ares, Antúnez and Otterbring54). Further, evidence indicates that the black colour and the octagon shape may have stronger implicit associations with unhealthfulness(Reference Cabrera, Machín and Arrúa55). These characteristics may explain why HIWL may be more effective messaging to communicate the idea that a product is not healthful(Reference Ikonen, Sotgiu and Aydinli5,Reference Grummon and Hall25,Reference Taillie, Hall and Popkin26,Reference Lima, Ares and Deliza50,Reference Roberto, Wong and Musicus56,Reference Vanderlee, Franco-Arellano and Ahmed57) . We also observed that HIWL were more effective than HWL in communicating that the sweetened fruit drink was not healthy. Only a small number of studies have compared HIWL to HWL(Reference Ang, Agrawal and Finkelstein58–Reference Bollard, Maubach and Walker62), and more research is needed to continue answering important policy questions about how warnings can be most effectively used on food products. Future studies may also examine health warnings related to other unhealthy nutrients (e.g. Na) and for other less healthy product categories besides sugary drinks (e.g. processed meat).
In the current study, GDA had no effect on the perceived healthfulness of the product in most countries, except the UK. This finding is in line with evidence suggesting that reductive systems such as GDA, which rely on quantitative nutrient amounts, are not effective in communicating the presence of excessive amounts of critical nutrients in unhealthy foods(Reference Arrúa, MacHín and Curutchet49). As mentioned in previous reports(Reference Wartella, Lichtenstein and Yaktine3), these results suggest that interpretative FOP labelling systems, which incorporate elements of colour and symbolism and simplify information presented, hold more promise for conveying accurate information about product healthfulness to consumers.
Reports have also suggested that the effect of FOP labels may differ across countries. To date, most between-country studies exploring label perceptions (e.g. liking, understanding and use) or objective understanding of different FOP labels have been inconsistent, with some reporting differences across countries(Reference Möser, Hoefkens and van Camp27–Reference Grunert, Fernández-Celemín and Wills29), whereas others have not(Reference Talati, Egnell and Hercberg30,Reference Feunekes, Gortemaker and Willems31) . This study adds to the literature by investigating the effect of labels on perceived healthfulness of a fruit drink, finding several notable differences in the observed effect of labels across countries. It has been posited that familiarity with the labels (e.g. due to implementation of such labels and viewing labels on packages, or cultural exposure to public debates on issues of nutrition and labelling) may influence self-reported evaluations and usage intentions of labels(Reference Grunert, Fernández-Celemín and Wills29,Reference Van Herpen, Seiss and Van Trijp32) . In line with the former, the HSR was only effective in reducing perceptions of healthfulness in Australia where this policy is currently implemented on a voluntary basis; a similar effect was observed for MTL in the UK. In a broader sense, these results suggest that label effects may not be generalisable across countries and underscore the importance of producing local evidence to guide decision-making related to FOP nutrition labelling policies. Nonetheless, HIWL consistently led to lower perceived product healthfulness across all countries, suggesting that this format requires very little in the way of familiarity to be effective and may produce similar responses across high and upper-middle income countries.
The current study also examined whether the effect of labels differed across demographic characteristics. Overall, labels worked equally well across diverse populations. However, in the UK HIWL were more effective in decreasing perceived product healthfulness among older age groups than younger populations. Warning labels elicit a negative affect or perception of risk, which in turn may influence perceived product healthfulness(Reference Taillie, Hall and Popkin26). Previous studies have reported greater health risk perceptions among adults and older adults compared with younger counterparts(Reference Kim, Park and Kang63,Reference Cohn, Macfarlane and Yanez64) , which may be explained by a greater exposure to health problems. However, the fact that label effects did not differ across income levels or nutrition knowledge, as shown in previous studies(Reference Grummon, Taillie and Golden65,Reference Grummon, Smith and Golden66) , suggests that these labels are unlikely to contribute to increasing health disparities.
To our knowledge, this is the first international study comparing the effect of different FOP labels on the perceived healthfulness of a food product among countries with varying government led or mandated FOP labelling policies implemented. This study also included one Latin American country, a region which has been previously understudied. Strengths of this study include the use of a randomised design, limiting the influence of confounding from observed and unobserved factors, and a large sample size. Nonetheless, results should be interpreted within the context of several limitations. Respondents were recruited using non-probability-based sampling; therefore, the findings do not provide nationally representative estimates. However, although the descriptive statistics may not match completely with national estimates of education and BMI, the observed effects in this study provide useful information regarding the potential effects of labels across a wider population. This study focused on examining the effect of labels in perceived healthfulness using a single item measure. To expand evidence on the effectiveness of labels to communicate the relative healthfulness of products, future studies should explore the effect of labels using multiple measures and across a range of healthy products, including direct comparisons between their healthfulness and likelihood of purchase. Further, the experiment was not performed in a store; therefore, the results might have been different among some participants in a real-life situation or shopping environment. However, online food shopping is becoming increasingly common in many countries and consumers are more accustomed to rating the healthfulness of a food product when shopping online. Results of this international labelling experiment provide relevant insights for policy- and decision-makers regarding FOP labelling systems.
Conclusions
Results indicate that warning labels are the most promising FOP labelling option to change consumer healthfulness perceptions. Specifically, HIWL may be particularly effective in helping consumers correctly identify unhealthy products with high contents of critical nutrients. Given that HIWL have been effectively implemented in several countries to date, and are compatible with international trade agreements, the current study adds to the evidence demonstrating that implementing HIWL on the front of packages is a strong policy option. The study supports the use of MTL in the UK, where this label has been implemented for more than 10 years, but has shown HIWL performed best in this country, especially among older age groups. Findings also support the consideration of the HSR for Australia, since this label performed better than the control and had a comparable effect to HIWL in this country, where this label has been implemented for more than 5 years. However, MTL were not effective outside the UK, and HSR was not effective outside Australia. Likewise, the study found little support for GDA as an option for a FOP labelling policy. Differences in label effects across countries highlight the importance of local evidence for guiding policy-making. Finally, different population sub-groups had similar responses to the various labelling systems tested in most countries, indicating FOP labels are unlikely to exacerbate disparities.
Acknowledgements
Acknowledgements: None. Financial support: The content is solely the responsibility of the authors and does not necessarily represent the official views of the funders. Funding for this project was provided by a Canadian Institutes of Health Research (CIHR) Project Grant, with additional support from the Public Health Agency of Canada (PHAC) and a CIHR-PHAC Applied Public Health Chair (DH). K01HL147713 from the National Heart, Lung, and Blood Institute of the National Institutes of Health supported Marissa Hall’s time writing the paper. The study sponsor had no role in study design; collection, analysis and interpretation of data; writing the report; and the decision to submit the report for publication. Conflict of interest: There are no conflicts of interest. Authorship: A.J. performed the statistical analysis, interpreted the data and drafted the manuscript. C.M.W., L.V. and M.G.H. helped draft the manuscript, made substantial contributions in selecting the appropriate statistical analyses, interpreting the data and revising the manuscript critically for intellectual content. A.C.M., C.N., G.S., J.T. and S.B. made substantial contributions in interpreting the data, and revising the manuscript critically for intellectual content. J.T. provided statistical expertise and advice. A.J., C.M.W., L.V., G.S., J.T. and S.B. contributed to the preparation of the survey. D.H. conceived, designed and executed the International Food Policy Study. All authors revised the manuscript critically for intellectual content. All authors read and approved the final manuscript. Ethics of human subject participation: This study was conducted according to the guidelines laid down in the Declaration of Helsinki. The study was reviewed by and received ethics clearance through a University of Waterloo Research Ethics Committee (ORE# 30829). A full description of the study methods can be found in the International Food Policy Study: Technical Report – Wave 2 (2018) at www.foodpolicystudy.com/methods. Written informed consent was obtained from all participants.
Supplementary material
For supplementary material accompanying this paper visit https://doi.org/10.1017/S1368980021004535


 Open access