


The results of dietary studies are influenced not only by the dietary collection method but also by the method of coding dietary data and of creating food groupings. There is no gold standard for the analysis of food intake data based on coded dietary recalls or records, especially items that are comprised of multiple food components. In the current paper these items are referred to as ‘combinations’. A fast-food sandwich might be coded as a single item, while a self-prepared sandwich could be coded by each ingredient and a second code may be given indicating the item is comprised of several foods. Oftentimes in dietary pattern analyses, food mixtures are disaggregated into specific ingredients and each ingredient is then assigned to a disparate food group( Reference Park, Murphy and Wilkens 1 ). Depending on the use of coding variables in analysis, foods usually consumed by a population may be obscured or artificially separated, which can result in erroneous and misleading results( Reference Tucker 2 ). For instance, if the investigator wanted to determine the quantity of milk consumed as a beverage and based the analysis using only the unique code for milk, then milk added to cereals would be included in this calculation( Reference Fulgoni and Quann 3 ). To be accurate the investigator would need to use the codes for milk while excluding codes indicating when milk was part of a combination. Similar to the selection of a dietary method, the coding variables used in dietary data analysis must match the purpose of the study.
The Dietary Intake Data System developed by the US Department of Agriculture (USDA) is used to collect dietary data for many projects, including What We Eat in America (WWEIA), the National Health and Nutrition Examination Survey (NHANES) and the Healthy Aging in Neighborhoods of Diversity across the Life Span (HANDLS) study. The main components of this system include three separate computer programs in succession: (i) the Automated Multiple-Pass Method (AMPM) for collecting 24 h recalls using standardized questions for all types of foods; (ii) the Post-Interview Processing System (PIPS) for extracting the data from the AMPM, arranging the data into formats suitable for loading into Survey Net and automating some of the food coding; and (iii) Survey Net for final coding, editing and nutritional analysis( Reference Raper, Perloff and Ingwersen 4 ). The components of the USDA Food and Nutrient Database for Dietary Studies (FNDDS) are essential for collecting, processing and analysing food intake data using the USDA Dietary Intake Data System.
All foods collected in the AMPM are matched to food descriptions and their codes during processing in either PIPS or Survey Net. A coding pathway leads to a specific food code through the responses that have been provided for the questions asked about a food in the AMPM. AMPM also assigns combination codes. When intakes are coded using FNDDS in the Survey Net coding software, combination codes assigned initially by AMPM can be changed, removed or new ones added. A combination code identifies foods that were consumed simultaneously as one item. Individual foods in the combination are coded with their own separate food codes and amounts (Table 1). Combinations include one food added to another, such as sugar to coffee, and foods with separate ingredients, such as salads and sandwiches. This information allows researchers the ability to create a composite food and assign this item (such as the self-prepared sandwich) one code.
Table 1 Food and combination codes for selected foods

* Food type indicates the food with additions or components of salads and sandwiches; food number indicates the items eaten simultaneously at a given time.
† 1=beverages with additions.
‡ 3=bread/baked products with additions.
§ 12=meat, poultry, fish with additions.
The public-use dietary data sets for WWEIA, NHANES and the HANDLS study contain coded foods. Variables in the dietary data sets for both of these projects include food codes, nutrients and combination food numbers and types( 5 , 6 ). These data are used to explore the relationships between diet and health( Reference Kerver, Yang and Bianchi 7 – Reference Fanelli Kuczmarski, Mason and Beydoun 10 ). However, an inconsistency within coding exists. For example, a named brand of fast-food sandwich is given a single code while a sandwich made at home is coded by ingredient and then assigned a combination code. To implement a consistent approach to coding, researchers should either aggregate foods using the combination codes or disaggregate the composite foods prior to dietary analysis. When trying to create a picture of how foods are actually consumed, the implementation of the combination codes is essential. Yet our review of the literature revealed either a lack of detailed description as to the use of food combination codes( Reference Han and Powell 11 ) or exclusion of food combinations in analysis( Reference Fulgoni and Quann 3 , Reference Kit, Fakhouri and Park 12 ).
There is limited knowledge of foods as typically consumed at mealtimes by urban African-American and White populations( Reference Paeratakul, Ferdinand and Champagne 13 – Reference Kumanyika and Krebs-Smith 16 ). Perhaps the disparities in health of the poor that exist in the USA may be associated with not only the food choices, but also how these foods are prepared. The use of combination codes might reveal more insight into how these populations eat. With a better understanding of eating practices by these populations, nutrition educators, health professionals and public health policy makers may be able to translate nutrition goals into practical, culturally relevant and sex-specific diet recommendations( Reference Taylor, Gilmore and Keim 17 , Reference Sirot, Volatier and Calamassi-Tran 18 ).
The main objective of the present study was to compare two coding methods to determine which method provided the best depiction of how foods were typically consumed at three mealtimes by the participants in the HANDLS study. Another aim was to determine any changes in the lists of foods consumed by race as reported on 24 h recalls for this low-income urban population resulting from the coding method.
Methods
Background on the Healthy Aging in Neighborhoods of Diversity across the Life Span study
The HANDLS study, a community-based, prospective epidemiological study, was designed to examine whether race and socio-economic status influence age-related health disparities independently or synergistically. Participants were drawn from thirteen predetermined neighbourhoods in Baltimore City, yielding representative distributions of individuals between 30 and 64 years old who were African Americans and Whites, men and women, and of lower (<125 % of the US federal poverty guidelines (poverty income ratio)) and higher (>125 % of the poverty income ratio) socio-economic status. The heuristic study design is a factorial cross of four factors: age, sex, race and socio-economic status, with approximately equal numbers of individuals per ‘cell’. There were two phases in the baseline HANDLS study. The first phase was done in the participant’s home. This phase consisted of an in-home interview that included questionnaires about the participant’s health status, health service utilization, psychosocial factors, dietary recall, neighbourhood characteristics and demographics. The second phase was completed 4 to 10d later, on mobile research vehicles located in the preselected census tracts where participants resided. This part included a medical history and physical examination, dietary recall, cognitive evaluation, psychophysiology assessments including heart rate variability, arterial thickness, carotid ultrasound, assessments of muscle strength and bone density, and laboratory measurements. The study was conducted according to the guidelines laid down in the Declaration of Helsinki and all procedures were approved by the Institutional Review Boards at MedStar Health Research Institute and the University of Delaware. Written informed consent was obtained from all HANDLS participants who were compensated monetarily. Further detailed information on the study design, eligibility and recruitment of participants and the data collected can be found elsewhere( Reference Evans, Lepkowski and Powell 19 , Reference Evans and Zonderman 20 ).
Study sample
Baseline data collection on socio-economically diverse African Americans and Whites began in August 2004 and ended in March 2009, with a total of 3720 participants. The sample consisted of 2177 individuals (59 % of respondents) who completed two days of 24 h dietary recalls (Fig. 1). Participants who completed only one recall day (n 1543) were not included because two days of recall provides a better representation of usual intakes. There were no statistical differences in demographic data or energy and nutrient profiles of the participants who completed one or both days of dietary recall. Thus the study sample is considered representative of the entire HANDLS baseline sample.
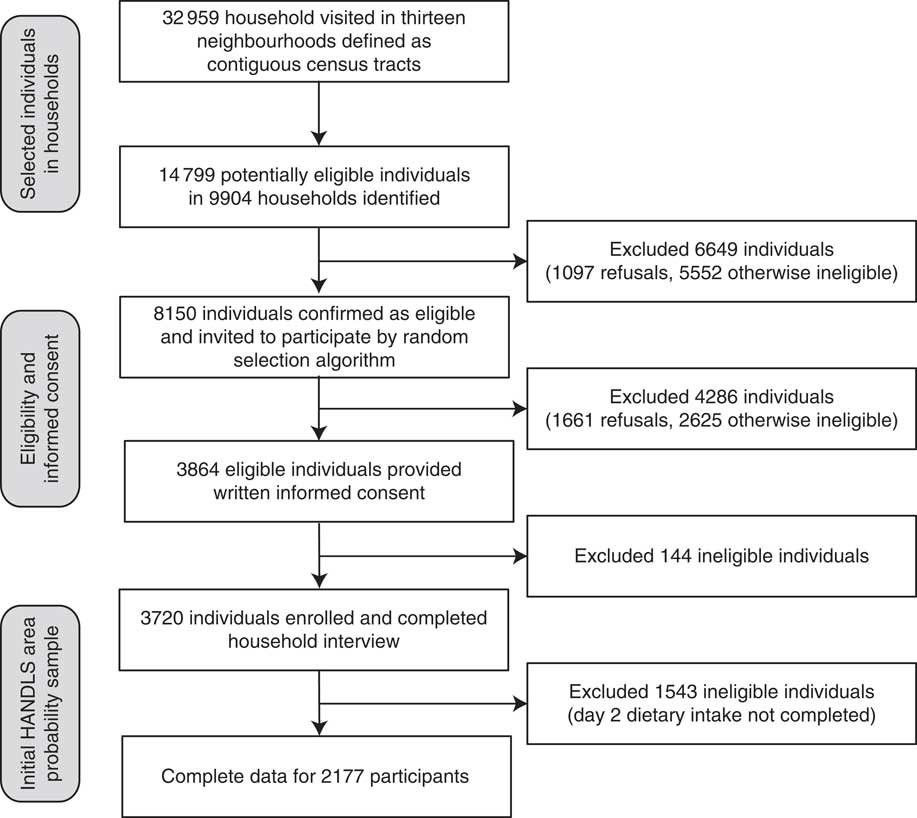
Fig. 1 Flowchart showing household screening, participant eligibility and response rates for the Healthy Aging in Neighborhoods of Diversity across the Life Span (HANDLS) study
Characteristics of the HANDLS study participants are provided in Table 2. The mean age of the sample was 47·8 (se 0·2) years and approximately half (57 %) was female. The racial composition was 58 % African American and 42 % White. Self-reported socio-economic status revealed 43 % with a household income <125 % and 57 % with a household income ≥125 % of the 2003 US Department of Health and Human Services poverty guidelines( 21 ). About one-third of the sample had less than a high-school education. Among African Americans, 48 % had less than an 8th grade literacy rate compared with 26 % among Whites. Approximately one in four participants rated their health as fair/poor. Over 40 % were current smokers. While the mean usual energy intake of the women was roughly 7531 kJ (1800 kcal) and 10251 kJ (2450 kcal) for men, the mean BMI indicates that the population was obese. Hypertension was most prevalent among African-American females (53 %) and lowest among White females (36 %). The prevalence of hypertension among African-American and White men was about 44 %.
Table 2 Characteristics of the participants by race and gender (n 2177), Healthy Aging in Neighborhoods of Diversity across the Life Span (HANDLS) study

HS, high school; GED, General Educational Development; WRAT, Wide Range Achievement Test; DHHS, US Department of Health and Human Services; PIR, poverty income ratio.
* Values are presented as means with their standard errors.
Dietary collection method
The USDA AMPM dietary recall survey software was used to collect both dietary recalls( Reference Moshfegh, Rhodes and Baer 22 ). The survey was supplemented by measurement aids such as measuring cups, spoons, a ruler and an illustrated Food Model Booklet to assist participants in estimating accurate quantities of foods and beverages consumed. Trained interviewers administered both 24 h dietary recalls. The USDA five-step multiple-pass method has been validated as an accurate methodology for assessing intakes of macronutrients and energy in obese and non-obese men and women( Reference Moshfegh, Rhodes and Baer 22 , Reference Conway, Ingwerson and Moshfegh 23 ). Eating occasions were self-reported and included breakfast, brunch, lunch, dinner, supper, snack, beverage and extended consumption. For the present study the eating occasions are referred to as ‘mealtimes’. The source of where the food was obtained was also collected. Foods reported as consumed for the following three eating occasions: as a snack, beverage or extended consumption, were excluded from the present analysis.
The dietary recalls were coded using the FNDDS version 3·0 in the Survey Net coding software( 24 ). The nine major food groups in the FNDDS were expanded to fifty-eight groups for the present study to separate groups by their fat, sugar and Na contents, as well as by the degree of processing such as refined v. whole grains. Combination codes assigned initially by AMPM were reviewed in Survey Net, providing the coder the ability to change, remove or add new codes to ensure that foods eaten together were correctly linked( Reference Raper, Perloff and Ingwersen 4 , 25 ). Combinations were defined using two separate variables: (i) a combination food number, which distinguishes foods as eaten in combination; and (ii) combination food type. There were fourteen combination types defined by the USDA Food Coding Scheme (beverage, cereal, bread/baked product, salad, sandwich, soup, frozen meal, ice cream, dried beans/vegetable, fruit, tortilla, meat/poultry/fish, lunchables and chips), excluding a category of ‘99 – other food mixtures’. For the present study, the researchers created five additional combination types based on foods found in the ‘99’ category (pasta dishes, rice dishes, Asian dishes, pizza and dairy). A total of nineteen unique combination types were used for analysis. Examples of combinations include beverages with additions such as added sugar and dairy products, sandwiches, salads and bread/baked goods with additions such as jelly to bread.
Statistical analyses
Duplicate analysis methods were performed on two separate data sets. Data Set–Original consisted of all foods where each food item retained its original respective USDA food code. This data set includes foods that are reported consumed as individual items and selected composite (i.e. already coded as combinations) foods. Examples of composite foods include spaghetti with meat sauce and brand name fast-food items (McDonald’s cheeseburger).
The final data set (Data Set–Revised) was derived exclusively from the Data Set–Original. First, foods eaten in combination (i.e. containing combination codes) were isolated from those without combination codes. The data set of foods with combination codes was then modified to reflect their concurrent consumption as a single food item. Specifically, foods consumed simultaneously (as a distinct food item) were aggregated into one food record and given a new individual food code. The final step appended the newly aggregated foods with the remaining non-combination foods into the final revised data set (Fig. 2).
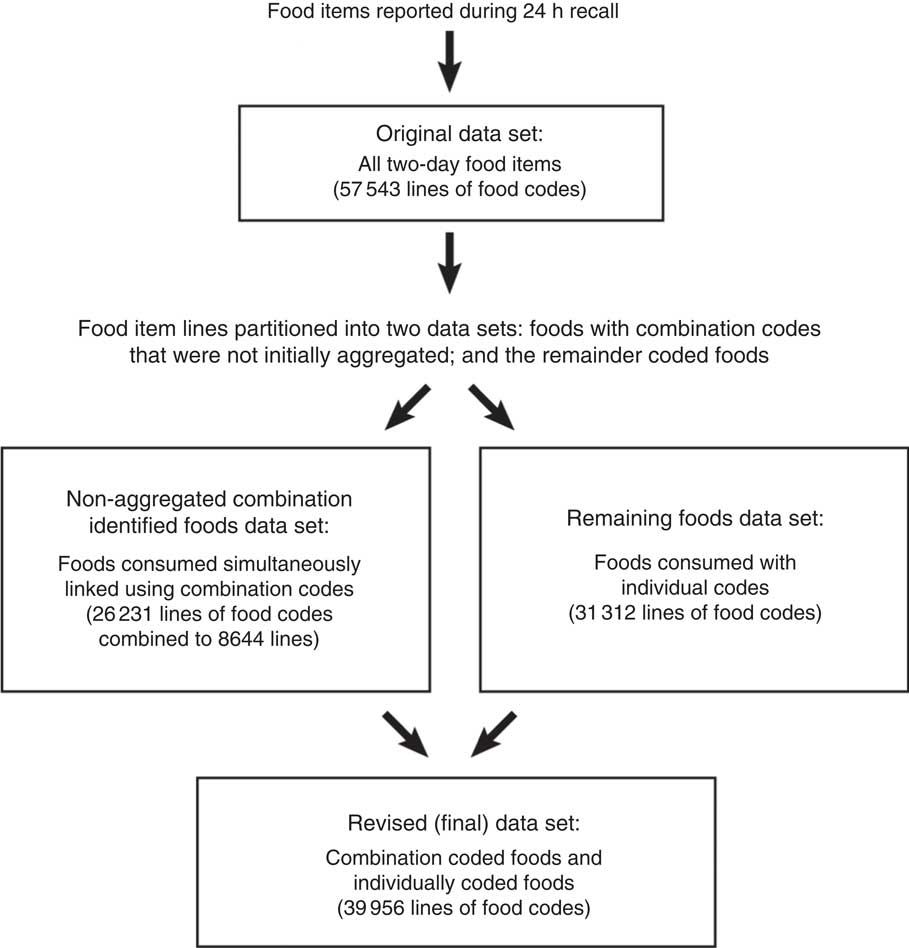
Fig. 2 Construction of food data sets for the present study
The frequency of reported intake over both days of dietary recalls was calculated and categorized into one of fifty-eight USDA food groups. Since foods eaten simultaneously that were assigned combination codes represent multiple food groups, the main food component was used to define the appropriate food group (Data Set–Revised). For example, white bread toast with butter and jam was associated with refined breads. Next, the frequency of reported intake was calculated for all foods consumed in Data Set–Original along with foods consumed in Data Set–Revised. Initially, there were 57 543 lines of food codes. Of this count, 26 231 lines (46 % of the data set) represented foods assigned combination codes for linkage. When the combinations were aggregated, the number of lines was reduced to 8644, representing 21·6 % of the records in Data Set–Revised (Fig. 2).
For the present study, frequencies of consumption of food groups by the HANDLS population for three mealtimes, breakfast, lunch and dinner, were generated. Since the reported consumption of foods at brunch and supper was small, 1 % and 2 % of the total number of lines of food codes, respectively, items consumed for brunch were included in breakfast and foods reported eaten as supper were included with dinner. These three main meals accounted for 72·3 % of the non-combined original dietary data. The most frequently consumed foods from selected food groups were determined.
For lack of a clear cut-point in the descriptive frequency analyses, the top twelve food groups in each of the three mealtimes, namely breakfast, lunch and dinner, were selected as a representative majority of the foods eaten (Table 3). These top twelve food groups represented a minimum of 70 % of the top foods eaten per occasion (breakfast 81 %, lunch 74 %, dinner 72 %). Together, the food groups in Table 3 represented 86 % (40 336/46 765) of all foods reportedly eaten. It should be noted that the total percentage contributed by the top twelve food groups for each mealtime was always greater when using Data Set–Revised compared with Data Set–Original (Table 3).
Table 3 Typical meals of an urban population (n 2177) defined by frequency of reported use: a comparison of the original data set (coding dietary recalls without the use of combination codes) and the revised data set (coding dietary recalls using combination codes), Healthy Aging in Neighborhoods of Diversity across the Life Span (HANDLS) study

* Egg and egg dishes include cooked eggs, omelettes and egg sandwiches pre-prepared.
† Beverages with sugar include soft drinks, pre-sweetened tea, coffee and water beverages, fruit drinks and sports drinks.
‡ Other vegetables include vegetables that are not orange, dark green or starchy. Vegetable could be consumed raw or cooked with or without fat.
§ Meat dishes include frozen and prepared dishes, dumplings and egg rolls with red meats, chicken or fish, and Hispanic dishes with meat.
|| Starchy vegetables include potatoes, corn, peas, plantain and beans prepared with or without fat.
¶ Chicken and turkey include poultry items (parts or processed like nuggets) prepared with fat and eaten with skin.
** Red meats include meats with greater than 10 g total fat, 4·5 g saturated fat and 95 mg cholesterol per ~100 g (3·5 oz) serving and meats prepared with fat.
†† Egg and egg dishes include cooked eggs, omelettes, and egg sandwiches pre-prepared and prepared using individual ingredients.
‡‡ Beverages with sugar include soft drinks, pre-sweetened tea, coffee and water beverages, fruit drinks, sports drinks and beverages to which sugar was added by an individual.
§§ Sandwiches include all types with the exception of egg as the main ingredient. The major ingredient could be beef, pork, chicken, turkey, fish, bacon, sausage, luncheon meats, hot dogs or vegetables.
|||| Starchy vegetables include potatoes, corn, peas and beans prepared with or without fat, and these items with added condiments like ketchup (catsup) and fats.
¶¶ Chicken and turkey include poultry items (parts or processed like nuggets) prepared with fat and eaten with skin along with an added condiment, gravy or sauce.
To further assess the impact of coding method, the rank order of food groups by race was determined. For this analysis, data for the three mealtimes were merged together, resulting in a representation of intake on 24 h recall days (Table 4). Statistical analyses were performed with the SAS statistical software package version 9·2.
Table 4 Foods consumed frequently by urban African-American and White adults: a comparison of rank-ordered food groups by coding method within and between racesFootnote *, Healthy Aging in Neighborhoods of Diversity across the Life Span (HANDLS) study

* Based on the following three eating occasions: breakfast+brunch, lunch, dinner+supper. Eating occasions identified as snacks, beverages or extended consumption were excluded from the analysis.
† Beverages with sugar include soft drinks, pre-sweetened tea, coffee and water beverages, fruit drinks and sports drinks.
‡ Other vegetables include vegetables that are not orange or dark green or starchy. Vegetable could be consumed raw or cooked with or without fat.
§ Starchy vegetables include potatoes, corn, peas, plantain and beans prepared with or without fat.
|| Chicken and turkey include poultry items (parts or processed like nuggets) prepared with fat and eaten with skin.
¶ Egg and egg dishes include cooked eggs, omelettes and egg sandwiches pre-prepared.
** Beverages with sugar include soft drinks, pre-sweetened tea, coffee and water beverages, fruit drinks, sports drinks and beverages to which sugar was added by an individual.
†† Sandwiches include all types with the exception of egg as the main ingredient. The major ingredient could be beef, pork, chicken, turkey, fish, bacon, sausage, luncheon meats, hot dogs or vegetables.
‡‡ Starchy vegetables include potatoes, corn, peas and beans prepared with or without fat, and these items with added condiments like ketchup (catsup) and fats.
§§ Egg and egg dishes include cooked eggs, omelettes, and egg sandwiches pre-prepared and prepared using individual ingredients.
|||| Chicken and turkey include poultry items (parts or processed like nuggets) prepared with fat and eaten with skin along with an added condiment, gravy or sauce.
¶¶ Meat dishes include frozen and prepared dishes, dumplings and egg rolls with red meats, chicken or fish, and Hispanic dishes with meat.
Results
To our knowledge, the present publication is the first one that compares food intakes with and without using the combination codes that are in WWEIA, NHANES as well as the HANDLS study. As shown in Table 3, when foods eaten in combination were coded as an aggregate, not only did the percentage contribution of food groups change, but also new food groups appeared. Some food groups such as condiments and sugar disappeared from the list because they were eaten as an addition to foods, namely sandwiches and beverages, respectively.
For breakfast, when the ingredients for self-prepared egg sandwiches were combined and linked to the eggs and eggs dishes food group (Data Set–Revised), the rank order for these items changed from fourth to first place (Table 3). When coffee and tea with sugar were recoded to the beverages with sugar group (Data Set–Revised), the percentage of reported usage of beverages with sugar at breakfast increased from 3·57 % to 12·65 % (Table 3), making it the second highest used group. Of the beverages with sugar group, 48 % of the foods were sweetened coffee, 32 % fruit-flavoured drinks and soda and 20 % were sweetened tea. In addition to the disappearance of sugar from Data Set–Original, three other groups, namely regular dairy products, reduced-fat dairy products and regular milk, disappeared. This disappearance of regular milk and reduced-fat dairy products, which included reduced-fat milks, most likely reflects their use as a combination with ready-to-eat cereals (19 % of dairy products) and in coffee and tea (68 % of dairy products). The new groups that appeared when using Data Set–Revised were diet drinks, cakes, doughnuts and pastries, sandwiches and cooked cereals (Table 3).
For lunch, most of the changes in the rank order reflected the aggregation of food items for self-prepared sandwiches (Table 3). From Data Set–Original, other vegetables moved from first to sixth place; refined breads moved from second to twelfth place; and sausage, bacon and luncheon meats, animal fats and condiments disappeared. The reported usage of sandwiches at lunch was 15·91 %, making it the top food group in Data Set–Revised (Table 3). Of the sandwich category, sandwiches containing red meats (mainly beef) ranked first (54 %) followed by sandwiches containing chicken (20 %), fish (9 %) or hot dogs (9 %). Similar to breakfast, beverages with sugar ranked second when foods eaten in combination were aggregated. However, unlike breakfast, fruit-flavoured drinks such as Kool-Aid and sodas were the largest contributor to this group at 77 %, followed by sweetened tea (19 %) and then coffee (4 %). The rank order of both starchy vegetables and salty snacks moved upward in Data Set–Revised. Fruit (eighth place) and pasta dishes (tenth place) appeared only in Data Set–Revised (Table 3).
For dinner, the other vegetable category, which excludes dark green, orange and starchy vegetables, moved from first to third place when combination coding was used (Table 3). This change most likely reflected the incorporation of lettuce and tomatoes into sandwiches. There were four food groups, namely animal fats, condiments, sausage, bacon and luncheon meats and red meat, in Data Set–Original that disappeared with the use of combination coding. The rank order of refined breads dropped from fourth place to eighth place. Most likely these changes can be explained by the incorporation of these food items into the sandwich group. The types of sandwiches were similar to lunch – red meat-based (59 %), chicken-based (16 %), fish-based (9 %) and hot dogs (10 %). The new groups that appeared in Data Set–Revised were dark green vegetables, diet drinks, and rice and rice dishes.
Further evidence that coding method does impact the results of daily intake dietary analysis was demonstrated by a comparison of the rank-ordered food intake by race. As shown in Table 4, eight of the thirteen food groups in Data Set–Original appeared for both the African-American and White adults examined in the HANDLS study. However, the rank order of these food groups, with the exception of starchy vegetables and condiments, differed by race. When combination codes were used (Data Set–Revised), there was no racial difference for the top two food groups. The foods from the beverages with sugar and sandwich groups were the most frequently consumed by both the African-American and White HANDLS study participants (Table 4). There were racial differences in intakes of sausage, bacon and luncheon meat and chicken/turkey groups, which were among the most frequently reported as consumed by African Americans. In comparison, ready-to-eat cereals and cakes, doughnuts and pastries were among the most frequently reported foods consumed by Whites during the 24 h recall.
Discussion
Using the USDA AMPM, investigators have the ability to study foods consumed in combination and their nutrient profiles. However, the use of combination codes is rarely cited in publications. The findings of the present research demonstrate differences in rank-ordered food intakes for mealtime and in rank-ordered daily food intakes for race based upon food coding methods used with multiple-day dietary recall data. These changes in rank ordering of food/food groupings can result in a change in the characterization of the population’s dietary patterns when attempting to quantify patterns using current epidemiological methods, such as cluster, principal component or factor analyses or reduced rank regression( Reference Fanelli Kuczmarski, Mason and Beydoun 10 ).
Despite the amount of time required, as well as the intricate and subjective choices of applying the combination coding to almost half of the total foods reported, this approach better reflects how individual foods were actually consumed. This knowledge permits researchers to have a more comprehensive description of a meal and to allow better comparisons of foods consumed by eating occasion. For instance, the similarities between the lunch and dinner meal for this US population segment became clearly evident with combination coding. The typical lunch or dinner for the HANDLS study participant consisted of a sandwich, starchy vegetable and beverages with sugar. The majority of these items had combination codes. The use of combination codes when analysing daily intakes made similarities and differences by race easily identifiable.
Similar to a dietary collection method, the coding method should be based on the practice/research objectives. The choice of coding method is illustrated in the following examples. If the identification of foods as typically consumed is the objective, then using a coding approach that aggregates foods eaten in combination (or simultaneously) would be the recommended method. An interesting finding for this urban population is that sandwiches were consumed at each eating occasion, most frequently at lunch. However, this observation was seen only when the coding method involved aggregating the items eaten in combination. If the objective of the research is to examine the quantity (millilitres) of beverages consumed, coding of the individual items would be more appropriate. On the other hand, if researchers want to compare the energy contribution of beverages to total dietary energy among population groups, then the coding must include combined items. Otherwise, energy would be underestimated by the additions (e.g. sugar, milk, honey, etc.) to items such as coffee and tea.
Even though time is required for a professional to code and map each combination to the appropriate food group, and for a statistician to program the analyses, one strength of coding foods as typically consumed is that it provides a better representation of eating behaviour. In addition, it allows for the formulation of policies and interventions targeted to these food preferences. It is widely recognized that the US population needs to consume more vegetables and fruits. If the analysis reveals that the study population does not consume salad on a regular basis but sandwiches are frequently consumed, nutritionists can recommend ways to incorporate vegetables into sandwiches rather than trying to promote salads. Cluster, principal component and other dietary pattern analyses using the combination codes in a database can reveal more recognizable and interpretable patterns. These patterns may then be associated with impacting health and chronic disease( Reference Fanelli Kuczmarski, Mason and Beydoun 10 ). No matter what approach to coding a researcher selects it is important for investigators to describe the procedure used to code the data.
Knowing the source of food as it relates to food combinations helps to further our understanding of food availability, food choice and the types of foods people self-prepare. The majority of foods consumed as individual or combined items, except for sandwiches, were obtained from the store, with a range of 62–92 %. Fast-food restaurants were the primary source of ready-to-eat sandwiches (79 % of sandwiches reported). Thus the participants in the HANDLS study were doing some food preparation, which would support implementation of culinary-based interventions. Knowledge of how foods were prepared prior to consumption based on combination coding can aid in defining more healthful food choices that may improve diet quality.
Lastly, the present study provides information on a low-income urban population of African-American and White adults which are an understudied group. Consistent with the findings of James on a convenience sample of African-American adults( Reference James 26 ), food intakes of African-American HANDLS study participants were not consistent with current Dietary Guidelines for Americans( 27 ). Oftentimes dietary guidance is targeted to individual foods and/or nutrients rather than meal choices: for instance, replace protein foods that are higher in solid fats with choices that are lower in solid fats and calories and/or are sources of oils( 27 ). Perhaps the majority of people do not perceive food as presented in this type of guidance but think of food as consumed – a double burger with cheese rather than a grilled chicken sandwich with lettuce and tomato. Using combination codes may provide educators better insight to dietary practices which can be valuable when developing targeted nutrition-related messages.
The present results describe a population that resided in Baltimore, MD. However, independent demographic analyses produced findings supporting that this population was representative of urban populations from US cities with similar population densities and racial distribution. These cities include Atlanta, GA; Bridgeport, CT; Bridgeton, NJ, Buffalo, NY; Camden, NJ; Carson, CA; Chicago, IL; Cleveland, OH; Detroit, MI; Harrisburg, PA; Hartford, CT; Oakland, CA; Springfield, MS; and Trenton, NJ (J Lepkowski, unpublished results).
Sometimes the use of the combination codes approach may not be the preferred coding method. If the objective of the research is to compare intakes with food group recommendations, a coding method that aggregates combinations would result in an underestimation of selected food groups. For example, if a researcher was interested in servings of dairy, dairy food group servings would be underestimated if the cheeses added to pasta were coded as an aggregate and assigned to the pasta dish food group. However, using the USDA AMPM with FNDDS, retention of the original data set that consists of each individually coded food item mentioned in a recall and the disaggregation of coded mixed dishes and brand-name items can be used for such analyses.
Conclusion
In conclusion, the method of coding dietary data does influence results and the coding approach should be consistent within a data set. Mixtures (such as egg dishes or sandwiches) should all be coded as individual ingredients or as composites. The advantage of using a coding approach utilizing food combinations is that it provides a better picture of how people are eating. These findings may be valuable to health professionals enabling them to formulate more focused, user-friendly public health messages for vulnerable populations on how to modify their diet to make it more healthful. Accurate knowledge of how people choose and combine the foods they consume may provide better insights for nutrition researchers and policy makers on the relationships between diet and health.
Acknowledgements
Financial support: This work was supported by the Intramural Research Program, National Institute on Aging, National Institutes of Health (NIH). NIH had a role in the design, analysis or writing of this article. Conflict of interest: None. Authorship: M.A.M., M.F.K., D.A., A.B.Z. and M.K.E. designed and conducted the research. M.F.K. and D.A. coded dietary data and M.A.M. analysed the data. M.F.K., M.A.M., D.A., A.B.Z. and M.K.E. wrote the manuscript. M.A.M. and M.F.K. had primary responsibility for the final content. All authors read and approved the final manuscript. Ethics of human subject participation: All procedures were approved by the Institutional Review Boards at both MedStar Health Research Institute and the University of Delaware.


