The use of ‘smart’ devices for data collection and as a research tool, including for medical research, has gained popularity. A major advantage is that children, adolescents and young adults are highly familiar with digital media, which might ease recruiting study participants and increase compliance. Schiel et al.( Reference Schiel, Kaps and Bieber 1 ) demonstrated a high acceptance of electronic technology to assess eating habits among children and adolescents. In routine care, weighed or estimated dietary records are used to document dietary behaviour. Besides, a variety of other methodologies exists, such as 24 h recall, diet history, FFQ or combinations of these( Reference Illner, Harttig and Tognon 2 ). All of them have advantages and disadvantages for both the user and the analyst. Some limitations of traditional dietary assessment methods are the requirement to be able to write and read, high user burden, time- and cost-intensiveness, high impact on eating behaviour, dependence on good memory, and no real-time feedback messages in the case of dietary counselling e.g. for weight loss( Reference Straßburg 3 ). Moreover, the individual’s age and socio-economic status are factors limiting the choice of method( Reference Brandt, Kersting and Wabitsch 4 , Reference Magarey, Watson and Golley 5 ). For example, the level of education is part of an individual’s socio-economic status which in turn may impact literacy levels( Reference Magarey, Watson and Golley 5 ).
In recent years, digital images have offered new and alternative strategies to traditional, hand-written paper records. One possibility is the use of customary mobile devices with a built-in camera (smartphones) to document dietary intake( Reference Ptomey, Willis and Goetz 6 – Reference Six, Schap and Zhu 11 ). Previous studies reported promising results regarding the validity of digital dietary assessment methods. Researchers from Denmark compared a digital method with weighed records of evening meals over five days in adults( Reference Dahl Lassen, Poulsen and Ernst 12 ). Besides high correlation coefficients for energy intake and macronutrients, the authors stated that comparable means and acceptable 95 % limits of agreement were observed( Reference Dahl Lassen, Poulsen and Ernst 12 ). Another study revealed for most nutrients no significant discrepancies between digital images and traditional dietary records, i.e. 24 h recall and weighed record( Reference Wang, Kogashiwa and Ohta 9 , Reference Wang, Kogashiwa and Kira 10 ). In a Swedish research study, digital photography was evaluated as a feasible, reliable and valid method to assess dietary quality even in people with intellectual disabilities( Reference Elinder, Brunosson and Bergström 13 ). In other studies, participants reported satisfaction with the digital method and considered it less burdensome compared with traditional dietary assessment methods such as weighed records( Reference Wang, Kogashiwa and Kira 10 , Reference Dahl Lassen, Poulsen and Ernst 12 ). An attractive alternative to manual evaluation of images is automatic identification and quantification of foods and beverages. Researchers from the USA and Switzerland are currently working on this complex goal that seems to be feasible at least under controlled laboratory conditions( Reference Anthimopoulos, Dehais and Shevchik 14 – Reference Zhu, Bosch and Woo 16 ).
Depending on the research question and other factors, there is no ‘one size fits all’ method to assess dietary intake. A precise analysis of dietary intake is still challenging. Absolute validity of a dietary assessment method is difficult to study. Besides the duplicate portion technique, which however is very expensive and time-consuming, no reliable technique exists that determines the ‘true’ dietary intake of an individual with absolute certainty. Thereby, relative validity is evaluated by comparing the ‘test’ dietary assessment method against a ‘reference’ method. For validation of new techniques, a weighed record is commonly used as reference (gold standard)( Reference Brandt, Kersting and Wabitsch 4 , Reference Wang, Kogashiwa and Ohta 9 , Reference Wang, Kogashiwa and Kira 10 , Reference Dahl Lassen, Poulsen and Ernst 12 ), although it is recognized that it also has limitations (e.g. under-reporting due to incomplete recording and undereating)( Reference Straßburg 3 , Reference Brandt, Kersting and Wabitsch 4 , Reference Dahl Lassen, Poulsen and Ernst 12 ). Usually, statistical agreement between dietary assessment methods is evaluated by comparing group means or medians, calculating differences between measurements, correlation or regression analyses, or Bland–Altman analyses. As eating habits vary between cultures but also within societies, validity studies from one country may not be directly transferable to another country. Therefore, the present pilot study aimed to analyse the feasibility of a modern, easy-to-handle and everywhere applicable photo-based dietary method among healthy volunteers in Germany, and to validate this method against a weighed record regarding intakes of energy, macronutrients and fibre.
Materials and methods
Sample size calculation
Prior to the study, the required sample size was calculated using the statistical power analysis tool G*Power version 3.1. In accordance with Kikunaga et al.( Reference Kikunaga, Tin and Ishibashi 8 ), an average daily energy intake of 7188 (sd 1510) kJ (1718 (sd 361) kcal) was assumed. The maximum difference for daily energy intake between a weighed record and a photo-based record should be less than 10 %. Statistical power for the paired sample size was set at 80 % (α=0·05, two-tailed). Based on these criteria, sample size calculation yielded thirty-seven subjects. Considering dropouts and incomplete data (~25 %), we decided to recruit at least forty-seven participants.
Participants
Invitations for study participation were sent out via specific mailing lists to various courses of studies (e.g. medicine, psychology) at local institutions. In addition, flyers were hung up on notice boards at local universities and health-care schools. A total of seventy-five (forty-nine women, twenty-six men) healthy, non-pregnant volunteers aged ≥18 years without current intent to lose weight were recruited to participate in the Nutritional Tracking Information Smartphone (Nutris-Phone) study. During an initial personal encounter at Ulm University, Germany, participants received information on the study purpose and procedure. Individuals’ demographics were collected by a standardized questionnaire.
Four of the seventy-five participants dropped out due to time constraints and five participants provided no or invalid weighed records. From the remaining sixty-six participants (forty-two women, twenty-four men), 212 energy-containing meals were available, each documented by both the photo-based method and the weighed record. Seventeen meals had to be excluded from the comparison due to missing pictures.
Photo-based and weighed dietary record
At the initial encounter, each participant was instructed on how to take the images of their foods and beverages, and how to weigh and record them over one day. In addition, they received detailed written instructions. All used their own mobile phone with built-in camera. Each picture had to be taken in standing position from the front of the plate (placed on e.g. a table, desk, kitchen top) at an angle of approximately 45° with sufficient exposure and without zooming in. To better estimate serving sizes, a reference object (2 € coin) had to be placed in the upper corner of each picture. Different meal components had to be kept separate on the plate and participants were instructed to take one picture per meal. In the case of cooked meals, additional images had to be provided showing the respective ingredients. Extra food portions or leftovers had to be documented by additional pictures. To distinguish between them, extra food portions were marked with an additional coin. At the end of the day, participants submitted their images via email to the study centre at Ulm University, Germany. The next working day, images were evaluated to determine if all meal components could be identified. In cases of non-identification or uncertainty (e.g. fat content of milk, ingredients of a stew, juice mixed with water), participants were asked short questions by email. In most cases, one email was sufficient to clarify all questions and participants answered within 24 h. In cases of no reply, questions were resent until a response was received. Questions and answers were documented in a standardized manner.
In parallel to the photo-based technique, participants performed a weighed record documenting ingredients as well as whole meals in line with current standards( Reference Straßburg 3 , Reference Brandt, Kersting and Wabitsch 4 ). In brief, during the initial encounter they were instructed on how to weigh and document each individual food and beverage separately at the time of consumption, and in the case of leftovers after consumption, by using a conventional digital kitchen scale. Moreover, an exemplary filled-in weighed record with written instructions and contact information were handed out. Foods and beverages had to be named as accurately as possible (e.g. by using trade names, fat content) and time of consumption and way of preparation (e.g. cooked, raw, fried) had to be given. Food packages could be provided where applicable. If participants ate outside their home (e.g. restaurant), they were instructed to take pictures of the served foods and beverages, and to separate meal components where possible. For the weighed record, they had to estimate portion sizes by means of common household measures.
First, pictures were analysed by a nutrition scientist blinded to the weighed records. In a second step, the same person evaluated the weighed records. To increase the ability to assess weights, the analyst was trained prior to the evaluation of serving sizes using test photographs and a food picture booklet (see next section). Meals were categorized into breakfast, snack 1, lunch, snack 2, dinner and snack 3 by time of eating, composition/amount of meal and setting. Nutrient content was calculated based on both the estimated photo-based and weighed portions using the computer program DGExpert (version 1.6.7.1) developed by the German Nutrition Society.
Food picture booklet
To better estimate portion sizes, the analyst used a booklet with different food images of exactly known weight. The booklet was previously used in the Second German National Nutrition Survey conducted by the Max Rubner Institute, Karlsruhe, Germany and was originally created by the International Agency for Research on Cancer, Lyon, France( Reference Straßburg 3 ). For the present study, we expanded the picture booklet. In particular, pictures with different portion sizes of sweets, cakes, breads and rolls, yoghurt, vegetables and fruits were added.
Participant satisfaction
At the end of the study, participants completed a one-page questionnaire to assess satisfaction with the digital dietary record. The items could be rated on a 5-point Likert scale: ‘totally agree’, ‘agree’, ‘tend to disagree’, ‘disagree’, ‘no answer possible’. For simplification, the categories ‘totally agree’ and ‘agree’ as well as ‘tend to disagree’ and ‘disagree’ were combined in the current analysis.
Statistical analysis
Descriptive statistics are given as median with interquartile range (IQR), or as proportion. For relative validity, energy, macronutrient and fibre intakes from the weighed record and the photo-based record were compared as defined prior to the study; Spearman correlation coefficients were calculated to study the association between both methods. Bland–Altman analyses were performed to investigate the agreement between the two methods: the mean difference in energy or nutrient intake between the weighed and photo-based record was plotted against its mean value, and the 95 % limits of agreement were calculated. A difference of zero indicates perfect agreement between both methods. The Wilcoxon signed-rank test (assuming non-Gaussian distributed data) was used to analyse differences between the methods. To evaluate a systematic bias (e.g. larger difference between methods as average intake increases), simple linear regression models with the difference between methods as dependent variable and the mean of both methods as independent variable were fitted. A regression slope or an intercept significantly different from zero would indicate a systematic bias.
A two-tailed P<0·05 was considered significant. All statistics were implemented using the statistical software package SAS version 9.4.
Results
Demographics of excluded and included participants did not differ (data not shown). Participants included had a median age of 22·0 (IQR 20·0–25·0) years and a BMI of 21·6 (IQR 20·1–23·6) kg/m2, with 14 % of individuals being overweight (BMI ≥25 kg/m2). Sex-specific analyses revealed that males had a median age of 23·0 (IQR 21·5–25·0) years and females of 21·0 (IQR 20·0–24·0) years. Significantly more males than females were overweight (29 v. 5 %, P=0·005). BMI ranged between 17·3 and 25·4 kg/m2 for females and between 20·1 and 29·4 kg/m2 for males (median 20·7 (IQR 19·4–21·8) kg/m2 v. median 23·2 (IQR 21·8–25·3) kg/m2, P<0·001).
Direct food identification rate of the photo-based record was 90·4 %, which means that in 9·6 % of pictures one or more ingredients and/or total meal could not be unequivocally identified without queries or that uncertainties existed e.g. regarding fat content. However, all questions could be clarified with the participants via email.
Correlation and agreement between photo-based and weighed record
Table 1 summarizes median energy, macronutrient and fibre intakes for all meals together and for each type of meal separately. Overall, there was no relevant difference between the two methods. Spearman correlation indicated a strong and significant relationship between both methods for all nutrients (Table 1).
Table 1 Median dietary intakes assessed using the photo-based and weighed record, and difference and correlation between the methods, among healthy, non-pregnant volunteers (≥18 years, n 66), Ulm, Germany; Nutritional Tracking Information Smartphone (Nutris-Phone) study
Number of meals studied is given in parentheses; some meals did not contain all nutrients.
To convert kcal to kJ, multiply kcal values by 4·184.
* P<0·05.
† Wilcoxon signed-rank test for paired samples was used.
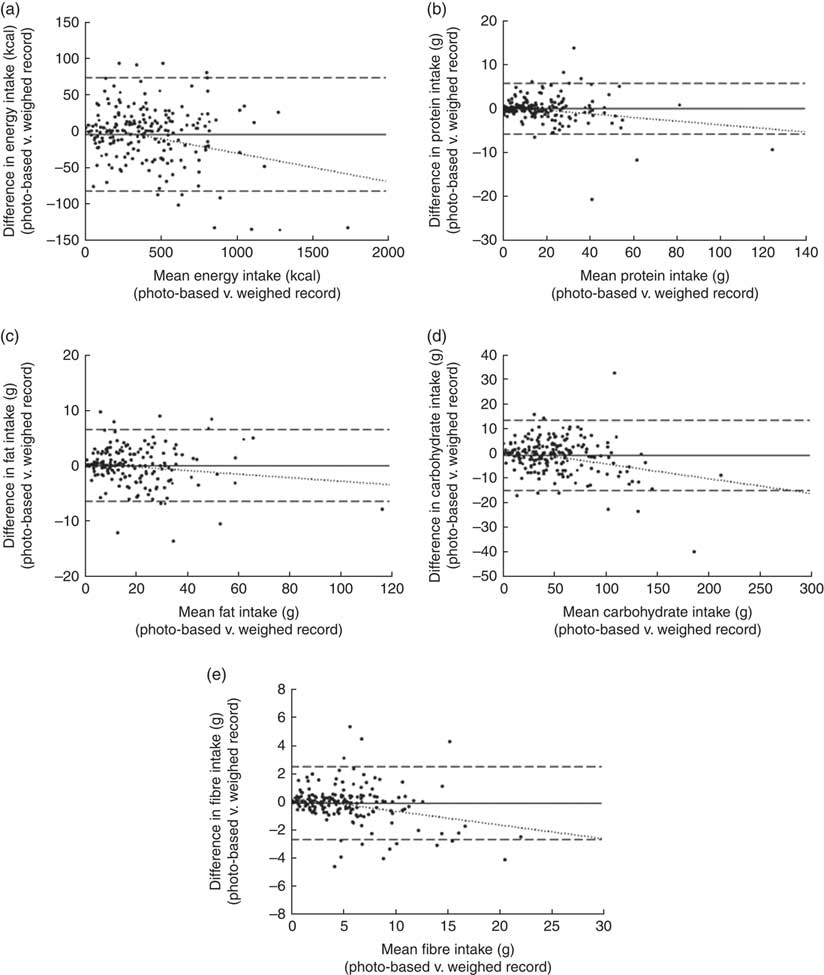
To assess the agreement between methods, Bland–Altman analyses were performed for energy and nutrient intakes (Fig. 1). Although plots showed a few outliers, the mean difference between the photo-based and weighed record was almost zero for energy and all nutrients (energy: −21·1 kJ (−5·04 kcal); protein: −0·13 g; fat: 0·01 g; carbohydrate: −1·04 g; fibre: −0·12 g). The 95 % limits of agreement ranged between 302·8 kJ (72·37 kcal) and −345·0 kJ (−82·46 kcal) for energy; 5·64 g and −5·90 g for protein; 6·45 g and −6·45 g for fat; 13·10 g and −15·18 g for carbohydrate; and 2·46 g and −2·70 g for fibre.

Fig. 1 Bland–Altman analyses of the mean bias (———) and 95 % limits of agreement (– – – – –) between the photo-based and weighed food record (· · · · · represents the regression line) among healthy, non-pregnant volunteers (≥18 years, n 66), Ulm, Germany; Nutritional Tracking Information Smartphone (Nutris-Phone) study. (a) Mean difference in energy intake (kcal; to convert to kJ, multiply kcal values by 4·184) per meal (n 212)=−21·1 kJ (−5·04 kcal); upper and lower 95 % limits of agreement=302·9 kJ (72·4 kcal) and −345·2 (−82·5 kcal); y=9·34−0·03x (intercept: P=0·035; slope: P<0·001). (b) Mean difference in protein intake per meal (n 207)=−0·13 g; upper and lower 95 % limits of agreement=5·6 g and −5·9 g; y=0·50−0·04x (intercept: P=0·075; slope: P=0·002). (c) Mean difference in fat intake per meal (n 197)=0·01 g; upper and lower 95 % limits of agreement=6·4 g and −6·4 g; y=0·49−0·03x (intercept: P=0·150; slope: P=0·054). (d) Mean difference in carbohydrate intake per meal (n 212)=−1·04 g; upper and lower 95 % limits of agreement=13·1 g and −15·2 g; y=1·67−0·05x (intercept: P=0·040; slope: P<0·001). (e) Mean difference in fibre intake per meal (n 188)=−0·12 g; upper and lower 95 % limits of agreement=2·5 g and −2·7 g; y=0·33−0·09x (intercept: P=0·031; slope: P<0·001)
Regression lines indicated a trend towards underestimation by the photo-based record with increasing values of energy, macronutrient or fibre intake. Except for fat (slope: P=0·054; intercept: P=0·150), either the regression slope or the intercept differed significantly from zero, thus indicating a systematic bias for energy (P<0·001 and P=0·035), protein (P=0·002 and P=0·075), carbohydrate (P<0·001 and P=0·040) and fibre intake (P<0·001 and P=0·031).
Participant satisfaction
Figure 2 depicts participants’ responses to the photo-based record. The majority was satisfied with the digital method, deemed it user-friendly and preferred it over the weighed record. Moreover, 72·7 % stated that it was easily applicable out of home and performable with little time expenditure. However, one young woman with small children found it challenging to take pictures of her meals before eating and to fit the digital method in her daily life especially during main meals.
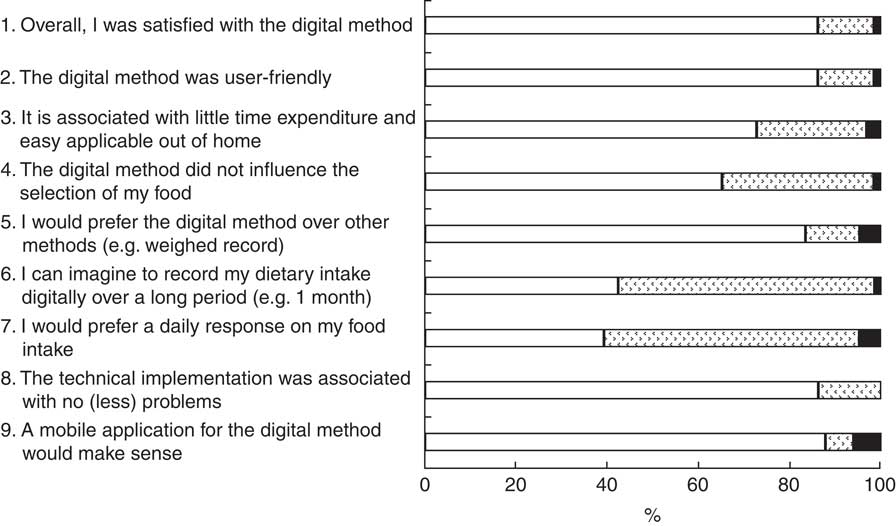
Fig. 2 Satisfaction with the photo-based dietary record (![]() , (totally) agree;
, (totally) agree; ![]() , (tend to) disagree;
, (tend to) disagree; ![]() , not applicable) among healthy, non-pregnant volunteers (≥18 years, n 66), Ulm, Germany; Nutritional Tracking Information Smartphone (Nutris-Phone) study. Majority of participants were satisfied with the method, deemed it user-friendly and preferred it over the weighed record. In nearly 90 % no major technical problems were reported
, not applicable) among healthy, non-pregnant volunteers (≥18 years, n 66), Ulm, Germany; Nutritional Tracking Information Smartphone (Nutris-Phone) study. Majority of participants were satisfied with the method, deemed it user-friendly and preferred it over the weighed record. In nearly 90 % no major technical problems were reported
Eating habits were reported to be not influenced by the digital dietary assessment in nearly two-thirds of participants. About 40 % of participants were willing to record their dietary intake with the digital method over a longer period and welcomed a daily response on their nutrition.
Some participants reported transmission problems due to limitations for the size of email attachments. However, in nearly 90 %, no or merely small technical problems with the photo-based record were reported and a mobile application was deemed suitable.
Discussion
In line with previous studies, our findings on the relative validity and feasibility of a photo-based dietary record compared with a hand-written weighed record are positive. However, a systematic bias of the photo-based technique with increasing levels of intake should be kept in mind. In their initial study on a handheld personal digital assistant with a camera, called the Wellnavi method, Wang et al. reported a good correlation with the weighed record for energy, macronutrient and fibre intakes, with acceptable differences between both methods( Reference Wang, Kogashiwa and Ohta 9 ). However, study size was small (n 20) and all participants had a major interest in nutrition. In a larger sample (n 75), the digital dietary assessment method revealed significant differences from the weighed record and correlation coefficients were lower( Reference Kikunaga, Tin and Ishibashi 8 ). Comparable to our finding, Martin et al. observed in fifty adults over three days a similarly high correlation for energy intake (r=0·95) between the so-called ‘Remote Food Photography Method’ and a weighed record( Reference Martin, Nicklas and Gunturk 7 ). However, a high correlation does not necessarily indicate perfect agreement between methods. Therefore, Bland–Altman analyses were used in our analysis. Other researchers reported a significant underestimation of energy intake with a digital dietary record by 6·6 or 11·3 % if compared with weighed records( Reference Martin, Nicklas and Gunturk 7 , Reference Dahl Lassen, Poulsen and Ernst 12 ). In our analysis, mean underestimation of energy intake with the photo-based technique was 1·2 % and not significant. In the GoCARB project, a smartphone application is designed to support type 1 diabetes patients with carbohydrate counting by using automatic evaluation of food images( Reference Anthimopoulos, Dehais and Shevchik 14 ). A mean error of less than 20 g of carbohydrate per dish was initially defined as an adequate goal( Reference Anthimopoulos, Dehais and Shevchik 14 ). In our study, underestimation was smaller.
Contrary to previous studies reporting a constant underestimation with the digital method compared with traditional dietary assessment techniques( Reference Martin, Nicklas and Gunturk 7 , Reference Kikunaga, Tin and Ishibashi 8 , Reference Dahl Lassen, Poulsen and Ernst 12 ), our data indicated underestimation merely with increasing levels of intake. One explanation might be that the study cohort of mostly students had very simple eating habits and often consumed convenience foods, where they submitted photographs of the packages. Moreover, the quality of built-in cameras in mobile phones has improved over the past years and in the meantime people are very well versed in handling the device. However, there is no doubt that the systematic bias should be considered when analysing food images. Predominantly for cooked meals with fillings, coating or crushed ingredients (e.g. stew, soup, filled pasta like ravioli, sandwiches, breaded meat/fish), or for mixed drinks, we experienced difficulties to correctly identify and quantify foods and beverages from pictures. This misclassification and misquantification may contribute to the observed underestimation with increased intake. The estimation process is complicated by add-ons to main foods (e.g. sugar or milk to coffee), hidden or unobservable foods and very amorphous foods that in turn impairs accuracy of the digital method. Although participants were asked to separate meal components on the plate, this was not always easy to adhere to under real-life conditions (e.g. in cafeterias, canteens, restaurants). Moreover, weighed records are prone to errors as well, especially in cases of self-weighed dietary reporting( Reference Whybrow, Stubbs and Johnstone 17 ). Mistakes in the selection of foods or beverages from the nutrient database can also contribute to differences between dietary assessment methods. For example, coffee powder was selected instead of consumed coffee or cooking fat was added twice (once as cooking fat and once by selection of food that already included frying fat). Moreover, the selection of different kinds of noodles (handmade or standard recipe) from the nutrient database or the use of pre-fixed recipes (e.g. spaghetti bolognaise) instead of selecting each ingredient separately resulted in substantial differences between the methods. However, this also applies to weighed records. It has to be noted that the digital dietary method also needs a lot of time spent on judging photographs or verifying information by email. Hence, it is questionable whether the digital method is superior to e.g. a weighed record in terms of time effectiveness for the researcher.
Nevertheless, the strengths of a digital dietary assessment such as reduced user burden and no need for participants to estimate portion sizes can contribute to increased user satisfaction( Reference Martin, Nicklas and Gunturk 7 , Reference Wang, Kogashiwa and Kira 10 , Reference Dahl Lassen, Poulsen and Ernst 12 ). In addition, the method works well for people who often eat out of home. In contrast to a weighed record, food and beverages do not have to be weighed. Moreover, compared with a paper-based estimated dietary record, there is no need to write ingredients down and estimate portion sizes. Nevertheless, as observed in our study, about 60 % of participants did not like a daily response on their dietary intake. Some people might be embarrassed about showing their daily food and beverage consumption to others and have significant concerns when other people evaluate their eating habits( Reference Wang, Kogashiwa and Kira 10 , Reference Dahl Lassen, Poulsen and Ernst 12 ). Giving a daily response on dietary intake can be an advantage in clinical practice and might increase success of e.g. weight-management programmes. However, in research studies aiming to evaluate dietary intake of a specific cohort, daily responses are undesirable as they may affect an individual’s intake. In contrast to the study from Dahl Lassen et al. which focused on the documentation of evening meals only( Reference Dahl Lassen, Poulsen and Ernst 12 ), the majority of our participants could not imagine to record their dietary intake with the digital method for more than one month. A direct transmission of the images via a mobile application would further simplify the method and may increase user compliance to take pictures of their foods and beverages over a longer period of time. Although food selection seemed not to be influenced by the digital record in the majority of participants, some stated that their selection of foods and beverages was altered. The avoidance of taking pictures of a second serving has been reported to lead to greater first servings in a few participants of another study( Reference Dahl Lassen, Poulsen and Ernst 12 ). Nevertheless, in line with our findings, a technology-assisted dietary record is preferred to hand-written paper records among children, adolescents and adults( Reference Schiel, Kaps and Bieber 1 , Reference Martin, Nicklas and Gunturk 7 , Reference Boushey, Kerr and Wright 18 ).
In accordance with other researchers( Reference Straßburg 3 , Reference Matthiessen, Steinberg and Kaiser 19 , Reference Illner, Freisling and Boeing 20 ), we had the experience that analysts have to be well-trained and need nutritional expertise (e.g. nutritional scientist, dietitian) to accurately and reliably estimate dietary intake from pictures. However, neither a photo-based nor a conventional dietary record is free of manipulation by the applicant which can contribute to over- or under-reporting( Reference Straßburg 3 , Reference Brandt, Kersting and Wabitsch 4 ).
Several limitations should be considered when interpreting our results; for example, available household scales were used for the weighed records, which were not recalibrated for the study, and relative validity was tested only during one day. Although the analyst who assessed weights was trained, the method may give different results if another researcher evaluates the pictures. Thereby, future studies should test inter-rater reliability. Compared with others, we analysed a larger sample but it is still too small to draw general conclusions on the applicability and feasibility in different populations. Most participants were students, not necessarily representative for the adult population as a whole. Difficulties may occur for culture-specific foods and beverages (e.g. Asian foods) due to being unacquainted with ingredients, food components or meal preparation. However, training and assistance by an individual familiar with the culture-specific eating habits may overcome this limitation. Separate studies among groups with different food cultures are needed to further strengthen the findings. A major strength of our study is the real-life setting instead of laboratory conditions with predefined meals.
Conclusion
In conclusion, the current relative validation study indicated that compared with a weighed record, the photo-based dietary assessment with customary mobile phones seems to be an accurate and valid alternative to record daily energy, macronutrient and fibre intakes in a real-life setting. However, a systematic underestimation with increasing intake (i.e. greater serving sizes or higher nutrient density) should be kept in mind. Overall satisfaction with the photo-based record was high and technical implementation was without major problems. A photo-based dietary assessment offers an innovative tool independent from the individual’s ability to estimate portion sizes as well as the opportunity of direct interaction between applicant and analyst that can at least complement and improve the accuracy of conventional dietary records( Reference Ptomey, Willis and Goetz 6 , Reference Martin, Nicklas and Gunturk 7 , Reference Lazarte, Encinas and Alegre 21 ).
Acknowledgements
Parts of the study were presented in abstract form at the annual scientific conference of the German Diabetes Association, Berlin, Germany, 4–7 May 2016 and at the 53rd research congress of the German Nutrition Society, Fulda, Germany, 2–4 March 2016. Acknowledgements: The authors wish to express their special gratitude to all the volunteers for participating in the study. For statistical analysis of data, the authors thank E. Bollow. Moreover, special thanks are extended to the EPIC study group (particularly Dr N. Slimani) and the NVSII study group (particularly Dr C. Krems) for providing access to the food picture booklet. Financial support: This work was supported by the German Diabetes Association; and the Federal Ministry of Education and Research within the German Center for Diabetes Research (DZD). Funders had no role in the design, analysis or writing of this article. Conflict of interest: The authors declare no conflict of interest relevant to this article. Authorship: N.P. conceptualized and designed the study, acquired data, contributed to the statistical analysis, interpretation and discussion of results, drafted the paper, has full access to the data in the study, and takes final responsibility for the decision to submit for publication. B.B., A.K. and D.P. acquired data, contributed to analysis and interpretation of the data, and reviewed and edited the manuscript. O.P. helped with researching data, contributed to analysis and interpretation of the data, and reviewed and edited the manuscript. D.P. analysed food pictures. R.W.H. conceptualized and designed the study, contributed to analysis and interpretation of the data, and reviewed and edited the manuscript. All authors approved the final version of the manuscript. Ethics of human subject participation: This study was conducted according to the guidelines laid down in the Declaration of Helsinki and all procedures involving human subjects were approved by the Ethical Committee of Ulm University, Germany. Written informed consent was obtained from all subjects.