


The evidence for an association between dietary behaviour and alcohol consumption patterns is reasonably strong(Reference Valencia-Martín, Galán and Rodríguez-Artalejo1–Reference Millen, Quatromoni and Gagnon4), with diet quality being poor among those consuming high quantities of alcohol(Reference Breslow, Guenther and Jual5,Reference Ma, Betts and Hampl6) . Alcohol is energy dense and in addition has a stimulating effect on food consumption, thereby resulting in increased total energy intake from food and alcohol which can lead to excess weight gain(Reference Yeomans, Caton and Hetherington7). Alcohol also suppresses lipid oxidation resulting in positive energy balance(Reference Suter, Hasler and Vetter8). Among college students deliberate reduction of food intake to compensate for alcohol-derived energy has been reported(Reference Piazza-Gardner and Barry9). Alcohol also directly affects nutrient absorption and metabolism(Reference Lieber10) and impacts on energy metabolism by directly or indirectly affecting BMR, physical activity-related energy expenditure and the thermal effect of food consumption(Reference Suter, Hasler and Vetter8).
The impact of alcohol on nutritional status is likely to be more significant for women of childbearing age, as maternal nutritional status around conception and throughout pregnancy impacts fetal development(Reference Allen11,Reference Procter and Campbell12) and the health of future generations(Reference Stephenson, Heslehurst and Hall13). Adherence to nutritional guidelines in pregnancy(Reference Morton, Grant and Wall14–Reference Jarman, Bell and Nerenberg16) and while planning a pregnancy(Reference Inskip, Crozier and Godfrey17) has been found to be inadequate. Poor maternal nutritional status is a risk factor for adverse pregnancy outcomes such as neural tube defects(Reference Abu-Saad and Fraser18). Maternal nutritional status is also a moderating factor for the manifestation of fetal alcohol spectrum disorder among the offspring of women who have consumed alcohol during pregnancy(Reference Keen, Uriu-Adams and Skalny19,Reference Young, Giesbrecht and Eskin20) .
Currently in New Zealand (NZ), 77–83 % of women aged 18–44 years drink alcohol with 19–36 % drinking at hazardous levels(21); that is, having a score of 6 or higher on the Alcohol Use Disorders Identification Test (AUDIT) scale(Reference Bergman and Källmén22). Similar trends are seen elsewhere; for example, 35–42 % of women aged 24–44 years consumed over six to eight units of alcohol on their heaviest drinking days in Great Britain(23). Earlier studies have shown that a higher level of alcohol consumption among women is associated with decreased intakes of carbohydrate and β-carotene, and drinkers had higher intakes of total energy, proteins, cholesterol, fatty acids, retinol, Fe and vitamin E(Reference Kesse, Clavel-Chapelon and Slimani3). Data from the Framingham study indicate that women with high alcohol intakes had lower intakes of fruits, vegetables, starch and dairy products, and high intakes of snacks and cholesterol-rich foods. The cluster of women with lowest consumption of alcohol had high intakes of bread and other starches(Reference Millen, Quatromoni and Gagnon4). Differences in dietary behaviours on drinking and non-drinking days have also been shown, with women having significantly higher intakes of total, monounsaturated and polyunsaturated fats, K, discretionary oil and solid fat, and lower intakes of milk and milk products, during drinking days(Reference Breslow, Chen and Graubard24). A study on postmenopausal women observed a significant decrease in vitamin B12 status when 30 g of absolute alcohol was consumed daily(Reference Laufer, Hartman and Baer25), thereby indicating an impact of alcohol consumption on nutritional status.
Compromised nutritional status among women of childbearing age has serious implications for optimal pregnancy outcomes, especially as over 80 % consume alcohol(21) and 40 % of pregnancies are unplanned(Reference Morton, Atatoa-Carr and Bandara26). Hence, understanding the association and impact of alcohol consumption on dietary behaviours of women of childbearing age is particularly important, as currently there is a paucity in such studies. There also seems to be a lack of studies that have assessed the associations of alcohol consumption patterns with the biochemical profile of women of childbearing age. The present paper reports the results of a secondary analysis, undertaken with the 2008/09 New Zealand Adult Nutrition Survey (NZANS) data, to investigate the association between alcohol consumption patterns and diet quality, nutrient intakes and biochemical profile of NZ women aged 18–45 years.
Methods
Study design and sample
The 2008/09 NZANS was a cross-sectional survey of NZ adults (15 years or older). A three-stage, stratified, probability-proportional-to-size sample design was used with an overall response rate of 61 % (n 4721), of which 2650 were women(27). To ensure adequate sample sizes to make comparisons, the Māori and Pacific ethnic groups and the age groups 15–18 years and ≥71 years were oversampled(27). A full description of the methods is available elsewhere(27). In the present paper only results for women aged 18–45 years (n 1124) are reported.
Demographic and lifestyle information
Ethnicity
Information on ethnicity was collected using standardized questions also used in the NZ census. Participants were categorized into one of three ethnic groups based on self-identification, and if they reported belonging to two or more groups, they were assigned to one group using the following order: (i) Māori; (ii) Pacific; and (iii) NZ European and Others (NZEO).
Socio-economic status
The 2006 NZ Index of Deprivation (NZDep06) was used as an area-based measure of deprivation. This index combines nine variables from the NZ census that reflect eight dimensions of material and social deprivation(Reference Salmond, Crampton and Atchinson28). It provides a score from 1 to 10 for each meshblock in NZ(Reference Salmond, Crampton and Atchinson28). A meshblock is a geographical location in NZ defined by Statistics New Zealand, each containing about sixty households in rural areas and 110 households in urban areas(29). For the 2008/09 NZANS, these scores were divided into quintiles(27). Participants living in quintile I resided in the least deprived areas and those in quintile V resided in the most deprived areas.
Education
Participants reported their highest school-level qualification, and if applicable their highest post-school qualification (greater than 3 months’ study or training). Four groups were derived: (i) no school or post-school qualifications; (ii) school qualifications only; (iii) trade or technical qualification; and (iv) post-school qualification (professional or tertiary).
Employment
Participants were categorized into three groups: (i) in paid employment; (ii) not in paid employment but not seeking work; and (iii) not in paid employment.
Smoking status
Participants were categorized into current smokers and non-smokers (including former smokers).
Food habits and alcohol consumption assessment
Participants completed a twenty-five-item Dietary Habits Questionnaire (DHQ). This questionnaire comprises questions on key dietary habits associated with diet quality and nutritional status. The DHQ was assessed for face validity using cognitive interviewing before use in the 2008/09 NZANS(27). The DHQ comprises frequency questions focusing on previous 4-week intakes of breakfast and selected foods and food groups, questions on daily intake of fruit and vegetable servings, and qualitative information on food preparation and cooking practices and the use of low-fat and low-sodium foods. A validated Healthy Dietary Habits Index (HDHI) was calculated from the DHQ. This HDHI comprises fifteen items where a score between 0 (least healthy) and 4 (most healthy) was allocated to each item based on the frequency of consumption (red meat, chicken, low-fat foods, fries, soft drinks, breakfast, fast foods, added salt, low-salt foods), the amount consumed (fruit, vegetables) or the type of item consumed (fish, milks, spreads, bread)(Reference Wong, Haszard and Howe30). Participants were categorized into tertiles of HDHI score (low, medium and high).
The DHQ also contained the following questions on alcohol consumption:
-
1. ‘Did you have a drink containing alcohol in the last 12 months?’
If the participant answered ‘yes’, the DHQ then asked:
-
2. ‘How often do you have a drink containing alcohol?’ The options provided were (i) ‘monthly or less’; (ii) ‘up to 4 times a month’; (iii) ‘up to 3 times a week’; (iv) ‘4 or more times a week’; and
-
3. ‘How many drinks containing alcohol do you have on a typical day when you are drinking?’ The options provided were (i) ‘1 or 2 drinks’; (ii) ‘3 or 4 drinks’; (iii) ‘5 or 6 drinks’; (iv) ‘7 to 9 drinks’; (v) ‘10 or more drinks’.
In order to describe alcohol consumption patterns, five groups were derived based on answers to the three questions (Fig. 1). (i) Participants who answered ‘no’ to question 1 were coded as ‘abstainers’. Using the NZ Ministry of Health guidelines for women on alcohol consumption to lower the risk of injury(31), data from questions 2 and 3 were combined to form four new categories of drinking patterns, namely: (ii) ‘more frequent heavy drinker’ (>4 drinks on a typical drinking day four times per month (interpreted as once per week) or more); (iii) ‘more frequent moderate/light drinker’ (≤4 drinks on a typical drinking day four times per month (interpreted as once per week) or more); (iv) ‘infrequent heavy drinker’ (>4 drinks on a typical drinking day drinking monthly or less); and (v) ‘infrequent moderate/light drinker’ (≤4 drinks on a typical drinking day drinking monthly or less).

Fig. 1 Schematic representation of the drinking patterns among women of childbearing age (18–45 years; n 1124) derived from the 2008/09 Adult National Nutrition Survey in New Zealand
Nutrient intakes
A four-stage 24 h diet recall was administered by trained interviewers using LINZ24 (a computer software system)(27). Of those completing one diet recall, a randomly selected sub-sample (25 %) also completed a second 24 h diet recall; however, mean nutrient intakes for the present study were calculated from the first day of recall. Energy and nutrient intakes were determined using a tailored and expanded version of the NZ Food Composition Database(27).
Biochemical indices
A non-fasting venous blood sample was provided by a total of 698 (68 %) consenting women aged 18–45 years (not pregnant). Participants visited a local public laboratory for the blood test. Full details on the analytical methods for all biochemical analyses are available elsewhere(27).
Concentrations of serum ferritin, Hb, serum Fe, and erythrocyte and serum folate were reported. Low erythrocyte folate was defined as <317 nmol/l and low serum folate as <6·8 nmol/l(Reference Wright, Bialostosky and Gunter32). Low Hb was defined as <120 g/l(Reference Looker, DAllman and Carrol33) (15–69 years); Fe deficiency without anaemia was defined as serum ferritin <12 μg/l(Reference Looker, DAllman and Carrol33) and Zn protoporphyrin >60 μmol/mol(Reference Hastka, Lasserre and Schwarzbeck34). Fe deficiency with anaemia was defined as serum ferritin <12 μg/l and Zn protoporphyrin >60 μmol/mol and low Hb(Reference Looker, DAllman and Carrol33). The cut-off for vitamin B12 deficiency was <148 pmol/l (200 g/ml) and depleted was 148–221 pmol/l(Reference Devi, Rush and Harper35).
Statistical analysis
All analyses were completed using the statistical software package Stata version 15 and all analyses have been conducted allowing for the complex survey design including clustering and survey weights. Participant characteristics were described using survey-adjusted percentages to reflect the NZ population. Multinomial logistic regression models were used to examine the association between drinking patterns and demographic and lifestyle characteristics. The reference category was ‘infrequent moderate/light’ drinker. Adjusted models included other demographic variables (age, NZDep06, education, BMI, smoking status and employment) and BMI. All statistical tests were two-sided and P < 0·05 was considered statistically significant.
Energy-adjusted nutrient intakes were calculated using the Willett residual method(Reference Willett, Howe and Kushi36). Linear regression was used to examine energy and energy-adjusted nutrient intakes across drinking patterns. Further multiple regression was then used to adjust for demographic factors known to be associated with nutritional status and drinking patterns, including age, NZDep06, education, BMI, smoking status and employment. ‘Infrequent moderate/light’ drinkers were used as the reference category for these analyses. The association between drinking pattern and HDHI was also examined by linear regression with HDHI score as a continuous variable.
Linear regression was used to examine the associations of drinking patterns with biochemical indices. Each drinking pattern category was compared with the reference category (‘infrequent moderate/light’ drinker). Multiple linear regression was done with adjustment for age, NZDep06, education, BMI, smoking status and employment. Bivariate logistic regression models were also used to compare the prevalence below-recommended thresholds. Sample sizes for those below cut-offs were below n 70, therefore we did not complete adjusted analyses.
Results
About 26 % (n 1124) of participants of the 2008/09 NZANS were women of childbearing age (18–45 years). The mean age of the group was 32 (95 % CI 31·6, 33·1) years (Table 1). The majority of women were aged 35–45 years, of European ethnicity, had post-school qualifications, were employed and less likely to be current smokers (Table 1). With respect to drinking patterns, 24 % (95 % CI 21, 28 %) were ‘more frequent heavy’ drinkers, 34 % (95 % CI 30, 38 %) were ‘more frequent moderate/light’ drinkers, 9 % (95 % CI 7, 12 %) were ‘infrequent heavy’ drinkers, 15 % (95 % CI 13, 19 %) were ‘infrequent moderate/light’ drinkers and 17 % (95 % CI 14, 20 %) were abstainers (Table 1).
Table 1 Characteristics of the sample population of women of childbearing age (18–45 years; n 1124) from the 2008/09 Adult National Nutrition Survey in New Zealand
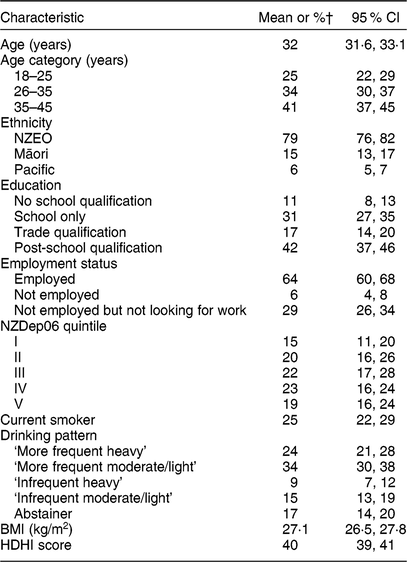
NZEO, New Zealand European and Others; NZDep06, 2006 New Zealand Index of Deprivation; HDHI, Healthy Dietary Habits Index.
† All percentages are weighted for the complex survey design.
Demographic and lifestyle factors associated with drinking patterns
Table 2 shows odds ratios for multinomial logistic regression models exploring the relationship of each drinking pattern with demographic and lifestyle variables.
Table 2 Demographics, smoking and dietary habits according to drinking pattern among women of childbearing age (18–45 years; n 1124) from the 2008/09 Adult National Nutrition Survey in New Zealand†,‡

NZEO, New Zealand European and Others; NZDep06, 2006 New Zealand Index of Deprivation; HDHI, Healthy Dietary Habits Index; ref., reference category.
*P < 0·05; **P < 0·001; ***P < 0·0001.
† Multinomial regression analyses.
‡ Reference category: ‘infrequent light/moderate’ drinkers.
‘More frequent heavy’ drinkers were more likely to be aged 26–35 years (OR = 3·2; 95 % CI 1·4, 7·5; P = 0·008) or 36–45 years (OR = 2·7; 95 % CI 1·2, 6·2; P = 0·021), of Pacific ethnicity (OR = 10·0; 95 % CI 3·6, 27·6; P < 0·001), and unemployed (OR = 2·9; 95 % CI 1·3, 6·7; P = 0·011) compared with ‘infrequent moderate/light’ drinkers (reference category). However, they were less likely to be current smokers (OR = 0·2; 95 % CI 0·1, 0·4; P < 0·001) or live in areas of high deprivation (OR = 0·3; 95 % CI 0·1, 0·9; P = 0·027). Nevertheless, the ‘more frequent heavy’ drinkers had twice the odds of having a medium (OR = 2·3; 95 % CI 1·1, 5·0; P = 0·048) or low (OR = 2·4; 95 % CI 1·1, 5·9; P = 0·032) HDHI score in comparison to the reference category.
Similarly, women who were ‘more frequent moderate/light’ drinkers were also more likely to be aged 26 years or above and of Pacific ethnicity and less likely to be current smokers (P < 0·05). ‘Infrequent heavy’ drinkers and abstainers were more likely to be Māori or Pacific (P < 0·05) and abstainers had nearly four times the odds (OR = 3·6; 95 % CI 1·5, 8·8; P = 0·005) of having a low HDHI score compared with the reference category.
Nutrient intakes and diet quality according to drinking patterns
Table 3 shows mean nutrient intakes adjusted for energy only and also adjusted for covariates. Nutrient intakes are compared between ‘infrequent moderate/light’ drinkers (reference category) and each of the other four drinking patterns. Mean intake of alcohol-free energy (adjusted for energy, P = 0·022; adjusted for covariates, P = 0·034) was significantly higher among abstainers. Carbohydrate intake was higher among ‘more frequent heavy’ drinkers (adjusted for energy, P = 0·035) and abstainers (adjusted for covariates, P = 0·0019) in comparison to the reference category. Total, saturated, mono- and polyunsaturated fat intakes were significantly higher among all drinking groups (except for saturated fats among ‘more frequent heavy’ drinkers and monounsaturated fats among ‘infrequent heavy’ drinkers) and abstainers (except for polyunsaturated fats) in comparison to the reference category (P < 0·05; Table 3). Se intake was lower among ‘infrequent heavy drinkers’ in comparison to the reference category in the fully adjusted model (adjusted for covariates, P = 0·041). Mean Zn intake was highest among ‘more frequent heavy’ (adjusted for energy, P = 0·047) and ‘more frequent moderate/light’ (adjusted for energy, P = 0·025) drinkers (Table 3). Mean intakes of retinol (adjusted for energy, P = 0·041; adjusted for covariates, P = 0·041), vitamin A (adjusted for energy, P = 0·05) and riboflavin (adjusted for energy, P = 0·028; adjusted for covariates, P = 0·013) were significantly higher among ‘more frequent moderate/light’ drinkers in comparison to the reference category. Vitamin E intakes were higher among ‘more frequent heavy’ (adjusted for energy, P = 0·040) and ‘more frequent moderate/light’ (adjusted for energy, P = 0·042) drinkers in comparison to the reference category. Mean HDHI scores were significantly lower among abstainers in comparison to women who were ‘infrequent moderate/light’ drinkers (adjusted for covariates, P = 0·008; Table 3).
Table 3 Mean nutrient intakes and diet quality according to drinking pattern among women of childbearing age (18–45 years; n 1040) from the 2008/09 Adult National Nutrition Survey in New Zealand

equiv., equivalents; RE, retinol equivalents; HDHI, Healthy Dietary Habits Index.
* P < 0·05.
† Nutrient intakes (apart from energy) adjusted for energy using the Willett residual method.
‡ Nutrient intakes (apart from energy) adjusted for age, smoking status, ethnicity and index of deprivation using multiple linear regression.
Biochemical and blood indices
Table 4 shows the results of regression models comparing biochemical and blood indices between ‘infrequent moderate/light’ drinkers (reference category) and each of the four drinking patterns. Serum folate levels were significantly lower in abstainers and all other drinking groups in both the unadjusted and adjusted models (P < 0·05; Table 4). Erythrocyte folate levels were significantly lower among abstainers in the fully adjusted model (P = 0·043), while serum vitamin B12 levels were significantly lower among ‘infrequent heavy’ drinkers in both the unadjusted and adjusted models (P < 0·05; Table 4). Table 5 presents the adjusted percentages below biochemical cut-offs for risk of inadequate status. A higher percentage of ‘infrequent heavy’ drinkers had below-recommended levels of serum folate (P < 0·001) and a trend for depleted levels of serum vitamin B12 (P = 0·062) in comparison to the reference category. Women who were ‘infrequent moderate/light’ drinkers had the lowest prevalence of Fe deficiency without anaemia (P = 0·041; Table 5).
Table 4 Selected blood indices according to drinking pattern among women of childbearing age (18–45 years; n 674†) from the 2008/09 Adult National Nutrition Survey in New Zealand

*P < 0·05; **P < 0·001; ***P < 0·000.
† Not all participants provided blood samples.
‡ Reference.
Table 5 Percentage below recommended cut-offs for selected nutrients according to drinking pattern among women of childbearing age (18–45 years; n 674) from the 2008/09 Adult National Nutrition Survey in New Zealand

† χ 2 = 73·48, P = 0·000.
‡ χ 2 = 121·5, P = 0·062.
§ χ 2 = 65·4, P = 0·041.
Discussion
The findings of the current study have improved our understanding of the association of diet with alcohol consumption patterns among women of childbearing age. A unique contribution of the paper is taking account of both the quantity and frequency of alcohol consumption to derive five distinct drinking patterns and describe their association with nutrient intakes, diet quality and biochemical profile. In contrast, other studies have only used quantity of alcohol consumed(Reference Valencia-Martín, Galán and Rodríguez-Artalejo1–Reference Ma, Betts and Hampl6).
Overall, about 83 % of women aged 18–45 years had consumed some alcohol in the year preceding the survey in 2008–2009. This proportion is similar to that obtained in the NZ Health Survey data for the period 2006–2007(37). However, in the current study, the proportion of drinkers among women aged 18–25 years was lower (70 v. 88 %) and the proportion among women aged 36–45 years was higher (91 v. 81 %) in comparison to those obtained in the NZ Health Survey(37).
Abstainers had a significantly higher intake of alcohol-free energy compared with all other drinking women. These findings seem to indicate that alcohol energy is part of the overall diet among drinking women and they do not consume excess alcohol-free energy. Nevertheless, it raises concern that food energy is replaced by alcohol energy which can negatively impact on health in the long term. A study that compared energy consumption in women on drinking and non-drinking days showed that there was no difference in overall energy intake; however, on drinking days women consumed more fat(Reference Breslow, Chen and Graubard24). Abstainers also had significantly higher intake of carbohydrates, a finding similar to that reported by Kesse et al. (Reference Kesse, Clavel-Chapelon and Slimani3), and higher intakes of saturated, monounsaturated and total fats, similar to ‘frequent’ drinkers, in comparison to women who were ‘infrequent moderate/light’ drinkers. With respect to drinkers, these findings are similar to those reported by Kesse et al. (Reference Kesse, Clavel-Chapelon and Slimani3) and the findings of the Framingham study(Reference Millen, Quatromoni and Gagnon4) which showed that women with high alcohol intakes had a high intake of snacks and cholesterol-rich foods. However, the finding that abstainers were not dissimilar to women who drink frequently with respect to fat intake and overall diet quality is contradictory to other reported studies(Reference Kesse, Clavel-Chapelon and Slimani3,Reference Breslow, Guenther and Jual5) . The reasons for this observed discrepancy may be due to the study design and alcohol categorizations adopted. The study by Breslow et al.(Reference Breslow, Guenther and Jual5) did not categorize drinkers according to drinking patterns as was done in the current study. The study by Kesse et al. (Reference Kesse, Clavel-Chapelon and Slimani3) was on women aged 40–65 years in contrast to our study which was on women aged 18–45 years. The women categorized as ‘infrequent moderate/light’ drinkers (the reference category of the current study) also had relatively higher diet quality, contrary to that reported by Breslow et al. (Reference Breslow, Guenther and Jual5) for drinkers as a whole. These findings highlight the importance of accounting for drinking patterns in diet- and alcohol-related studies.
In comparison to women who were ‘infrequent moderate/light’ drinkers, women of all other drinking categories and abstainers had lower serum folate levels (P < 0·05; Table 4). ‘Infrequent heavy’ drinkers who were predominantly aged 18–24 years also had lower serum vitamin B12 levels (P < 0·05; Table 4). This group of women also had a higher percentage of women with below-recommended levels of serum folate (P < 0·05; Table 5) and showed a trend for a higher proportion of women in this drinking category to have depleted levels of serum vitamin B12 (P = 0·062; Table 5). Although caution needs to be exercised while interpreting these results due to small sample size, it is still important, as studies have shown a direct effect of alcohol on vitamin B12 (Reference Laufer, Hartman and Baer25) and folate(Reference Eichner and Hillman38) status. Surprisingly, women who were ‘more frequent heavy’ drinkers were similar to the reference category with respect to their serum vitamin B12 levels as well as percentages of women with low or depleted levels of the micronutrients of interest (Table 5). A recent NZ study that aimed to identify a typology of drinkers identified fourteen clusters of women drinkers of which the heaviest drinkers were aged on average 24 years and consumed the largest volume of alcohol (23·7 litres in 6 months) among all women drinkers in the study(Reference Wall and Casswell39). The age group of the heaviest drinkers in the above study is similar to that of the ‘infrequent heavy drinkers’ of the current study. Hence, the findings with regard to a higher proportion of women with below-recommended levels of serum folate and depleted levels of serum vitamin B12 among this group of women may indeed be because of their ‘heavier’ drinking habits, which could not be clearly delineated in the current study due to how alcohol consumption data were collected in the 2008/09 NZANS(27) and used to derive the alcohol categories for the current study.
Our interest in women of childbearing age primarily stems from the concern that regular alcohol consumption may lead to a compromised nutritional status that can subsequently impact on pregnancy outcomes. Optimal maternal folate level is critical for normal fetal development(Reference Tamura and Picciano40,Reference Scholl and Johnson41) and a deficiency increases the risk for neural tube defects(Reference Pitkin42). Lower maternal erythrocyte folate in early pregnancy has been shown to be associated with childhood hyperactivity, poor attention and a high peer problem score which persisted even after adjusting for maternal smoking and drinking during pregnancy(Reference Schlotz, Jones and Philips43). Although in the current study erythrocyte folate did not show a significant difference according to drinking patterns, other studies have indicated that both serum folate and erythrocyte folate provide equivalent information on folate deficiency(Reference Galloway and Rushworth44). Vitamin B12 is also an important nutrient for normal fetal development(Reference Black45). Lower maternal vitamin B12 status has been shown to have an association with intra-uterine growth retardation in infants born to women who had low vitamin B12 intakes(Reference Muthayya, Kurpad and Duggan46) and is also implicated in the manifestation of neural tube defects(Reference Molloy, Kirke and Troendle47,Reference Steen, Boddie and Fisher48) .
Despite similar intakes of dietary Fe (Table 3), women who were ‘infrequent moderate/light’ drinkers had the lowest prevalence of Fe deficiency without anaemia (P = 0·041; Table 5). In all other drinking categories 8–15 % of women were Fe deficient (Table 5), which was not significantly different from that observed for abstainers (7·6 %; 95 % CI 3·9, 14·3 %; Table 5). Adequate maternal Fe status is important for optimal fetal growth and adequate Fe levels in childhood(Reference Scholl49). In addition, adequate maternal Fe status has been shown to be protective against some effects of maternal alcohol consumption, namely growth deficits and neuroanatomical and behavioural development, in exposed children(Reference Rufer, Tran and Attridge50).
A strength of the present study is the inclusion of diet quality, nutrient intakes and biochemical indices which together provide a more complete picture of the association and impact of alcohol consumption patterns on diet and nutritional status. Nevertheless, one important limitation would be the smaller sample size for some biochemical indices as only a sub-sample of women provided bloods for these analyses and the proportion of those with values below the cut-off was also small. Dietary data reported in the current study were based on a single 24 h diet recall. Although a single 24 h recall does not capture usual intake, means are adequate for making subgroup comparisons at the population level(51). Furthermore, nutrients from dietary supplements were not included in the current analyses as preliminary analyses showed no differences in the intake of dietary supplements according to drinking patterns (data not shown). Biases due to self-report of alcohol consumption patterns and dietary data are also possible. Possible misclassification of drinkers due to deriving drinking patterns from two separate questions on frequency of consumption and quantity consumed at any one time cannot be overruled. Moreover, women with different drinking patterns are also likely to drink different types of alcohol(Reference Wall and Casswell39), the effects of which could not be investigated due to lack of such data for our study sample.
Abstainers were three times as likely to have a low HDHI score compared with the reference category (‘infrequent moderate/light’ drinkers; Table 2). Mean HDHI as a continuous variable was also lowest for the group of abstainers (Table 1). As a lower score represents poorer dietary quality, we were interested in which dietary behaviours were contributing to this. On independently investigating the association of drinking patterns with the fifteen individual dietary habit items that make up the HDHI (controlling for confounding factors), we found that abstainers were similar to the other drinking pattern groups for most dietary habits apart from milk consumption, choosing reduced-fat varieties of foods and using low-salt products. For these three habits abstainers were different from the other drinking pattern groups. They were more likely to report no milk consumption and less likely to report choosing trim/trim milk compared with all the other groups. They were more likely to report consuming reduced-fat varieties of foods ‘regularly or always’ compared with ‘infrequent moderate/light’ drinkers (P = 0·005).
Other dietary habits that may have contributed to a lower score (although not statistically significant individually) were a lower percentage reporting consuming two or more servings of fruit per day and choosing light or reduced-fat margarine. Supporting the lower milk consumption (often consumed with breakfast), they were less likely to report consuming breakfast every day. Collectively these habits may have contributed to a reduced HDHI score for abstainers. We are not sure why abstainers had such habits and there may have been socio-economic factors we were unable to adjust for in our analyses. Nevertheless, being opportunistic and making best use of available data to inform a poorly researched yet important area was the driving force behind the data reported in the present paper. Dietary surveys provide a great opportunity to investigate relationships with alcohol consumption patterns; however, future surveys could use validated brief measures of alcohol consumption such as the AUDIT(Reference Saunders, Aasland and Barbor52) to enable generating distinct alcohol consumption patterns.
Overall, the findings of the current study indicate that alcohol-consuming women of childbearing age tend to replace food energy with alcohol energy. Nevertheless, women who were ‘infrequent moderate/light’ drinkers had relatively better diet quality, nutrient intakes and adequate biochemical status. Abstainers were similar to women of other drinking patterns with respect to their diet quality and nutrient intakes and serum folate levels. However, ‘infrequent heavy’ drinking women who were predominantly younger in age also had lower serum vitamin B12 levels with a higher proportion of women in this category having below-recommended levels of serum folate. Hence, alcohol consumption, especially heavy drinking patterns, may compromise nutritional status of women of childbearing age.
Acknowledgements
Acknowledgements: The 2008/09 NZANS was funded by the New Zealand Ministry of Health. The New Zealand Crown is the owner of the copyright for the survey data. The results presented in this article are the work of the authors. The authors would like to acknowledge with thanks Statistics New Zealand and the Ministry of Health, NZ for providing the data for this study. They also would like to acknowledge all those who participated in the 2008/09 Adult Nutrition Survey and those responsible for designing the study, collecting the data and preparing the data for analyses. Financial support: This research received no specific grant from any funding agency in the public, commercial or not-for-profit sectors. Conflict of interest: None. Authorship: S.P., C.S. and P.S. have read and approved the final manuscript. As the lead author, S.P. conceptualized the paper, procured the data from Statistics New Zealand, developed the alcohol consumption categories, and was responsible for the overall writing of the manuscript. C.S. did all the statistical analyses and contributed to the ‘Methods’ section of the paper. P.S. developed the diet quality index and contributed to reporting this in the ‘Methods’ section. All authors contributed to the interpretation of the findings reported in the manuscript. Ethics of human subject participation: This study was conducted according to the guidelines laid down in the Declaration of Helsinki and all procedures involving human participants were approved by the Multi-Region Ethics Committee. Written informed consent was obtained from all participants and a computer-based interviewer-administered questionnaire was used to collect information on dietary habits, nutrition-related health and demographics.


