


Despite a wide palette of dietary indices and scores for measuring various aspects of diet, researchers and policymakers are still searching for a universal tool for describing and tracking the overall quality of diets globally(Reference Arimond and Deitchler1,Reference Trijsburg, Talsma and de Vries2) . From the global public health perspective, such a metric should be sufficiently simple to use, predictive of health outcomes associated with both undernutrition and overnutrition, applicable to both developed and developing countries, usable across population groups, sensitive enough to track dietary changes over time and, whenever possible, taking into consideration the environmental effects of human diets(Reference Macdiarmid, Kyle and Horgan3,Reference Macdiarmid4) . Having comparable cross-country indicators would also be beneficial for tracking progress of the UN’s Sustainable Development Goals, specifically Goal 2(5), which calls for ‘reducing all forms of malnutrition by 2030’. On a national level, many countries without resources to conduct expensive diet monitoring would benefit from including simple diet quality monitoring tools in their economic or general health surveys(Reference Gicevic, Kremic and Fung6).
Currently available diet quality indices may be inappropriate for global use for different reasons. The Healthy Eating Index-2015 (HEI-2015)(Reference Krebs-Smith and Pannucci7) or Alternate Healthy Eating Index 2010(Reference Chiuve, Fung and Rimm8), for instance, while validated against a range of health outcomes, contain multiple nutrient components and require food composition data, making them too complex to calculate in some settings. Other validated metrics such as the Healthy Nordic diet score(Reference Olsen, Egeberg and Halkjaer9) or the modified Mediterranean diet score(Reference Warensjo Lemming, Byberg and Wolk10) are either population-specific or include alcohol components and may not be appropriate for general use. Further, many diet quality scores were developed primarily for tracking dietary risk of noncommunicable disease, not intake of nutrients of concern in low- and middle-income countries, and therefore may not be suitable for measuring diet quality globally. Finally, diet diversity scores developed for application in low- and middle-income countries, including the Minimum Diet Diversity–Women(11) and Food Group Index(12), while food based and easy to utilise, were not associated with several noncommunicable diseases in previous analyses(Reference Fung, Isanaka and Hu13,Reference Gicevic, Gaskins and Fung14) .
In an analysis of FFQ data among US women, the Prime Diet Quality Score (PDQS), a recently developed food-based measure of diet quality, was found to predict CHD, gestational diabetes and hypertension in pregnancy(Reference Fung, Isanaka and Hu13,Reference Gicevic, Gaskins and Fung14) . The PDQS was also associated with a lower risk of short telomeres in a Spanish elderly cohort(Reference Ojeda-Rodríguez, Zazpe and Alonso-Pedrero15), a lower prevalence of individual and clustered cardiovascular risk factors (obesity, hypertension, diabetes and dyslipidaemia among Spanish elderly adults with metabolic syndrome(Reference Alvarez-Alvarez, Toledo and Lecea16) and lower risks of preterm birth, low birth weight and fetal loss among Tanzanian women(Reference Madzorera, Isanaka and Wang17). In light of its simplicity (in that it does not require food composition data and nutrient-level analyses), the PDQS should undergo further validation, particularly with respect to other health outcomes globally, including mortality, and optimisation for use with various types of dietary data, including 24-h recalls, because this is often the data that are available from national surveys. If shown useful in different settings and with respect to different health outcomes, the PDQS could serve as a basis for developing a standalone diet quality assessment tool.
The role of diet quality in mortality has been consistently demonstrated in both the developed and developing world(Reference Schwingshackl, Bogensberger and Hoffmann18–Reference Mokhtari, Sharafkhah and Poustchi20). Due to a rapid epidemiological and nutrition transition, evaluation of diet–disease and diet–mortality relationships in high-income countries where large data sets are available, such as the National Health and Nutrition Examination Survey (NHANES), represents an important step in a process of metric evaluation. The HEI-2015 performed well in predicting premature death(Reference Panizza, Shvetsov and Harmon21) in several US cohorts. Although there are not many studies that use NHANES data to examine the association between HEI-2015 and mortality, studies among elderly or metabolically-obese normal-weight persons(Reference Rathod, Bharadwaj and Badheka22,Reference Park, Fung and Steck23) , and a study of the original HEI among adults in NHANES(Reference Kappeler, Eichholzer and Rohrmann24) suggested inverse associations between diet quality and all-cause mortality.
As part of our wider efforts to develop and comprehensively assess the PDQS in relation to health outcomes and across different populations and economic settings, in the current study we evaluated the validity of the PDQS against all-cause mortality in NHANES and compared its performance with that of the HEI-2015.
Methods
Study population
The NHANES is a repeated cross-sectional, stratified, multistage probability survey of the US population. Detailed description of the survey design is published elsewhere(Reference Zipf, Chiappa and Porter25). Since 1999, NHANES has been a continuous survey with two years representing one cycle. Members of participating households provide data on diet (via multiple-pass 24-h recall), health and health behaviours and undergo physical examinations at a mobile examination center(Reference Zipf, Chiappa and Porter25). Administration of certain NHANES questionnaires is repeated by telephone 3–10 d after physical examinations. Since 2003, the follow-up assessment included the 24-h recall module as well (collected by telephone); the present analysis includes data from the 2003 to 2004 NHANES and later survey cycles, in order to make use of repeated dietary recalls for the purpose of accounting for within-person variation in statistical analysis. We analysed three consecutive NHANES cycles (2003–2004, 2005–2006 and 2007–2008); 2007–2008 was chosen as the last cycle to allow sufficient exposure lag because 2015 was the latest year from which mortality data were available. Participants younger than 40 years were excluded from the analysis; this cut-off was chosen in order to restrict the sample to participants at a higher risk of dying, while at the same time avoiding major reductions in sample size.
Of 9643 participants with 2 days of dietary intakes in NHANES 2003–2004, we excluded 1289 (13 %) participants for whom at least one of two 24-h recalls were flagged as unreliable; 213 (2 %) who reported currently being pregnant; 745 (8 %) who reported a having history of myocardial infraction, congestive heart failure, stroke or cancer; 280 (3 %) with diagnosed diabetes mellitus and 5356 (56 %) who were younger than 40 years. For NHANES cycle 2005–2006, of 9950 participants, we excluded (according to the same order and criteria applied in 2003–2004) 1521 (15 %), 200 (2 %), 617 (6 %), 298 (3 %) and 5528 (56 %) participants, respectively, and in NHANES cycle 2007–2008, of 9762 participants, we excluded 1924 (20 %), 39 (1 %), 856 (9 %), 424 (4 %) and 4451 (46 %), respectively. The final study sample consisted of 5525 individuals (see online supplementary material, Supplementary Figure 1). The study was exempt from IRB review because it included secondary analysis of deidentified data.
Diet quality scores
We used data from two 24-h diet recalls per person to construct derive the HEI-2015 and PDQS for each individual. The HEI-2015(Reference Krebs-Smith and Pannucci7), derived from the USDA Food Patterns, is a measure of diet quality based on adherence to the 2015 Dietary Guidelines for Americans(26). It consists of thirteen components, including three nutrient-based ones (the ratio of polyunsaturated (PUFA+MFA)/SFA, saturated fat and Na) and ten food groups. The maximum HEI-2015 score is 100. To calculate point values for the food-based components, we used the MyPyramid Equivalents Database (MPED 2.0) for the 2003–2004 survey cycle and Food Pattern Equivalents Databases for 2005–2006 and 2007–2008; point values for nutrient-based components were calculated using total nutrient intakes in NHANES. To derive HEI-2015 scores for each individual, we first summed all amounts of dietary constituents over 2 days pertaining to thirteen HEI-2015 components separately, as well as energy amounts corresponding to the same dietary constituents. Then, we calculated thirteen ratios for each individual using these 2-d sums and subsequently scored the ratios according to the HEI scoring standards for each component. The component scores were then summed to calculate the total HEI-2015 score for each individual(27).
The PDQS was developed from the PrimeScreen questionnaire(Reference Rifas-Shiman, Willett and Lobb28) to serve as a simple-to-use, global diet quality metric. Selection of the score components was based on expert knowledge of diet–disease relationships and involved selecting food groups high in selected dietary constituents (Table 1). The PDQS is a fully food-based score, making any PDQS-based standalone diet assessment tools easy to utilise (without requiring food composition databases and nutrient analyses). Initially, the PDQS consisted of fourteen ‘‘healthy” food group components (dark green leafy vegetables, cruciferous vegetables, carrots, other vegetables, citrus fruits, other fruits, legumes, nuts and seeds, poultry, fish, eggs, whole grains, low fat dairy and liquid vegetable oils) and seven “unhealthy” ones (red meat as a main dish, processed meat, potatoes, refined grains and baked goods, sugar-sweetened beverages, fried foods and sweets and ice cream)(Reference Fung, Isanaka and Hu13,Reference Gicevic, Gaskins and Fung14) . In the current study, we modified the components (Table 1) to separate deep orange fruits from vegetables (containing >130 RAE/100g)(12), add deep orange tubers as a positive component and to classify eggs as a ‘neutral’ component among adults, resulting in 15 ‘healthy’, 7 ‘unhealthy’ and 1 ‘neutral’ component. Given that ‘eggs’ remain a PDQS component (for use in low- and middle-income countries and among small children), in the current study, we assigned a point value of ‘2’ to each participant. This approach was already used in our previous analysis(Reference Gicevic, Gaskins and Fung29), as a form of ‘neutral’ coding.
Table 1 Prime Diet Quality Score (PDQS) components, modified version
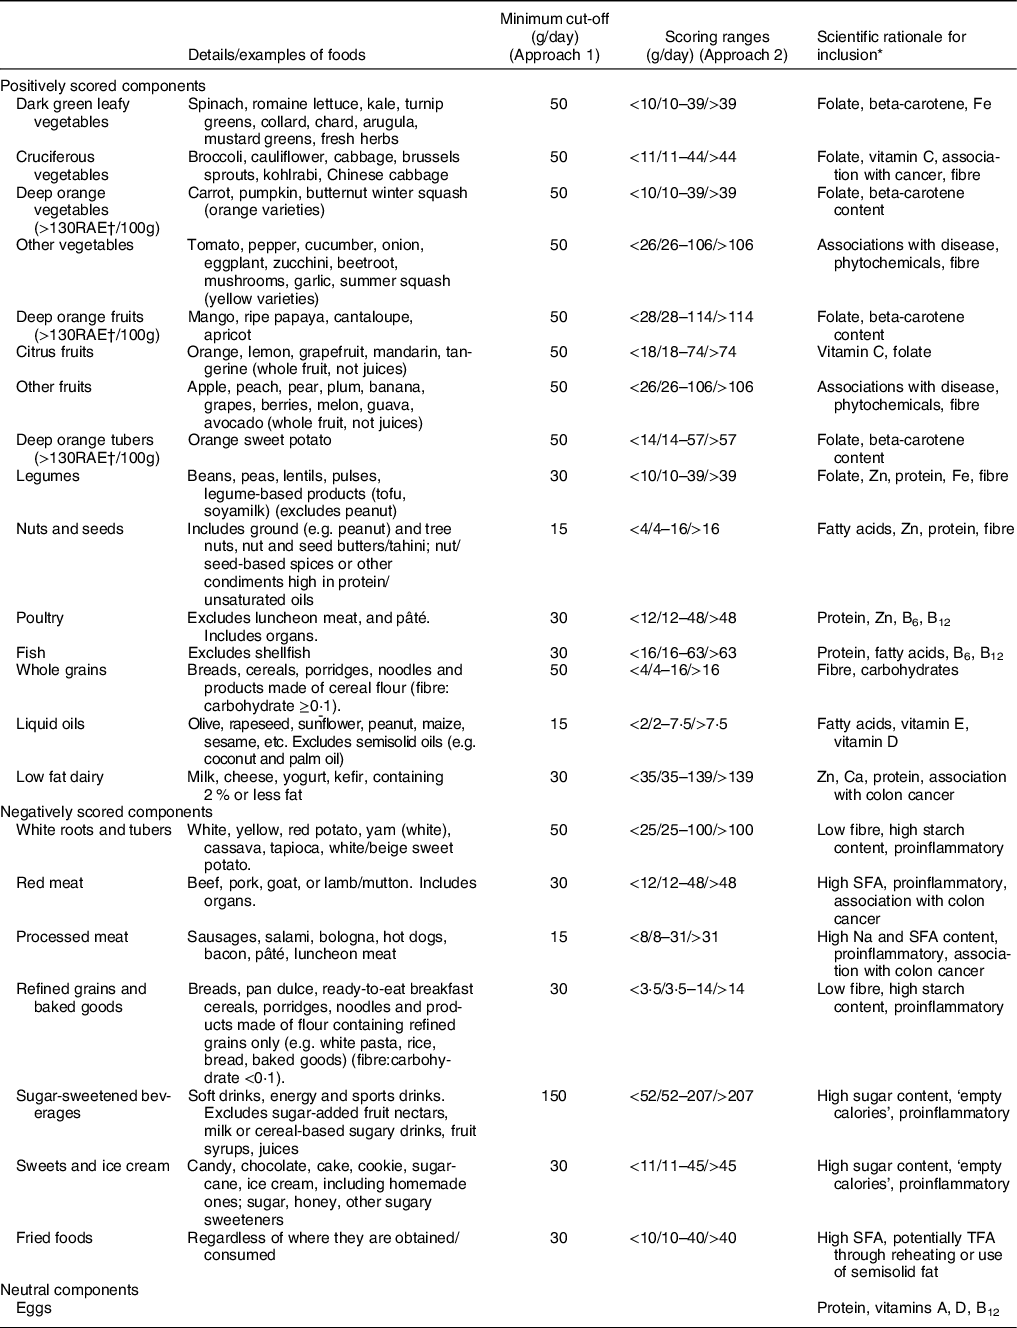
* Only the leading reasons for inclusion are given; there could be other benefits for inclusion of each component not listed here.
† RAE, retinol activity equivalent.
Deriving PDQS for NHANES participants consisted of several steps. First, we assigned a PDQS component to each USDA food code in the Food and Nutrient Database for Dietary Studies (FNDDS), using the food code descriptions whenever possible. There were multiple instances (for example, in case of determining whether a food should be categorised as ‘refined grain’ or ‘whole grain’), in which we consulted the FNDDS ingredient nutrient values. Simple foods (such as cabbage, lemon or ice cream) were assigned a single PDQS code. Composite foods, on the other hand, were assigned two PDQS codes corresponding to their two major component ingredients (based either on the title or the two leading ingredients from the FNDDS ingredient nutrient files), each weighed by 0·5. For example, a chili with beef and beans would be coded both as ‘red meat’ and ‘legumes’. Then, amounts of each food in grams were summed up with other reported foods from each of these food groups. Finally, the total consumed daily amounts of each food group were then compared with thresholds for that PDQS component.
Foods unaccounted for by the PDQS, such as high-fat dairy, seafood or various spices and alcoholic beverages, as well as eggs (while formally a PDQS component, eggs were not scored in the current analysis), were excluded from the analysis. Finally, we calculated the PDQS using two scoring approaches to evaluate its robustness. For approach 1 (Table 1), piloted elsewhere(Reference Gicevic, Gaskins and Fung29), a minimum amount was set for foods assigned to each PDQS component that was considered as meeting the requirement. For ‘healthy’ components, we assigned a point value of ‘0’ if no foods from a component were eaten at the minimum amount on either day, a ‘1’ if foods from a component were consumed at the minimum amount on one of the 2 days and a ‘2’ if at least one food from a component was consumed at the minimum amount on both days. ‘Unhealthy’ components were reversely coded (i.e. a ‘0’ was assigned if foods from a component were consumed on both days and a ‘2’ if no foods from a component were consumed on either day). For approach 2 (Table 1), a standard portion size was identified for each food group based on a single food considered broadly representative of each component and converted into three daily gram ranges (corresponding to point values of 0, 1 and 2 for ‘healthy’ components and 2, 1 and 0 for the ‘unhealthy’ ones). These ranges, if extrapolated, corresponded to intake frequencies of 0–1, 2–3 and 4+ per week. The described approach appeared to produce a reasonably widespread of low, medium and high intake ranges in analysis of multiple cross-sectional and cohort data sets from China, India, Mexico and several African countries(30). These ranges were then applied to simple averages calculated for each food group in order to make use of both diet recall days. In the current study, the PDQS, in both scoring approaches, has a potential range of 2-46 (with eggs treated as a neutral category, everyone was assigned a ‘2’). We did not adjust the PDQS for total energy, as it consists of a limited number of foods/food groups. Hence, any PDQS-based questionnaire that used to collect primary data on diet quality would not obtain data on total energy intake.
Outcome and covariates’ assessment
To determine mortality status, we used NCHS Public-Use Linked Mortality Files linked until 2015 with a probabilistic matching algorithm to the National Death Index. Participants with mortality status 0 (MORTSTAT = 0) were considered to be alive through the end of 2015. Analysis included potential confounders of the association: sex, age (continuous), race/ethnicity (non-Hispanic black, non-Hispanic white, Hispanic, Asian and Native American), days of the week on which the two recalls were recorded (weekend/weekend, weekend/weekday, weekday/weekday, weekday/weekend), smoking status (current, past, never smoker), alcohol consumption (nondrinker, 1 drink /week, 2–4 drinks/week, 5–10 drinks/week, 11–18 drinks/week and 19+ drinks/week, missing), tertiles of physical activity score and BMI (<25, 25–29·9, 30–34·9, 35 and above, missing). The physical activity score was created from the NHANES questionnaire on physical activity over the past 30 d, by assigning one point for each of the reported moderate- or vigorous-level activities and deducting a point for each sedentary activity. We opted for the questionnaire data as physical activity monitor data were not available for one of the three cycles. However, as the physical activity questionnaire was also changed in 2007–2008, we selected the most similar variables in each cycle. The described approach enabled us to order to rank participants by the level of their physical activity in a uniform way across the three survey cycles. Three participants who refused or gave uninformative answers about their smoking status were coded as ‘past smoker’, while 1003 participants with missing alcohol intake and sixty four with missing BMI were coded as ‘missing’, allowing us to keep them in the study sample. The percentage of missing values for each covariate ranged from <1 % for smoking to 18 % for alcohol intake.
Statistical analysis
We assessed differences in participant characteristics between the top (Q5) v. reference (Q1) quintile of diet quality score using χ 2 (for categorical) and Mann Whitney U (for continuous variables) tests. Cox proportional hazards models of time to mortality using time as the metric were used to evaluate the association with the diet quality indices. The assumption of proportional hazards was assessed using appropriate residuals plots (Schoenfeld, scaled Schoenfeld and martingale) and tests of interaction between each variable with time, which revealed no significant departures for either diet score or any covariates. Diet scores were evaluated both as categorical (quintiles) and continuous exposures. Each continuous diet score was categorised into quintiles for use in multivariate Cox regression models (Model 1 adjusted for age, sex and race and Model 2 fully-adjusted for covariates) to evaluate associations between diet quality and mortality over time. Adjusted hazard ratios and their 95 % CI were estimated with the lowest quintile of diet quality score (Q1) as the reference group. Because the scores were on different scales and not normally distributed, they were first standardised by conversion to probit scores and then used as continuous exposures (1-sd increase) in Cox regression models. Linear tests for trend were performed by substituting the observed diet scores for each participant with the mean score within the quintile to which the participant belonged. In a stratified analysis, in a separate set of Cox models, we evaluated interactions between diet quality Z-scores with sex (male v. female), age (40–60 v. >60 years), BMI (<25 v. ≥25) and smoking status (smoker v. non-smoker/past smoker) adjusted for all other covariates. In a third Cox model, we formally compared the performance of the two scores in predicting all-cause mortality by fitting PDQS and HEI-2015 diet quality probit scores in a model and using a Wald test to obtain a p-value for the difference between the PDQS and HEI-2015 β coefficients. Probit scores can be used(Reference Chiuve, Fung and Rimm8,Reference Gicevic, Gaskins and Fung14) to standardise to the same scale scores that are not necessarily normally distributed. In a fourth set of Cox models for each score, we evaluated associations between each diet score component and mortality, adjusting for all other score components and covariates. In a sensitivity analysis, due to potential for reverse causality (as some participants might have improved their diets after being diagnosed with an illness), we excluded deaths occurring in the first 2 years of follow-up after the second diet recall in each wave. We accounted for survey-based design of NHANES in the analysis whenever feasible; hence, most results are interpretable as representative of eligible US population. Due to statistical intricacies related to simultaneous adjustment for sampling weights and implementation of the aforementioned Wald test, comparison of predictive powers of the two scores and effect modification analyses (Supplementary Table 3) do not include sampling weights. Statistical analyses were performed using R Statistical Software (Foundation for Statistical Computing, Vienna, Austria) version 3·5·1. All tests were two-sided, with P < 0·05 considered statistically significant.
Results
Over 51 248 person-years of follow-up from 5525 individuals (mean: 9·2 years), 767 deaths were recorded. On average, participants in the top quintile of diet score were older, with a higher proportion of females, never smokers and physically active persons and had higher intakes of fibre, vitamins A, B1, B2, B6, C, folate, Ca, Mg, K and Fe, as well as lower intakes of total fat (PDQS only), SFA, Na, carbohydrates and total sugars (PDQS only) compared with the reference diet score quintile (Table 2).
Table 2 Characteristics of the inferred population by quintiles of diet quality scores*

* Higher scores indicate greater dietary quality. HEI-2015: Healthy Eating Index-2015; PDQS, Prime Diet Quality Score. Q, quintile. N 5525.
† Healthy’ components: ‘0’ = no foods from component eaten during both days, ‘1’ = foods consumed on one day, ‘2’ = foods consumed on both days. ‘Unhealthy’ components were reversely coded. Minimum quantities used as cut-offs.
‡ Daily gram ranges identified using data from several countries, assigning 0, 1 or 2 points for each component (negative components reversely scored) based on the amount consumed during each day.
§ Data are presented as weighted medians (Q1, Q3) for continuous variables and weighted percentages for categorical variables to account for survey design.
‖ Classified into tertiles of a total PA score (a sum of positive points for moderate and intense activities and negative points for sedentary activities).
¶ Statistically significant difference (P < 0.05) comparing Q1 and Q5, using χ 2 (for categorical variables) and Mann Whitney U (for continuous variables) tests.
In age, sex and race-adjusted models (Model 1), HR pertaining to overall survival comparing the highest (Q5) v. lowest (Q1) quintiles were 0·51 (95 % CI 0·39, 0·67; P trend<0·0001) for the PDQS scoring approach 2, 0·53 (95 % CI 0·42, 0·68; P trend<0·0001) for the PDQS scoring approach 1, and 0·60 (95 % CI 0·46, 0·79; P trend = 0·0008) for the HEI-2015 (Table 3). After also adjusting for other covariates (Model 2), the HR somewhat attenuated to 0·70 (95 % CI 0·51, 0·96; P trend = 0·03) for the PDQS scoring approach 2, 0·75 (95 % CI 0·57, 0·99; P trend = 0·01) for the PDQS scoring approach 1, and 0·77 (95 % CI 0·57, 1·03; P trend = 0·20) for the HEI-2015 (Table 3).
Table 3 Adjusted hazard ratios (HR) (95 % CI) of mortality by quintile of diet quality scores*

PDQS, Prime Diet Quality Score; N 5525, events = 767.
* Proportional hazards models used to estimate HR and 95 % CI; higher scores indicate greater dietary quality; HEI-2015: Health Eating Index-2015.
† Standardised to probit scores (1-sd).
‡ Models adjusted for age (continuous), sex and race/ethnicity.
§ Models adjusted for age (continuous), sex, race/ethnicity, day of week (weekend v. weekday), smoking status (nonsmoker, past and current), alcohol use (nondrinker, 2–4 drinks/week, 5–10 drinks/week, 11–18 drinks/week or 19+ drinks/week), physical activity (low, medium and high), BMI (<25, 25–29.9, 30–34.9, 35 and above).
‖ ‘Healthy’ components: ‘0’ =no foods from component eaten during both days, ‘1’ = foods consumed on one day, ‘2’ foods consumed on both days. ‘Unhealthy’ components were reversely coded. Minimum quantities used as cut-offs.
¶ Daily gram ranges identified using data from several countries, assigning 0, 1 or 2 points for each component (negative components reversely scored).
When we compared predictive performance of scores against incident mortality, the HEI-2015 was not significantly superior to the PDQS (P = 0·44 in Model 1, P = 0·88 in Model 2) (Table 4). Among women in fully adjusted models (Supplementary Table 2), the HR were 0·61 (95 % CI 0·42, 0·88; P trend = 0·02) for the PDQS scoring approach 2, 0·76 (95 % CI 0·52, 1·10; P trend = 0·03) for the PDQS scoring approach 1, and 0·60 (95 % CI 0·42, 0·87; P trend = 0·03) for HEI-2015. In men, HR in fully adjusted models were 0·72 (95 % CI 0·51, 1·00; P trend = 0·10) for the PDQS scoring approach 2, 0·75 (95 % CI 0·52, 1·09; P trend = 0·11) for the PDQS scoring approach 1, and 0·85 (95 % CI 0·58, 1·25; P trend = 0·58) for HEI-2015. In interaction analyses by sex, or by age, smoking status and BMI, we found no statistically significant differences in the associations between the PDQS and mortality (Supplementary Table 3). Further, higher scores of the following components of the PDQS were associated with lower mortality: ‘other vegetables’ (for a 1-point increase, HR = 0·75, 95 % CI 0·63, 0·89), ‘nuts and seeds’ (HR = 0·82, 95 % CI 0·69, 0·99), ‘poultry’ (HR = 0·82, 95 % CI 0·67, 0·99), “red unprocessed meat” (HR = 0·85, 95 % CI 0·73, 0·99) and ‘sugar-sweetened beverages’ (HR = 0·86, 95 % CI 0·74, 0·98). For the HEI-2015 score components, none of the associations were significant (Supplementary Table 4). Finally, in a sensitivity analysis where we removed deaths (n 110) that occurred within the first two years after the second diet recall (Supplementary Table 5), HR comparing the highest (Q5) to the lowest (Q1) quintile in fully adjusted models were 0·68 (95 % CI 0·46, 0·98; P trend = 0·04) for the PDQS scoring option 2, 0·71 (95 % CI 0·52, 0·97; P trend = 0·01) for the PDQS scoring option 1, and 0·71 (95 % CI 0·52, 0·98; P trend = 0·14) for HEI-2015.
Table 4 Comparing predictive powers of the two diet quality metrics*

HEI-2015, Healthy Eating Index-2015; PDQS, Prime Diet Quality Score.
* Standardised to probit scores (1-sd).
† P-value based on the Wald test evaluating the hypothesis that the β coefficient for the HEI-2015 equals the β coefficient for the PDQS.
‡ Adjusted for age (continuous), sex and race/ethnicity.
§ Fully adjusted for age (continuous), sex, race/ethnicity, day of week (weekend v. weekday), smoking status (nonsmoker, past and current) alcohol use (nondrinker, 2–4 drinks/week, 5–10 drinks/week, 11–18 drinks/week or 19+ drinks/week), physical activity (low, medium, high), BMI (<25, 25–29.9, 30–34.9, 35 and above).
Discussion
Diet quality, measured by the PDQS, was inversely associated with all-cause mortality among U.S. adults participating in the NHANES between 2003 and 2008, and followed until 2015. In the pooled sample of men and women, HEI-2015 and PDQS had similar inverse associations with total mortality (with the HEI-2015 associations not reaching statistical significance in fully adjusted models). Our results were in line with the literature on diet quality and mortality as HEI-2010, Alternate Healthy Eating Index, Alternate Mediterranean Diet and Dietary Approaches to Stop Hypertension (DASH) were all associated with a reduced risk of death from any cause in several meta-analyses, and other studies(Reference Warensjo Lemming, Byberg and Wolk10,Reference Mokhtari, Sharafkhah and Poustchi20,Reference Onvani, Haghighatdoost and Surkan31,Reference Sofi, Macchi and Abbate32) .
The main PDQS findings align with previous analyses of the PDQS documenting inverse associations with a risk of CHD among men and women in several large U.S. cohorts(Reference Fung, Isanaka and Hu13), with a risk of shorter telomeres as markers of cellular aging among elderly Spanish SUN cohort participants(Reference Ojeda-Rodríguez, Zazpe and Alonso-Pedrero15), and with a lower prevalence of individual and clustered cardiovascular risk factors among elderly participants of the Spanish PREDIMED-Plus cohort(Reference Alvarez-Alvarez, Toledo and Lecea16). While the HR among women appeared somewhat stronger compared with those among men in the HEI-2015 and the PDQS (scoring option 2) models with categorised exposure (Supplementary Table 2), these differences, as well as differences by age, BMI and smoking status were not statistically different in the interaction models, possibly due to lack of power for subgroup analyses. Coming up with a diet score that performs well among both sexes is an important characteristic to strive towards when developing a universal dietary metric. Future analyses should therefore investigate gender-based associations of PDQS with mortality in large cohorts in both developed and developing countries.
Both PDQS scoring approaches led to similar results, indicating the metric robustness and suggesting that selection of appropriate components is more important than the scoring method. However, exploring different component weighting schemes as the next step might still be useful to evaluate nuances in association of the PDQS with under- and over-nutrition-related health outcomes. Having data from multiple days of diet recall has known advantages(Reference Willett33) for evaluating diet-disease relationships, yet a single day per subject is sufficient for tracking mean dietary intakes in a group over time. In addition, dietary data in developing country settings typically include only one diet recall per participant. Therefore, devising a scoring approach that does not require multiple days of diet data (i.e. scoring approach 2) can be of benefit for diet quality tracking purposes.
The evaluation of individual diet score components showed inverse associations of mortality with a higher consumption of ‘poultry’, ‘other vegetables’ and ‘nuts and seeds’ (PDQS). The association of ‘other vegetables’ (e.g. tomato, lettuce, pepper, avocado, onion and cucumber) was most probably strong due to the fact that tomato(Reference Mazidi, Katsiki and George34) and lettuce(Reference Liu, Liu and Huang35) are the most frequently consumed vegetable types. This finding supports consumption of all types of vegetables(Reference Wang, Ouyang and Liu36). Contrary to the overall literature, higher consumption of red meat and SSB were also associated with a lower mortality in this sample, probably due to chance or reverse causation as the duration of follow-up was not long.
When we formally compared the PDQS’s independent predictive ability to that of the HEI-2015, we found that these were similar. This is especially relevant for the needs of global monitoring and tracking of diet quality as PDQS allows for a ‘quick and easy’ evaluation in settings where food composition databases and expertise for conducting complex dietary surveys may be lacking. In addition, diet assessment tools developed from this diet quality metric could also serve for rapid screening for diet quality and monitoring of patients in health practices. Finally, when we removed the deaths that occurred within the first two years after completing the second diet recall in order to evaluate for potential reverse causality, we observed slightly stronger HR, with the HR in the top quintile of the HEI-2015 reaching statistical significance. This suggests that some participants might have improved their diet quality within two years before death, possibly due to suspicion of illness.
The current study is a part of our aim to develop a universally applicable diet quality metric that can be used across different population groups. Thus, we introduced some variations to the PDQS; for instance, in the present analyses we treated eggs as a ‘neutral category’ for adults, while it remains a ‘positive’ component for young children and women in low-income p0countries. We made this decision to accommodate both the findings that while eggs have a minimal overall association with CVD in developed countries, there is a possible positive association among person with diabetes(Reference Shin, Xun and Nakamura37–Reference Drouin-Chartier, Chen and Li39) and also that eggs are an important source of protein and choline for women and children in developing countries(Reference Iannotti, Lutter and Bunn40). Further, we separated ‘deep orange fruits’ from ‘deep orange vegetables’ and ‘deep orange tubers’, to enable separate analyses by these food components. This scoring could undergo further modifications in the future.
Our study has several strengths. To our knowledge, this is the first analysis of the HEI-2015 and mortality using NHANES data. Second, although the NHANES design is repeated, cross-sectional, mortality data were collected over time, allowing us to do a prospective analysis. Finally, we were able to evaluate and adjust for multiple potential confounding variables. Limitations should also be mentioned. First, a second 24-h recall was not available in NHANES until 2003. Given that at least 2 days of diet recall are required to reduce intra-person variation and calculate PDQS (scoring approach 1), we had to restrict our analysis to three survey waves. This approach inevitably led to reducing the number of cases in the sample. Second, since we used a simple HEI2015 scoring algorithm, we were not able to fully remove the effect of intra-person variation in our scores based on only 2 days of intake; this variation will tend to attenuate association estimates towards the null and may explain non-significant associations with HEI-2015 in fully adjusted models(Reference Willett33). Third, the numbers of deaths in gender-specific analyses were small, and it influenced our ability to detect significant associations in some subgroup analyses. Nevertheless, we were still able to demonstrate clear associations in the overall population, which was the main objective of the current study. And finally, the PDQS models were not adjusted for energy as any PDQS-based questionnaire would not provide data on total energy intake. The unadjusted PDQS therefore better reflects what would be used in practice. However, this could have led to assigning higher scores to persons who tend to eat more of everything and who have a higher chance of being overweight/obese. We did manage to adjust for energy intake to some degree by adjusting for BMI in Model 2, although this may have underestimated the effects of diet quality because some may have been mediated by adiposity. Finally, while there was a disproportionally high proportion of deaths among individuals with missing BMI (38 % compared with 15 %), there is no reason to believe that the effect of missingness would be differential with respect to the HR estimates related to the two diet scores under examination. Excluding these sixty-four participants did not lead to significantly different HR estimates, but it did slightly reduce the power for tests of statistical significance.
While the PDQS aims to become a universally applicable metric, its food components are to some degree context specific as they may contain different local foods in different settings. Therefore, it will be important to evaluate the validity of this approach in other populations. Future research should also evaluate the PDQS in relation to nutrient adequacy, mortality and other health outcomes in low- and middle-income countries; its use with children; its function as a stand-alone questionnaire to assess diet quality and the extent to which it can evaluate the environmental impacts of food production systems(Reference Willett, Rockström and Loken41). As an additional next step, it will be important to explore how the PDQS can be integrated into existing national survey platforms. Although most countries do not regularly conduct dietary surveys, household surveys are widely conducted and often include extensive data on household food purchases. These surveys have limitations in nutrition research (stemming in part from the difficulty in capturing intra-household distribution of food and consumption of food away from home). However, observations collected at the household level potentially provide independent information about household food security and a range of household- and individual-level covariates that may help contextualise and add value to diet quality metrics(Reference Fiedler42). It would therefore be worthwhile to develop and evaluate methods for collecting and analysing household measurements to calculate the PDQS and other food-based metrics.
To conclude, we were able to demonstrate that the PDQS is comparable to the HEI-2015 as a predictor of all-cause mortality in a sample of US adults. These findings contribute to the literature on the PDQS, a food-based diet quality metric previously shown to be inversely associated with risks of gestational diabetes, hypertension in pregnancy, CHD, short salivary telomere length and prevalence of cardiovascular individual and clustered risk factors among adults in high-income, and adverse pregnancy outcomes in low-income country settings(Reference Fung, Isanaka and Hu13–Reference Alvarez-Alvarez, Toledo and Lecea16).
Acknowledgements
Acknowledgements: The authors thank Teresa T. Fung and Yangping Li from the Department of Nutrition of Harvard T.H. Chan School of Public Health for sharing their work on developing PDQS scoring approach 2. Financial support: IMMANA Postdoctoral Fellowship Research Grant (SG). The funder had no role in the design, implementation, analysis and interpretation of the data. Conflict of interest: There are no conflicts of interest. Authorship: Conceptualisation: SG, WW. Methods: SG, ET, WW. Data preparation and analysis: ET, SG, SB. Supervision: WW. Writing – original draft: SG, ET. Writing – review and editing: WW, SB. All authors have read and approved the manuscript. Ethics of human subject participation: The current study was conducted according to the guidelines laid down in the Declaration of Helsinki, and all procedures involving research study participants were approved by the NHANES Institutional Review Board (IRB)/NCHS Research Ethics Review Board (ERB) (Protocols #98-12 and #2005-06). Written informed consent was obtained from all subjects.
Supplementary material
For supplementary material accompanying this paper visit https://doi.org/10.1017/S1368980021000859


