


Urbanisation is growing in African countries, namely in Kenya, and consequently people’s lifestyles are undergoing an adaptation, and parameters such as diet and physical activity are changing as well(1). Urban areas are characterised by diets rich in fat, sugar, more milled and polished grains, and processed foods(Reference Popkin2). Along with scarce physical activity, such a lifestyle could lead to the development of or the worsening of non-communicable diseases (NCD). In 2016, 78 % of all deaths in low- and middle-income countries were due to NCD. In fact, in low-income countries, around 21 % of the population between 30 and 70 years of age are expected to die from CVD, cancers, chronic respiratory diseases or diabetes(3).
These numbers demand bigger efforts in terms of health strategies and nutritional interventions in order to improve the population health status. Considering the huge role that dietary patterns can play, it is of utmost importance to understand quantitatively their impact in this group of diseases. However, in lower-middle-income countries, this work is scarce or insufficiently documented, probably due to a lack of resources and logistical constraints. The lack of reliable dietary assessment methodologies might be one of the major reasons that justifies this absence of nutritional data(Reference Vila-Real, Pimenta-Martins and Gomes4,Reference Pisa, Landais and Margetts5) . Dietary intake studies in Kenya have been carried out by the application of 24-h recalls (24hR)(Reference Walton, Taylor and Vanleeuwen6–Reference Kamau-Mbuthia and Elmadfa12), either single or multiple, and in some occasions applied together with an FFQ(Reference Mbochi, Kuria and Kimiywe13–Reference Waudo, Tuitoek and Msuya15), mainly qualitative and over a 7-d period(Reference Vila-Real, Pimenta-Martins and Gomes4). Since a 24hR is time-consuming and does not cover a wide period, being insufficient to fully describe the usual intake, there is an emergent need for the development, validity and standardisation of tools for measuring and monitoring food intake. Hence, it is crucial to use a reproducible and valid tool, sensitive to the target population’s culture, in order to assure consistent, accurate, true and reliable measurements. FFQ has proven to generate good results for the assessment of dietary intake in large epidemiological studies, being a suitable tool to study the association between diet and disease(Reference Willet and Willet16).
Since there is no validated FFQ available for the target population under study, this research work aims to report in detail the process of development and testing for the validity and reproducibility of a semi-quantitative FFQ, culturally adapted to the urban adult Kenyan population and suitable for a dietary assessment during a 1-month period.
Methods
Study design and recruitment of participants
This cross-sectional study was carried out in Nairobi county (different constituencies), Kenya, and performed in two phases: phase 1, development of a semi-quantitative FFQ; phase 2, test for validity and reproducibility of the developed FFQ.
Phase 1: Development of a semi-quantitative FFQ
An FFQ intended to report dietary intake during the previous month was designed and constructed considering the food patterns of Kenyan urban adult population. A list of food items was compiled by accessing different sources and crossing it with information on generally consumed foods, namely different questionnaires applied in Kenyan and other African populations(Reference Mbochi, Kuria and Kimiywe13,Reference Sheehy, Kolahdooz and Mtshali17–Reference Merchant, Dehghan and Chifamba23) , thirty food records of Kenyan people obtained in a previous pilot study (not published), and Kenyan National Food Composition Tables. For the composite dishes included in the FFQ, recipes from native people, local restaurants and from the internet were collected and analysed in order to determine a standardised recipe. The compiled food list was evaluated by local nutritionists for further adaptation.
After preparing the food list, standard portion sizes were established. For packed foods sold as single units, a market survey and personal observations were conducted, and the most commonly consumed quantity was used as the standard portion. For unpacked foods sold as single units (e.g., fresh fruit), three samples of each (edible part) were weighed and the average weight was used as the standard portion. For composite dishes and cooked foods, three canteens, eleven residential houses and one restaurant were accessed to obtain several weight measurements. Consequently, the average value from all the measurements was used as the standard portion. To calculate the smallest and the largest portions, the standard portion was multiplied by the following factors: 0·75 and 1·5, respectively. During all the visits, pictures of portions were taken and used for the construction of a photographic food album. The methodological design for this phase is outlined in Fig. 1(a).
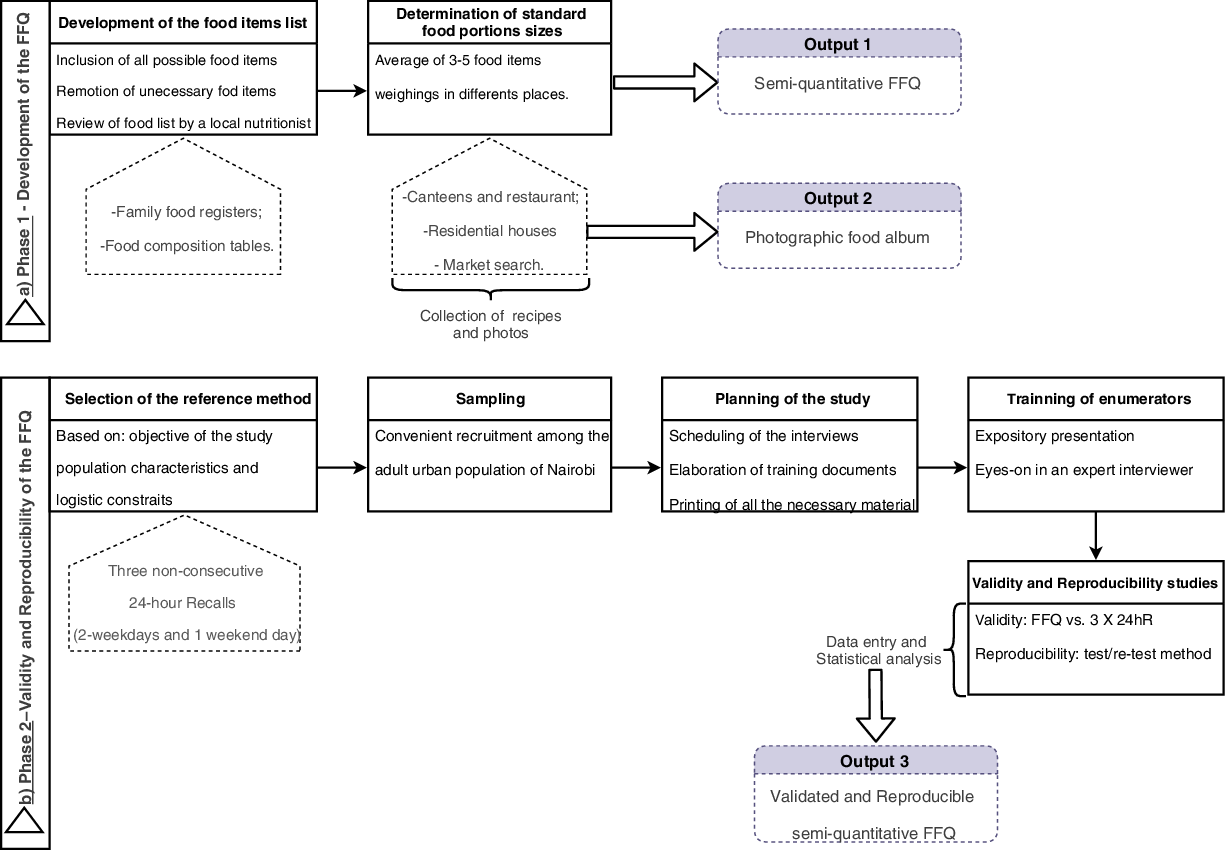
Fig. 1 Methodological design for the (a) development and (b) validation of a culture-specific semi-quantitative FFQ
Phase 2: Validity and reproducibility studies
To determine the relative validity of the developed FFQ, the results obtained by the application of the first FFQ were compared with those from the applied three non-consecutive 24hR. To test reproducibility, the FFQ was applied on two different occasions to the same group of people.
Several Kenyan volunteers were recruited. Each respondent was informed the objectives of the current study, and written informed consent, according to the Declaration of Helsinki of the World Medical Association, was obtained from those who agreed to participate.
Five interviewers from the University of Nairobi (UN) Department of Food Science, Nutrition and Technology with nutrition background were recruited. All the interviewers were given training and guiding documents in order to standardise the interviews, ensuring the quality of data to be obtained. The FFQ was written in English, and consequently, interviews were conducted in this language, one of the official languages, apart from Swahili. Casually, there was a need for translation to Swahili for some of the food items. The methodological design for this phase is outlined in Fig. 1(b).
Data collection
Data were collected by trained interviewers using structured questionnaires. The study protocol was composed of five interviews: in the first, the respondents answered a general questionnaire and the FFQ; in the next three interviews, the respondents were asked to recall dietary intake in the previous 24 h (the interviews were separated by a minimum gap of 2 d); in the fifth and last interview, the respondents answered, once again, the FFQ (the two FFQ were applied 21 d apart). All interviews were conducted by the same interviewer, trying to minimise inter-rater bias. The general questionnaire included questions about demographic data, anthropometrics, lifestyles and health status. In 24hR, the respondents gave detailed information about everything they ate and drank in the previous 24 h, from the time they woke up the day before until they woke up on the interview day. Every respondent was asked to recall 2 weekdays and 1 weekend day, aiming the dietary intake information to be as comprehensive as possible. During 24hR, to facilitate the estimation of food portion sizes, the interviewers used the developed photographic album. Every time the respondent mentioned a composite dish, an estimation of consumed ingredients or, in its absence, the quantities used during dish preparation was requested and registered whenever possible.
Data computation
Considering the FFQ, each food portion (weight in grams) was multiplied by the respective frequency of consumption and divided by the number of days corresponding to the frequency of consumption in order to estimate daily consumptions of each food item. All the food items of the FFQ and 24hR were coded, resorting to the Food Processor® software, version SQL 11.0.3 (ESHA Research), which includes US Department of Agriculture’s Food and Nutrient Database for Dietary Studies, Canadian Nutrient File and UK Foods database along with manufacturer and restaurant data. In order to better choose the most adequate code for each food within the range of existing items in Food Processor®, a comprehensive and detailed comparison between the nutritional compositions in Food Processor® and the foods consumed in Nairobi (by assessing Kenyan Food Composition Tables) was performed by two nutritionists. When a food item was absent in the software or the nutritional composition of the Kenyan native food was different, data from the Kenyan Food Composition Tables were used to supplement Food Processor®. The recipes of composite dishes, obtained from native Kenyans, were also added to Food Processor® software. These codes were organised in a codification manual and used for the conversion of foods into nutrients. This manual was constructed to warrant the systematisation of questionnaire codification. Information from the FFQ was introduced in a Microsoft Access® database, and information from 24hR was introduced into the Food Processor®. Resulting nutrient information from both databases was exported to Microsoft Excel® for further statistical analyses.
Statistical analysis
A power calculation was performed for sample size determination. Statistical power was established as 90 %, two-sided significance level as 0·05 and correlation of 0·4 was based on previous validity studies. The combination of those indicated a minimum sample of sixty respondents. Considering a dropout rate of 20 %, researchers set a sample size of seventy-five individuals. Descriptive data were calculated as frequencies (%) and presented as means and standard deviations for normally distributed variables. The Kolmogorov–Smirnoff test was used to study the variables’ distribution normality. In order to determine absolute nutrient intakes, estimated for both methods, medians and quartiles were calculated, rather than means and standard deviations, mainly to avoid major influences of extreme intakes. The Wilcoxon test was used to compare medians of absolute nutrient intakes estimated for both methods in the validity study and for both applications of the FFQ in the reproducibility study.
The correlation between FFQ (FFQ1) and the mean of three 24hR was studied by calculating unadjusted, energy-adjusted and deattenuated Spearman’s correlation coefficients. Nutrients’ energy adjustment was conducted using the residual method(Reference Willet and Willet16). Deattenuated correlation coefficients were used to adjust for random within-subject variability in three 24hR(Reference Willet and Willet24). Ranking agreement between the FFQ and 24hR was quantified as a percentage of subjects who were categorised in the same (complete agreement) and/or adjacent and in the opposite nutrient quartiles (extreme disagreement). Bland–Altman plots(Reference Martin Bland and Altman25) were also examined for each nutrient.
To evaluate the reproducibility of the FFQ, the correlation between the two applications was studied by calculating unadjusted and energy-adjusted Spearman’s correlation coefficients. Moreover, intra-class correlation (ICC) coefficients between both FFQ were calculated. Statistical analyses were conducted using IBM® SPSS® Statistics, version 23 (SPSS Inc., Chicago, IL, USA).
Results
Phase 1: Development of the semi-quantitative FFQ
The final food list had 123 food items distributed over eleven food groups (namely cereals and grain products; vegetables; legumes, pulses, seeds and nuts; fruits; meat, fish and eggs; dairy products; fats and oils; sauces, seasonings and flavourings; sugar, syrups, sweets and snacks; beverages; composite dishes). Three portion size options were established – the standard portion, a smaller and a bigger portion – using the standard portion size as comparison term. The frequency of consumption was recorded in nine pre-specified categories from ‘never or less than once per month’ to ‘six or more times per day’, as suggested by Willet(Reference Willet and Willet16).
Phase 2: Validity and reproducibility studies
Subjects
A total of seventy-five volunteers took part in the current study: thirty-five from the UN Kabete Campus, ten from a residential area in Uthiru (Dagoreti South constituency) and thirty from the UN Main Campus (Starehe constituency). For the validity study, it is not imperative to obtain a representative sample; however, it is advisable that it be heterogeneous in order to represent different food consumption patterns(Reference Willet and Willet16). Consequently, young, middle-aged and older women and men were included, and the job category was used as a proxy for socioeconomic status.
Of the seventy-five participants enrolled in the current study, a total of seventy-one (94·7 %) completed the three recalls, three (n 3, 4 %) only completed two recalls and one FFQ, and one (n 1, 1·3 %) did not complete any recall. These latter respondents were therefore excluded from the final sample. Furthermore, respondents who had a daily dietary intake >20 920 kJ (n 3, 4·2 %) were considered outliers and, consequently, were also excluded. For the validity study, the final sample was composed of sixty-eight (90·7 %) respondents, and the first applied FFQ was used to be tested against the three recalls. In the case of reproducibility study, data from the first and last interviews (first and second application of the FFQ) were analysed. Besides the previously mentioned individuals with daily intake >20 920 kJ (n 3), four other individuals did not reply to the second FFQ and, consequently, were also excluded. The final sample for the reproducibility study included sixty-eight (90·7 %) participants. Data collection took place in April 2016.
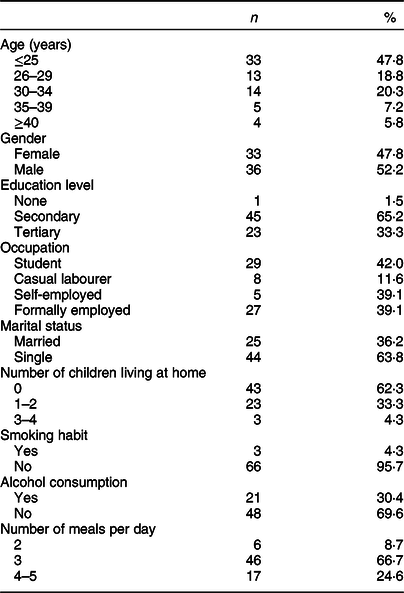
The sociodemographic profile of participants (n 69), in both validity and reproducibility studies, is presented in Table 1 (sixty-seven participants were common to both studies; in what concerns the other two from the sixty-nine, one only participated in the validity study and the other only in the reproducibility study). The mean age of the sample was 27·7 ± 7·7 years, with 48 % being women (n 33) and 52 % being men (n 36). At the time of interview, 46 % (n 32) of respondents had a job (self-employed or employee), while the other 54 % (n 37) were students or casual labourers. More than half (62 %, n 43) of participants had no children under their care at home. According to lifestyle habits, almost the whole sample (96 %, n 66) reported to be a non-smoker; however, 30 % claimed to be regular consumers of alcoholic beverages (18 % (n 6) of women and 42 % (n 15) of men). More than half of respondents (67 %, n 46) ate three meals a day, namely breakfast, lunch and dinner.
Table 1 Characteristics of participants in both studies (validity and reproducibility) (n 69) by the application of the general questionnaire
Validity study
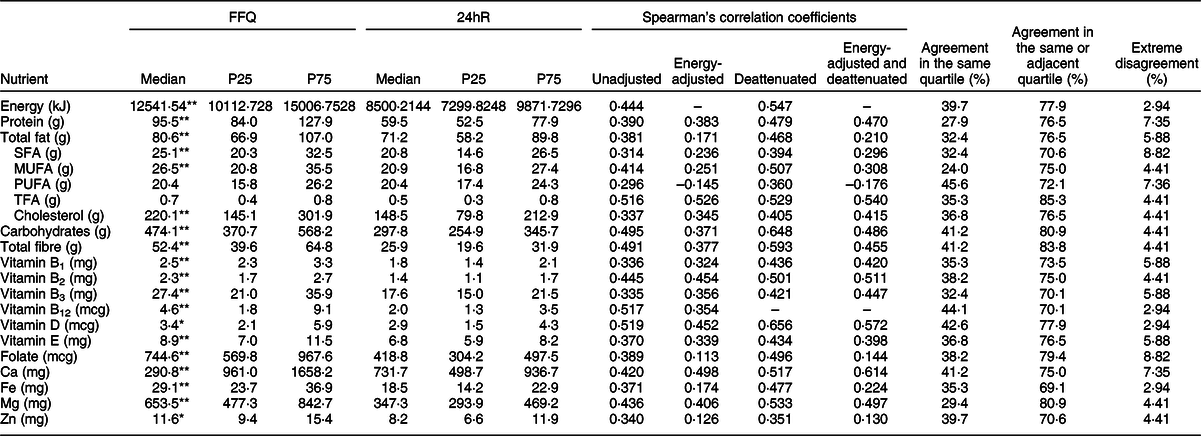
Table 2 shows a comparison between absolute daily nutrient intakes estimated by the first semi-quantitative FFQ and by the three non-consecutive 24hR. Intakes are expressed in medians, 25th and 75th percentiles. For almost all nutrients, the FFQ resulted in higher values compared with the mean value of three recalls. Values were similar only for total fat, PUFA, trans-fatty acids (TFA) and vitamin D.
Table 2 Absolute daily nutrient intakes estimated by the semi-quantitative FFQ and three non-consecutive 24-h recalls (24hR), Spearman’s correlation coefficients (for unadjusted and energy-adjusted and deattenuated values) and level of agreement and disagreement between both methods (FFQ and 24hR) (n 68)
SFA, saturated fatty acids; MUFA, monounsaturated fatty acids; PUFA, polyunsaturated fatty acids; TFA, Trans-fatty acids.
Median values were significantly different from those estimated from repeat recalls: *P < 0·05, **P < 0·001; P-values were calculated using the non-parametric Wilcoxon signed-rank test.
Spearman’s correlation coefficients (unadjusted, energy-adjusted and/or deattenuated) between both methods are also shown in Table 2. For all macronutrients, the unadjusted correlations were >0·38. Vitamin B12, vitamin D, TFA, carbohydrates and total fibre were the nutrients with higher crude correlation coefficients (0·52, 0·52, 0·52, 0·50 and 0·49, respectively). When energy-adjusted, these correlations tended to decrease. However, for some nutrients the correlation factor slightly increased, namely for TFA (from 0·52 to 0·53), cholesterol (from 0·34 to 0·35), vitamin B3 (from 0·34 to 0·36) and Ca (from 0·42 to 0·50). The adjustment for random within-person day-to-day intake variation in recalls made the coefficients increase (unadjusted v. deattenuated and energy-adjusted v. energy-adjusted and deattenuated). Energy-adjusted and deattenuated coefficients ranged between 0·130 (Zn) and 0·614 (Ca). For macronutrients, these values were higher, with the exception of fat. The analysis of Bland–Altman plots made possible to recognise that the agreement for energy [Fig. 2(a)], carbohydrate [Fig. 2(b)], total fibre [Fig. 2(c)], total fat [Fig. 2(d)] and PUFA [Fig. 2(e)] was moderate.
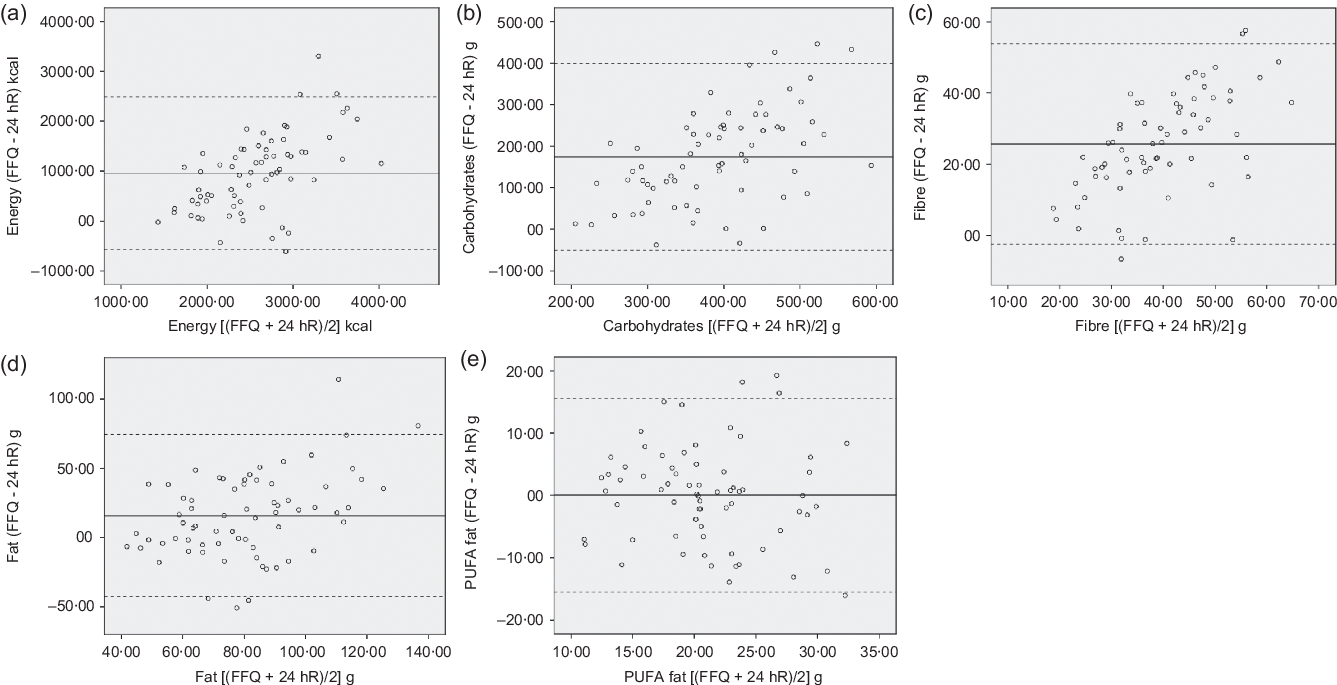
Fig. 2 Bland–Altman plot between FFQ and three non-consecutive 24-h recalls estimating total energy intake: (a) total energy, (b) carbohydrates, (c) total fibre, (d) total fat and (e) polyunsaturated fat. The solid line represents the mean difference in absolute intake between the two methods, and the dashed lines represent the limits of agreement (mean ± 1·96 × sd of the difference)
The levels of agreement in the same quartile, adjacent quartiles and extreme disagreement were also deeply studied and are expressed in Table 2. According to the results for envisaged nutrients, on average, 36·7 and 75·9 % of participants were classified into the same quartile (the values ranged from 24·0 % for MUFA to 45·6 % for PUFA) and into the same or adjacent quartiles (85·3 % for TFA and 69·1 % for Fe). Only 5·2 % were classified in opposite quartiles (2·94 % for energy, vitamins B12, vitamin D and Fe, and 8·8 % for folate and SFA).
Reproducibility study
In general, the participants tended to report higher intakes in the first application of the FFQ. In terms of the studied nutrients, crude Spearman’s correlations were high, reporting an average value of 0·62 (ranging between 0·37 for vitamin D and 0·70 for Ca). Adjustments for total energy tended to decrease correlations, ranging between 0·15 for PUFA and 0·65 for niacin (vitamin B3). ICC coefficients ranged between 0·166 for vitamin B12 and 0·704 for Mg. The correlations observed for macronutrients were all >0·6. Table 3 shows a comparison between absolute daily nutrient intakes estimated by the first application and the second application of the semi-quantitative FFQ.
Table 3 Absolute daily nutrient intakes estimated by the first (FFQ1) and second (FFQ2) applications of the semi-quantitative FFQ, Spearman’s correlation coefficients (for unadjusted and energy-adjusted values) and intra-class correlation coefficients (FFQ1 and FFQ2)

SFA, saturated fatty acids; MUFA, monounsaturated fatty acids; PUFA, polyunsaturated fatty acids; TFA, Trans-fatty acids.
Median values were significantly different from those estimated from FFQ2: *P < 0·05, **P < 0·001; P-values were calculated using the non-parametric Wilcoxon signed-rank test.
In order to organise the collected information from the current study, details on previous studies that tested the validity of the FFQ among adults were explored, and the results of this exploitation are presented in the Appendix in online supplementary material.
Discussion
The present article reports the findings of this cross-sectional study involving the development, validity and reproducibility studies of a 123-food-item semi-quantitative FFQ carried out among urban adult Kenyans. Overall, the FFQ was shown to be reproducible and valid, standing out as a valuable tool to rank individuals according to dietary intake.
Development of the FFQ
In the first phase, the authors considered the need to develop a well-established food list. Long lists might cause boredom on participants; however, they have to be comprehensive enough to include the most common items. The researchers selected food items based on three important aspects: the items had to be usual for a significant number of people; the items had to be nutritive; and to be discriminating, their consumption had to vary from person to person(Reference Willet and Willet16). The frequency response section was circumscribed to nine categories in order to discriminate between highly consumed and less consumed items and to avoid loss of information. In what concerns food portion information, the definition of a standard portion for each item tried to facilitate the process of describing quantities by participants. The food weighting study allowed the establishment of portion sizes in a way that subjects were able to conceptualise the unit and relate it to their own habits. This procedure was successfully achieved for most items; however, some challenges emerged and will be discussed below. Although the layout of the questionnaire was explicit by itself, and though liable to be self-administrated, the population under study had revealed some difficulties in clearly visualising the portion sizes and bearing in mind the period that was being covered in terms of consumption. Consequently, the research team found more reliable, feasible and ascertained to do face-to-face interviews.
Reproducibility study
In order to assess reproducibility, FFQ was applied twice, within a period of 21 d. This FFQ captured the consumption of the previous month, so ideally the second questionnaire should be applied 30 d apart, at maximum. The authors tried to maximise this interval in order to avoid memorisation problem between the first and second application. Nevertheless, memorisation was likely difficult due to the large number of food items in this FFQ.
According to the reported results, it is clear that the second administration provided lower intakes than the first FFQ, and consequently, these values were closer to those of 24hR. Other studies experienced the same, that is, during the first FFQ administration, respondents gave answers that resulted in higher intakes(Reference Jackson, Motswagole and Kwape22,Reference Silva-Jaramillo, Neutzling and Drehmer26–Reference Dehghan, del Cerro and Zhang28) . This might be explained by the acquisition of the ability to answer questions over time. According to Willet(Reference Willet and Willet16), the processing of diet recalling might modify consciousness of food intake and, consequently, improve accuracy in completing the questionnaire.
In the current study, crude Spearman’s correlations varied between 0·37 (vitamin D), the only nutrient that had correlations <0·50, and 0·70 (Ca). For macronutrients, the values were all >0·66, showing a good association. Adjustments for total energy tended to decrease correlations. Jackson et al. (Reference Jackson, Motswagole and Kwape22) and Mouratidou et al. (Reference Mouratidou, Ford and Fraser27) obtained results similar to those of the current study, except for vitamin D. In contrast, other studies revealed poorer correlations(Reference Mouratidou, Ford and Fraser29–Reference Gunes, Imeryuz and Akalin31). The studies of Papazian et al. (Reference Papazian, Hout and Sibai32) and Silva-Jaramillo et al. (Reference Silva-Jaramillo, Neutzling and Drehmer26) also resorted to ICC to evaluate the reproducibility of the FFQ; however, correlations from both research were higher than those observed in the current study. Nevertheless, ICC coefficients >0·6 showed that within-person variation was not very high, showing moderate reliability(Reference Koo and Li33).
Validity study
The developed FFQ presented higher nutrient intakes compared with multiple recalls, thus showing moderate agreement. According to Willet(Reference Willet and Willet16), such a difference observed between the two methods is common. Similar results were obtained by other investigators(Reference Jackson, Motswagole and Kwape22,Reference Silva-Jaramillo, Neutzling and Drehmer26,Reference Mouratidou, Ford and Fraser29,Reference Segovia-Siapco, Singh and Jaceldo-Siegl34,Reference Zack, Irema and Kazonda35) in the assessment of dietary intakes in adults. The main sources of errors in the FFQ and, consequently, the causes of overestimation are fixed list of foods, memory (medium-term memory, in this case), perception of portion sizes and interpretation of questions(Reference Willet and Willet16). In the current study, the authors felt that medium-term memory and perception of portion sizes were the main factors that affected the results. To clarify the portion sizes to respondents, it could have been possible to show them the developed photographic food album used for recalls. However, there is no clear evidence that using photographs during the application of FFQ would improve correlations significantly(Reference Willet and Willet16,Reference Paiva, Amaral and Barros36) . Besides, the time spent in an interview using a photographic album would also have been longer, which could have been critical for this study, considering the limited schedule and resources.
It has been observed that the more recalls are made, the lesser the difference between intakes from the questionnaire and recalls(Reference Willet and Willet16). Based on this fact, it would be clear that increasing the number of recalls would improve the correlation between both methods. However, the study of Papazian et al. (Reference Papazian, Hout and Sibai32), where one recall was obtained to validate the FFQ, revealed correlation coefficients to be not so different compared with those obtained by other studies where more recalls were conducted. The range of unadjusted Spearman’s correlations of the current study was similar to that obtained in other studies with analogously applied methodology(Reference Jackson, Motswagole and Kwape22,Reference Silva-Jaramillo, Neutzling and Drehmer26,Reference Mouratidou, Ford and Fraser27,Reference Athanasiadou, Kyrkou and Fotiou37) . However, other researchers reported better(Reference Cheng, Yan and Dibley30,Reference Papazian, Hout and Sibai32) and worse(Reference Dehghan, del Cerro and Zhang28,Reference Gunes, Imeryuz and Akalin31) results compared with the current study. Among these, only the study of Jackson et al. (Reference Jackson, Motswagole and Kwape22) was conducted in Africa, specifically in Botswana, which confirms the region’s poorness in these types of studies. When analysing energy-adjusted Spearman’s correlations, only TFA, cholesterol, vitamins B2, B3 and Ca increased. Some studies also experienced improvements (when energy-adjusted) in protein(Reference Jackson, Motswagole and Kwape22,Reference Mouratidou, Ford and Fraser27) , fibre(Reference Jackson, Motswagole and Kwape22) and micronutrients correlations(Reference Jackson, Motswagole and Kwape22,Reference Silva-Jaramillo, Neutzling and Drehmer26,Reference Mouratidou, Ford and Fraser29,Reference Cheng, Yan and Dibley30,Reference Papazian, Hout and Sibai32) , especially for Ca, Fe and vitamin E. This shows that the process of validity is not straightforward, being challenging the obtention of high correlations. Deattenuation adjustment showed a general improvement of coefficients (unadjusted or energy-adjusted), meaning that the contribution of within-person error was considerable. This might be justified by the non-monotonous diet of urban Kenyans, not necessarily in terms of the type of foods, but especially in quantities and number of meals per day. Although correlations are the most commonly used method, they have some limitations since they do not study the agreement of both methods, but only if they are associated. Thus, other statistical approaches, such as the Bland–Altman method, were followed. These plots assess the agreement between methods across a range of intakes(Reference Martin Bland and Altman25,Reference Cade, Thompson and Burley38) . According to the plots presented in the current study, it is possible to recognise that the agreement for energy [Fig. 2(a)], carbohydrate [Fig 2(b)] and fibre [Fig. 2(c)] was only moderate. By analysing the plots, it is possible to conclude that for lower intakes, the difference between both methods was smaller compared with higher intakes, whose difference seemed to be larger. The overall mean difference corroborated the first conclusions since it was clear that there was an overestimation of the FFQ against the recalls. However, for total fat, the agreement between both methods was better [Fig. 2(d)], especially for PUFA [Fig. 2(e)], for which although the correlation coefficient for energy adjustment was very weak, the Bland–Altman diagram showed a good agreement between both instruments. Observing the plot, the difference between both methods in terms of lower intakes v. higher intakes was not so notorious. Moreover, for this nutrient, the agreement into the same quartile was also high, as mentioned above.
Some limitations should be considered when interpreting the present results. Regarding the reproducibility study, the authors recognise that the period between interviews was short. It would have been more adequate to spread the interviews slightly more; however, this was not achievable within the timeframe and resources available for the study. Concerning the validity of the FFQ, three non-consecutive recalls were used to validate the questionnaire; however, other methods could have been hypothesised, for example, food records or even biomarkers. According to other investigations, they observed better agreement with FFQ(Reference MacIntyre, Venter and Vorster39). All methods have their own limitations and sources of errors. Besides, in some circumstances, the study population or the study site does not allow the implementation of an ideal method for comparison, which would lead to the choice of a less effective or appropriate method. In the present case, participants’ illiteracy and poor motivation made multiple 24hR the only reasonable choice. Additionally, the research team recognises the likely source of correlated errors by the usage of the same food software for the analysis of nutrient intakes. Considering the application of both tools, the interviewers found it difficult for respondents to estimate the consumed amount in certain types of foods. ‘Vegetables’ was the food group that carried more challenges, mainly because Kenyan people do not eat a single vegetable at a time, but a mix of several types. Moreover, the estimation of meat (mainly beef and pork) was difficult in some cases, mainly because meat is not commonly eaten in large pieces such as beef, but in small pieces, in mixed preparations. Consequently, this hindered portion size estimation. Nevertheless, meat is not a major component of the main course, and so, this might not have influenced intake estimation that much. Another particularity in Kenya is that in some places, even in urban areas, people share a big plate, or a bowl, which makes portion size estimation a challenge.
Considering the scarcity of tools to assess dietary intake in African populations, the authors consider that this is a valuable contribution to future studies. The tool comprises a huge list of foods and is possible to be completed in a 25–30-min interview, avoiding respondents’ lack of patience and, consequently, inaccuracy in dietary assessment. This validated tool might be used to rank individuals according to their nutrient or food intake in order to further study its association with disease development or prevalence.
Conclusions
A comprehensive procedure was followed with the aim of developing a culturally adapted semi-quantitative FFQ. Although it tends to overestimate intakes, and for that reason, it might not be a precise instrument to measure absolute intakes, this FFQ is clearly a valuable tool for ranking individuals according to their nutrient intake. Consequently, this developed FFQ plays an important role in the identification of risk groups for diet-related diseases. Nonetheless, this dietary tool can be used as a basis for future dietary surveys as it is, making it, as far as the authors know, the only validated questionnaire adapted to the Kenyan culture. The developed tool was specially designed for urban adult Kenyans, making it an appropriate instrument since it is culturally adapted to this population. In conclusion, the developed FFQ is a valid and reproducible tool that can be applied in future epidemiological studies to accurately rank urban adult Kenyans according to their dietary intake as well as allow investigations into the associations of diet with risk of disease in urban Kenya.
Acknowledgements
Acknowledgements: The authors would like to thank all the participants of the current study. They are also grateful to the entire research team, and to Filipe Pereira for support in database construction and data extraction. Financial support: This work was supported by National Funds from FCT, ‘Fundação para a Ciência e a Tecnologia’, through project ‘Optimisation of fermentation processes for the development of fibre-rich cereals-based products: promotion of fibre intake in Africa and Europe’ (ERA-AFR/0002/2013 BI_I) and the doctoral grant SFRH/BD/133084/2017 – ‘Dietary fibre intake and tailored fermentation toward the development of functional cereal fibre-rich food products: bridge between Africa and Europe’. This work was supported by National Funds from FCT through project UID/Multi/50016/2019. Conflicts of interest: There are no conflicts of interest. Authorship: The authors’ contributions are as follows: C.V.-R., A.P.-M., E.P., A.G., N.H.M. and K.K. contributed to study design. C.V.-R. and J.S.M. contributed to data collection for both phases. C.V.-R. conducted the fieldwork, computed and analysed data and wrote the manuscript. E.P. and A.G. also contributed to the decision-making process during data collection, interpretation of findings, data analyses and writing of the manuscript. C.K. and S.M. facilitate the selection of interviewers and fieldwork logistics and contributed to the decisions regarding food list. All authors read and approved the final version of the manuscript. Ethics of human subject participation: The current study was conducted according to the guidelines laid down in the Declaration of Helsinki, and all procedures involving research study participants were approved by the Institute for Bioethics, Catholic University of Portugal. Written informed consent was obtained from all subjects.
Supplementary material
For supplementary material accompanying this article visit https://doi.org/10.1017/S136898002000169X


