


Misreporting, mostly under-reporting, of dietary intake is a generally known problem in nutritional research and has been shown to affect estimates based on diet assessment methods, including FFQ, 24 h recalls (24hR), food records and the duplicate portion method (DP)( Reference Crispim, Geelen and De Vries 1 – Reference Stockley 5 ). Identifying the determinants associated with misreporting of dietary intake may help to facilitate the adjustment of dietary assessment methods and the development of correction methods. A large body of evidence has demonstrated that various determinants, such as a higher BMI, gender, being of older age and smoking, are associated with under-reporting of energy intake. The identified determinants depended on the research question and type of analysis, the population studied and the availability of different sets of determinants in the studies( Reference Maurer, Taren and Teixeira 6 , Reference Livingstone and Black 7 ).
To assess the degree of misreporting of energy intake, energy expenditure measured by the doubly labelled water method (DLW), a recovery biomarker, is the preferred reference method( Reference Willett 8 ). The method assumes that participants are in energy balance. Other recovery biomarkers are available for a limited number of nutrients, including protein, K and Na( Reference Willett 8 , Reference Jenab, Slimani and Bictash 9 ). However, relatively few studies have addressed the associations of determinants with misreporting of these nutrients( Reference Freedman, Commins and Moler 2 , Reference Freisling, Van Bakel and Biessy 10 – Reference Freedman, Commins and Moler 13 ). Having a high BMI was consistently associated with under-reporting of energy and nutrients for different dietary assessment methods( Reference Freisling, Van Bakel and Biessy 10 , Reference Mossavar-Rahmani, Shaw and Wong 11 , Reference Briefel, Sempos and McDowell 14 – Reference Price, Paul and Cole 17 ). Results for gender did not always point in the same direction: under-reporting of energy intake was found to be more prevalent in women than men for 24hR( Reference Briefel, Sempos and McDowell 14 , Reference Novotny, Rumpler and Riddick 18 ), and under-reporting of energy assessed by FFQ was higher in men( Reference Bedard, Shatenstein and Nadon 19 ). Having a lower level of education( Reference Tooze, Subar and Thompson 16 , Reference Bedard, Shatenstein and Nadon 19 ) and being older( Reference Briefel, Sempos and McDowell 14 , Reference Bedard, Shatenstein and Nadon 19 ) were also associated with under-reporting of energy intake for both FFQ and 24hR. Other determinants reported to be associated with energy misreporting by 24hR include, but are not limited to, body fatness( Reference Novotny, Rumpler and Riddick 18 , Reference Johnson, Soultanakis and Matthews 20 ), smoking status and physical activity level( Reference Briefel, Sempos and McDowell 14 ). Although studies investigating misreporting include different sets of determinants, usually BMI, gender, age and level of education (or another indicator of socio-economic status) are included; we refer to these determinants as the ‘basic determinants’. To our knowledge, determinants associated with misreporting have not been studied for the DP method before.
We aimed to assess the associations of the basic determinants (BMI, gender, age and education level) with misreporting of energy, protein and K for three dietary assessment methods: FFQ, 24hR and DP. Our secondary aim was to additionally assess the associations of a number of selected determinants with misreporting of the same nutrients for these dietary assessment methods. We included a set of explorative determinants including BMI-related determinants, as BMI is strongly associated with misreporting, and other personal characteristics (Table 1). The recovery biomarkers for energy, protein and K were used to assess the degree of misreporting.
Table 1 Classification of the determinants related to misreporting of energy, protein and potassium intake used in the present study

EDU, education level; BW, body weight; MET, metabolic equivalents of task; DXA, dual-energy X-ray absorptiometry.
Materials and methods
Participants and design
The recruitment and procedures of the DuPLO study, which was conducted between July 2011 and July 2014, are described elsewhere( Reference Trijsburg, de Vries and Boshuizen 21 ). Briefly, a sub-sample of 200 Dutch adults (ninety-two men, 108 women) from the NQPlus study, aged 20–70 years and living in the surroundings of Wageningen, the Netherlands, were recruited. Baseline measurements consisted of, among others, a physical examination including weight and height, general questionnaires (including questions about education, health and smoking habits), and lifestyle and psychosocial questionnaires. For the data analyses in the DuPLO study, we used data from the NQPlus study, and collected additional data in the same participants. Data of the NQplus study were collected within a time frame of 1 year and consisted of two self-reports by FFQ (~7 months apart), two urine samples (~1 year apart) and the first two collected telephone-based 24hR (~7 months apart). For the DuPLO study, which started after the NQPlus study, two DP (~5 months apart) were collected from each participant and energy expenditure was assessed by the DLW method, once for seventy participants (thirty-seven men, thirty-three women) and twice for thirty participants. Eventually all measurements were collected within a time frame of 1·5 years.
Dietary intake assessment
An extended description of the dietary intake assessment is presented elsewhere( Reference Trijsburg, de Vries and Boshuizen 21 ). In short, the 24hR was administered by trained dietitians following a standard protocol based on the five-step multiple-pass method( Reference Conway, Ingwersen and Vinyard 22 ). The 180-item FFQ( Reference Siebelink, Geelen and De Vries 23 , Reference Streppel, De Vries and Meijboom 24 ) was self-administered using the open-source online survey tool LimesurveyTM (LimeSurvey Project Team/Carsten Schmitz, Hamburg, Germany, 2012). The Dutch food composition database of 2011( 25 ) was used to calculate energy, protein and K intakes from the 24hR and FFQ.
For the DP all foods and drinks consumed over a 24 h time period were collected by the participants and weighed, homogenized and stored until further analysis by the researcher. On the day of the 24 h urine collections, participants were instructed to ingest three 80 mg tablets of p-aminobenzoic acid (PABA) to check for urine completeness. At the research centre urines were mixed, weighed and aliquoted, and stored at −20°C until further analyses.
Laboratory measures
N was assessed with the Kjeldahl technique( Reference Hambleton and Noel 26 ) in both DP and urine. The amount of protein was calculated using an N to protein conversion factor of 6·25( Reference Jones 27 ) and an average ratio of urinary N excretion to dietary N of 0·81( Reference Bingham and Cummings 28 ) was assumed. K in urine was determined with an ion-selective electrode and intake was calculated taking into account extra-renal and faecal losses of 19 %( Reference Freisling, Van Bakel and Biessy 10 ). PABA in urine was assessed by the HPLC method; based on the cut-off value of 78 % PABA recovery( Reference Jakobsen, Ovesen and Fagt 29 ), 70 % of the urines were considered complete. Incomplete urines were not excluded from the analysis, but the measure for PABA completeness (complete=0 and incomplete=1) was included as a covariate in the linear regression model. K in the DP was determined, after digestion of the samples in polytetrafluoroethylene tubes using a MarsXpress microwave digestor (CEM, Matthews, NC, USA), by inductively coupled plasma–atomic emission spectroscopy (Varian Australia Pty Ltd, Mulgrave, Australia). The fat content of the DP was assessed by the acid hydrolysis method( Reference Horwitz 30 ), ash by heating the freeze-dried food in a muffle furnace at 550°C( Reference Osborne and Voogt 31 ), alcohol by GC( Reference Klee and Meng 32 ) and the moisture content was assessed by drying in a vacuum oven( Reference Osborne and Voogt 31 ). We assumed water, ash, fat, protein, alcohol and total carbohydrates (including dietary fibre) summed up to 100 % of the total weight of the DP( 33 ). Total carbohydrates were calculated by difference( Reference Siebelink, de Vries and Trijsburg 34 ). Energy content of the DP was subsequently calculated from the total amount of protein, fat, total carbohydrates (including dietary fibre) and alcohol using the general Atwater factors for these nutrients: 17, 37, 17 and 29 kJ/g, respectively.
Total energy expenditure for each participant, covering an 11 d period, was assessed by the DLW method using the two-point protocol( 35 ). Total energy expenditure was calculated using the modified Weir equation( Reference Weir 36 ) where the respiratory quotient was assumed to be 0·85. A detailed description of the DLW protocol can be found elsewhere( Reference Trijsburg 37 ).
Determinants
Physical measurements
Physical measurements were done at baseline by trained research assistants following a standardized protocol. Height was measured to the nearest 0·1 cm without shoes with a stadiometer (Seca, Hamburg, Germany). Weight was measured with empty pockets and without shoes and sweaters to the nearest 0·1 kg on a digital scale (Seca). BMI was calculated by dividing weight (in kilograms) by the square of the body height (in metres). Body fat percentage was measured by dual-energy X-ray absorptiometry scan (Lunar Prodigy; GE Healthcare, Madison, WI, USA). Quality assurance measurements for dual-energy X-ray absorptiometry were performed daily to ensure scanner reliability. In the case that the participant’s body did not fit the outline of the scanner (n 1), the scan results of the right side of the body were used to estimate body composition of the body’s left side. In a sub-sample (n 27), body fat percentage was measured using a body composition analyser (model BC418MA; Tanita Corporation) instead.
General questionnaire
Participants were contacted by email and asked to complete questionnaires online using the open-source survey tool LimesurveyTM. The general questionnaire administered at baseline included questions about age, gender, household composition, current and previous smoking habits, dieting habits, opinion about body weight, highest and lowest weight in the past 5 years and education level. Never smokers were those who had not smoked in the past month and never smoked for a full year. Participants who smoked in the past month or ever smoked for a full year and did not stop smoking were classified as current smokers. Participants who ever smoked for a full year, but had not smoked in the past month and stopped smoking were classified as former smokers. Participants with no education or primary or lower vocational education as highest completed education were classified as having a low education level. Participants who completed lower secondary or intermediate vocational education were classified as having an intermediate education level and participants with a high education level were those who completed higher secondary education, higher vocational education or university.
Physical activity
Physical activity was assessed by accelerometer, the triaxial GT3X or triaxial GT3X+ (ActiGraph, Pensacola, FL, USA), and expressed in metabolic equivalents of task (MET) per day. Participants wore the accelerometer for seven continuous days on their hip and kept a record of daily activities. ActiLife software version 6.7.3 (ActiGraph) was used to assess daily MET scores with the equation developed by Swartz et al.( Reference Swartz, Strath and Bassett 38 ).
Perceived Stress Scale
The Perceived Stress Scale (PSS) measures the degree to which situations are considered stressful. The PSS asks about feelings and thoughts in the last two weeks( Reference Cohen, Kamarck and Mermelstein 39 ). Within the present study, the four-item version of the PSS (i.e. the PSS4) was used. A total PSS4 score was derived by reversing the scores of the two positively stated items and then summing across all four items (range 0 to 16). The internal consistency of the PSS4 has been found acceptable (α=0·72) and the test–retest reliability was fair (0·55)( Reference Cohen, Kamarck and Mermelstein 39 ).
Dutch Eating Behaviour Questionnaire
The Dutch Eating Behaviour Questionnaire (DEBQ) ranks participants on a scale of 1 to 5 on three eating styles: (i) restrained eating, i.e. conscious restriction of food intake; (ii) emotional eating, i.e. eating resulting from negative moods; and (iii) external eating, i.e. eating as a response to the smell or sight of food( Reference Van Strien, Frijters and Bergers 40 ). The questionnaire comprises thirty-three statements to be rated on a 5-point scale. The mean of the total score for each eating style was taken and used for the analysis. The DEBQ was found to successfully identify the three dimensions of eating style in clinical and non-clinical groups( Reference Wardle 41 ).
Nutrition Behaviour Questionnaire
Based on the theory of planned behaviour and the transtheoretical model, a questionnaire was developed to assess self-identity, knowledge and perceived barriers for healthy eating in general as previously described( Reference Hooft van Huysduynen 42 ). In short, for self-identity the mean score of three statements about one’s identification to be a healthy eater, with answering scales ranging from 1 to 7, was used. Knowledge was assessed by two types of questions, the first set consisted of statements about the Dutch dietary guidelines for a healthy diet of 2006 and the second set asked participants to select the healthier choice from pairs of foods. For each correct answer the participants received 1 point and the sum score ranged from 0 to 17 points. Perceived barriers were assessed by thirteen statements related to barriers for healthy eating on a 7-point scale. Mean scores ranging from 1 to 7 were used in the current analysis.
Statistical analysis
In total, 197 out of the 200 participants were included for analysis of protein and K misreporting, ninety-one men and 106 women. Two participants became pregnant during the study. As it was expected that they changed their habitual dietary intake, they were excluded from analysis. One participant did not collect urine samples and was therefore also excluded from analysis. Furthermore, DLW energy expenditure data of one participant were excluded because of physiologically implausible body water changes between repeated measurements while body weight remained stable. Thus, data of thirty-seven men and thirty-two women were included in the analysis of energy misreporting. Data were approximately normally distributed on the original scale. Participants with missing data for one or more of the methods were included in the analysis because they provided information for the other dietary assessment methods. In the tables N represents the number of participants included in the analysis for the specific dietary assessment method. Multiple imputations were used to impute missing determinant data. Ten sets of imputed data were generated and the results from the ten analyses were combined using the standard pooling rules. The highest percentage of missing data was 15·2 % for the variable 5-year weight difference.
Misreporting on the group level was calculated as the intake assessed by a single measurement of DP, 24hR or FFQ minus the mean of two measurements of the recovery biomarkers for protein, K or energy (where for DLW, for forty participants, only one measurement was available). This was done for both measurements of DP, 24hR and FFQ separately. Following this the mean of the two biases was reported for DP, 24hR and FFQ. The percentage bias was calculated by taking the mean of the bias percentages at the individual level. A Student’s paired t test between the mean of the recovery biomarkers and the mean of the two intakes based on FFQ, DP or 24hR was performed to test for statistical significance of misreporting. Descriptive statistics are presented as percentages and as means with their standard deviations.
Linear regression analysis was performed to relate the basic determinants (BMI, gender, age and education level) and an intercept, all in one model, to the bias; that is, the difference between reported intake by DP, 24hR or FFQ and estimated intake based on the biomarker for energy, protein and K intake. For education two dummies were included in the model. Recovery of PABA (complete yes or no) was included in all models for protein and K as a methodological factor related to the urine collection. Next, the explorative determinants were added to this multiple linear regression model, one at a time. For smoking, two dummies indicating formerly or currently smoking were simultaneously included in the model. To test for interaction between gender and body fat, the model including the basic determinants and the interaction term for gender and body fat was run. All statistical tests were performed using the statistical software package SAS version 9.3.
Results
Baseline characteristics of the study population
The participants had a mean age of 55·8 (sd 10·1) years and a mean BMI of 25·1 (sd 3·7) kg/m2 (Table 2). Slightly more women were enrolled (53·8 %) than men and 52·8 % of the participants completed a high level of education while 18·8 % had a low level of education.
Table 2 Baseline characteristics of the study participants (n 197) aged 20–70 years from Wageningen, the Netherlands
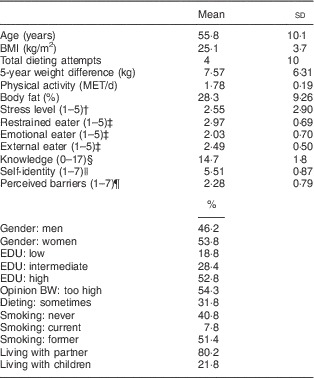
MET, metabolic equivalents of task; EDU, education level; BW, body weight.
† A higher stress score means the perceived stress is higher.
‡ A higher score on restrained, emotional or external eating means the eating behaviour of the person is leaning more to the specific eating pattern.
§ A higher score on knowledge means the person has a higher knowledge about healthy eating.
|| A higher score on self-identity means the person identifies him-/herself with eating healthily.
¶ A higher score on perceived barriers means the perceived barriers for eating healthily are higher.
Baseline values of the explorative BMI-related determinants showed that 54·3 % of the participants judged their body weight as too high. Almost one-third (31·8 %) of the participants had followed a weight-loss diet, and reported on average four attempts to follow such a diet. Furthermore, the self-reported maximum weight difference within the previous 5-year period was 7·6 kg. The mean physical activity level was 1·78 (sd 0·19) MET/d and participants had on average 28 % body fat. Mean PSS4 scores and the scores on the DEBQ (restrained, emotional or external eater) were fairly average (about 2·5), and participants on average answered fifteen out of seventeen questions correctly regarding knowledge about healthy eating. Furthermore, 7·8 % of participants were currently smoking. Most participants were living with a partner (80·2 %) and 21·2 % lived with children.
Misreporting of energy, protein and potassium intake
All dietary assessment methods statistically significantly underestimated the intake of energy, protein and K based on comparison with the biomarker (Table 3). Energy and protein were underestimated by approximately 20 %, except for protein assessed by the 24hR, which was underestimated by 12 % (averages of individual biases as percentage). K intake was underestimated to a smaller extent: 6·8, 3·9 and 8·2 % by DP, 24hR and FFQ, respectively.
Table 3 Mean intake, bias and association between basic determinants and misreporting of energy, protein and potassium intake by the duplicate portion method (DP), 24 h recall (24hR) and FFQ, according to regression analyses, among study participants (n 197) aged 20–70 years from Wageningen, the Netherlands
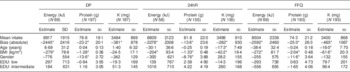
EDU, education level; PABA, p-aminobenzoic acid.
All determinants were included in the model at the same time together with PABA completeness (yes=0, no=1).
Coding: gender: 0=women, 1=men; EDU: relative to highly educated.
*Significant at P≤0·05.
Basic determinants associated with misreporting
A higher BMI was associated with under-reporting of energy and protein to a similar degree for all methods. An increase in BMI of 1 kg/m2 led to an increase in under-reporting of energy by 279 kJ for the DP, 204 kJ for the 24 hR and 272 kJ for the FFQ, and of protein by 1·3, 1·3 and 2·0 g for the respective dietary assessment methods (Table 3). BMI was associated with under-reporting of K assessed by the memory-based methods 24hR and FFQ, but not by DP. Being of older age was associated with misreporting of K intake, also only by 24hR and FFQ. For a 1-year increase in age, K was under-reported by an additional 17 mg by the 24hR and 16 mg by the FFQ (Table 3). Men showed higher under-reporting than women for protein assessed by all three dietary assessment methods but not for energy. No significant association was observed between misreporting and level of education.
Explorative determinants associated with misreporting
In addition to the basic determinants mentioned before, further potential determinants were explored one at a time, while accounting for PABA recovery. Only a few significant associations were observed. Participants who were of the opinion that they were too heavy over-reported protein assessed by the FFQ by 9·8 g on average as compared with those who were of the opinion they had an appropriate body weight (Table 4). Also, a higher percentage of body fat was associated with protein and K over-reporting in the FFQ (0·91 g and 43 mg, respectively). In contrast, a 1 kg larger weight difference within the past 5 years was associated with protein under-reporting of 0·52 g but only when assessed by the DP and not by one of the memory-based methods. Also a 1 MET/d higher physical activity level was associated with a higher level of under-reporting of energy assessed by the 24hR and FFQ (3916 and 3799 kJ, respectively) but this was not the case for the DP. For protein, 1 MET/d higher physical activity level was associated with a higher level of under-reporting (22·7 g) for only the 24hR.
Table 4 Association between explorative determinants and misreporting of energy, protein and potassium intake by the duplicate portion method (DP), 24 h recall (24hR) and FFQ, according to regression analyses, among study participants (n 197) aged 20–70 years from Wageningen, the Netherlands
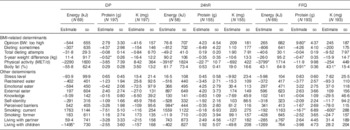
BW, body weight; MET, MET, metabolic equivalents of task; PABA, p-aminobenzoic acid.
Determinants were entered in a multivariate linear regression model in addition to the basic determinants (BMI, gender, age and education level) and PABA completeness, one at a time.
*Significant at P≤0·05.
Further exploration of the other determinants indicated a higher perception of barriers to eat healthily to be associated with over-reporting of energy assessed by the 24hR (984 kJ). For those living in a household with children, more energy under-reporting by the DP (1495 kJ) was observed compared with those living without children. Also, being a current smoker was associated with under-reporting for protein (16·7 g as compared with never smokers) and K (600 mg) intake as assessed by the FFQ.
Discussion
We studied the association of determinants with misreporting of three nutrients for DP, 24hR and FFQ, using biomarkers as the reference method. To our knowledge, the present study is the first to include the DP method in such a validation study. As expected, the study showed that BMI is an important determinant associated with misreporting of energy, protein and K intake for the different dietary assessment methods. However, we did not see this association for K assessed by DP. Persons of older age under-reported K to a larger extent by the 24hR and FFQ, and men tended to under-report protein to a larger extent than women on the DP, 24hR and FFQ. Adding the explorative determinants, BMI-related and other, to the basic model did not show associations with misreporting for most of the determinants. For those explorative determinants that did show a significant association with misreporting, no consistent pattern over the three nutrients or dietary assessment methods was observed.
Our finding that a higher BMI is associated with under-reporting is consistent with those of other studies( Reference Freisling, Van Bakel and Biessy 10 , Reference Briefel, Sempos and McDowell 14 – Reference Price, Paul and Cole 17 ). The association between misreporting and a higher BMI might be explained by the selective under-reporting of certain foods (such as unhealthy snacks) by people with a higher BMI( Reference Lissner 43 ). Selective under-reporting of foods may result in differential reporting of nutrients. Selective misreporting of nutrients was proposed by Subar et al. ( Reference Subar, Kipnis and Troiano 44 ) who observed larger under-reporting of energy than of protein, suggesting a bias towards more under-reporting of fat, carbohydrates or alcohol. We also observed this when dietary intake was assessed by 24hR, although not when assessed by DP or FFQ. Social desirability has also been suggested to underlie the under-reporting of people with a higher BMI; however, Taren et al. ( Reference Taren, Tobar and Hill 45 ) demonstrated that social desirability and BMI influence misreporting independently. In our study no variables about number of meals and snacks were included as this is not distinguishable for the DP. For macronutrients such as carbohydrates and fats no recovery biomarkers are presently known( Reference Willett 8 ), so the degree of misreporting for such nutrients can only be estimated using imperfect reference methods. Furthermore, no data on social desirability were available.
The other basic determinants that showed an association with misreporting were gender and age. Men showed higher under-reporting than women for protein on the DP, 24hR and FFQ. In our study, standard portion sizes were used for the 24hR and FFQ( Reference Donders-Engelen and van der Heijden 46 ); as men tend to eat more than women, this might have caused more underestimation of intake for men. For example, the major source of protein intake for men is meat (29 %)( Reference van Rossum, Fransen and Verkaik-Kloosterman 47 ), thus if the meat consumption of men is underestimated this will lead to an underestimation of protein intake. However, this does not explain why men also underestimated protein intake by the DP. Older age was significantly associated with higher under-reporting of K intake, but only for FFQ and 24hR. FFQ and 24hR are recall methods relying on the memory of the participant while this is not the case for the DP. However, in our population there was little variation in age, thus drawing firm conclusions based on these findings cannot be done.
When looking at the statistically significant explorative BMI-related determinants, our findings are consistent with those of Briefel et al. who also reported an association between the extent of misreporting of energy intake and a higher physical activity level( Reference Briefel, Sempos and McDowell 14 ). Associations with misreporting of energy also were found for body fatness, body image (which is related to one’s opinion about one’s body weight) and weight differences( Reference Novotny, Rumpler and Riddick 18 ). Percentage body fat is different for women and men. In our study women had a mean body fat percentage of 34 % and men of 22 %. However, in none of the models was the interaction term for body fat and gender significant, thus the effect of body fat would not be different for men and women. For the measurement of body fat, subject preparation was not standardized in our study. We do not expect that this had a relevant impact on the percentage body fat measured( Reference Horber, Thomi and Casez 48 ). Other studies also found an association between smoking status and misreporting of energy intake( Reference Livingstone and Black 7 , Reference Briefel, Sempos and McDowell 14 ), that we did not observe. To our knowledge no other studies found associations between misreporting and perception of barriers or living with children. Direct comparison of these findings with our results is difficult as in these studies only misreporting of energy intake was investigated, and it should be taken into account that not all of these studies used DLW to assess the level of misreporting. Furthermore, due to the high costs of DLW, the sample size for energy was small in our study. Also, physical activity level was measured in different ways (e.g. with accelerometers (as in our study) or questionnaires) and the populations are different in the different studies.
It is also worthwhile to discuss the determinants that did not show a significant association with misreporting, such as education, knowledge and restrained eating. For the first two variables, the reason for not observing an association may be the limited variation in our study population. Over 50 % of our study population was highly educated and only 19 % was classified as low educated. Next, under-reporters could be expected to have a higher knowledge on healthy foods and thus (selectively) not have reported unhealthy foods. Our knowledge questionnaire might not have had a high discriminatory power (the average score was 15 out of 17) for our participants, as they were highly motivated (they were willing to fill in multiple questionnaires, collect two DP, fill in two FFQ, administer multiple 24hR and seventy participants joined the DLW study) and could therefore also be expected to have a good knowledge about healthy eating. Although we did not observe an association between restrained eating and misreporting, restrained eating has been associated with misreporting of energy intake( Reference Asbeck, Mast and Bierwag 49 , Reference Bathalon, Tucker and Hays 50 ). However, there are restrained eaters who report adequately and non-restrained eaters who report poorly( Reference Maurer, Taren and Teixeira 6 , Reference Livingstone and Black 7 , Reference Tooze, Subar and Thompson 16 ); thus final conclusions cannot be drawn.
We estimated the bias by taking the intake of one day minus the average intake of two days estimated by the biomarkers. The assessment days were included separately in the regression model because we wanted to estimate the day-to-day variance of the intake as assessed by DP, 24hR or FFQ. As the reference method, we used the average of two days of intake estimated by the biomarkers instead of one day to better reflect the usual intake, as we did previously( Reference Crispim, Geelen and De Vries 1 ).
Misreporting of dietary intake is often associated with weight status and for specific foods and food groups, thus true associations between diet and diseases may be distorted by this bias( Reference Mendez 51 ). Various methods have been proposed to adjust energy intake for misreporting and most of these methods are based on the exclusion of the group of implausible energy reporters( Reference Mendez, Popkin and Buckland 52 – Reference Black, Prentice and Goldberg 54 ). This might cause selection bias( Reference Hernán, Hernández-Díaz and Robins 55 ), as the people identified as being implausible reporters of energy intake might also be the group with specific characteristics, e.g. a higher BMI, than the plausible reporters. Thus (statistical) methods correcting the individuals misreporting would be preferred.
The DP, on the one hand, and the 24hR and FFQ, on the other, are conceptually different dietary assessment methods. The DP is not based on memory, portion sizes do not need to be estimated, and data from food composition databases are not needed to assess the nutrient content of the DP, whereas this is the case for both FFQ and 24hR. Therefore, it may be expected that the error sources among these methods are different. This could explain why age and BMI for under-reporting of K and physical activity for under-reporting of energy are more important determinants for the 24hR and FFQ than for the DP. On the other hand, 5-year weight difference for under-reporting of protein and living with children for under-reporting of energy were more important determinants for the DP than for the 24hR and FFQ. Further research is necessary in order to explain these findings.
We investigated the association between determinants and misreporting. Identifying determinants associated with misreporting helps our understanding of what processes are ongoing during dietary reporting. Eventually, such information should be used to improve the assessment of dietary intake. An attempt has been made, for example, to develop a dietary assessment instrument for use in obese individuals; however, after several validation studies in different obese target groups, it did not prove to consistently show valid results( Reference Lissner 43 ).
Furthermore, information on determinants of misreporting should be collected in nutritional epidemiological studies and inclusion in calibration models could improve the calibration model. However, deciding which covariables to include in a calibration model is complex; especially BMI is difficult, because of its multiple possible roles( Reference Prentice and Huang 56 , Reference Zheng, Beresford and Van Horn 57 ). For example, in epidemiological research BMI could be a predictor of intake but also the health outcome. Further research is needed on how best to choose the covariates in a calibration model without introducing other sources of bias.
Conclusion
We conclude that in this Dutch study population, only BMI was consistently associated with under-reporting of energy and nutrients by the different dietary assessment methods. Thus BMI should always be taken into account when assessing and correcting dietary intake.
Acknowledgements
Acknowledgements: The authors thank Anne van de Wiel, MSc, for making it possible to use data from the NQplus study. The authors thank Mira Mutiyani, BSc, Sanne Marije Seves, BSc, and Cecilia Ferreira Lima, BSc, for their help in analysing the DP samples and Corine Perenboom for her help in preparing the 24hR data. In addition, the authors thank the individuals from the DuPLO study for participating in the present study. Financial support: The NQplus study was funded by ZonMw (grant number 91110030) and Wageningen University. The DuPLO study was funded by VLAG (Voeding, Levensmiddelentechnologie, Agrobiotechnologie en Gezondheid), a graduate school of Wageningen University. ZonMW and VLAG had no role in the design, analysis or writing of this article. Conflict of interest: None. Authorship: L.T. collected the data, contributed to the study design, data analysis and interpretation of findings, and wrote the manuscript. A.G., P.v.V. and J.H.M.d.V. contributed to the study design and interpretation of findings and revised the earlier versions of the manuscript. H.C.B. contributed to the data analysis and interpretation of findings and revised the earlier versions of the manuscript. P.J.M.H., P.C.H.H. and E.J.M.F. contributed to the study design and revised the earlier versions of the manuscript. All authors read and approved the final version of the manuscript. Ethics of human subject participation: This study was conducted according to the guidelines laid down in the Declaration of Helsinki and all procedures involving human subjects were approved by the medical ethical committee of Wageningen University. Written informed consent was obtained from all participants.


