


Alcohol use has a complex relationship with health and causes substantial health loss across the lifespan(1). According to the WHO, the harmful use of alcohol is a causal factor in more than 200 disease conditions, including mental and behavioural disorders, other non-communicable conditions and injuries(2). Excessive alcohol consumption causes death and disability relatively early in life, and findings from the Global Burden of Disease project showed that among the population aged 15–49 years, alcohol was the leading risk factor for death in 2016, accounting for 3·8 % (95 % CI 3·2, 4·3) for women and 12·2 % (10·8, 13·6) for men in 2016(1). Alcohol may also affect nutritional status because its metabolism prevents the body from properly digesting, absorbing and using many nutrients(Reference Lieber3).
A public health-related dimension of alcohol use confined to reproductive age is the adverse effects of alcohol on developing egg and sperm, potentially affecting the health and development of not-yet-conceived offspring. Both egg and sperm are nutritionally and toxicologically vulnerable to their surrounding environment(Reference Fleming, Watkins and Velazquez4,Reference Lane, Robker and Robertson5) . There is now compelling evidence that alcohol exposure may epigenetically affect developing egg and sperm and induce stable and irreversible gene expression patterns that may be carried forward in the offspring(Reference Rompala and Homanics6). Alcohol also contributes to energy intake and may influence the risk of overweight and obesity over time(Reference Kwok, Dordevic and Paton7).
Puberty initiates a period of growth and maturation of musculoskeletal, neurodevelopmental, endocrine, metabolic, immune, cardiometabolic and reproductive systems that extend into young adulthood(Reference Patton, Olsson and Skirbekk8). During this period, women build nutritional capacity for childbearing, while men build biological capital for the general demands of life(Reference Patton, Olsson and Skirbekk8,Reference Hanson and Gluckman9) . A poor or suboptimal diet during adolescence and young adulthood may detract from reproductive fitness, with individual and cross-generational health consequences(Reference Patton, Olsson and Skirbekk8).
Students represent a group of young adults typically in the transition from living with their family to establishing a life on their own. Many will engage in intimate relationships during this life stage and some will become parents during their university years. From this perspective, the aim of the present study was to assess the prevalence of excessive alcohol consumption in a sample of students and explore whether weekly level of alcohol intake is associated with energy and nutrient intake and adequacy of micronutrient intake.
Methods
Study design
The analyses for this paper are based on dietary data from the cross-sectional survey StudentKost(Reference Valen, Engeset and Øverby10). The overall aim of StudentKost was to assess students’ diet in relation to official dietary guidelines. The data collection was carried out from the end of October until early December 2018 and all students enrolled at the University of Agder, Kristiansand, Norway, aged 18–40 years were eligible for participation. Students were approached through a short film that was repeatedly shown at boards around the university and through invitations distributed in social media. We also distributed flyers in university classrooms and smaller group study rooms. Due to limited response rate from these approaches, we obtained permission from the university administration to send invitations via the students’ institutional email. The email invitation included a link to the study webpage where participants could read about the study before consenting by completing a web-based questionnaire. A web-based tool for conducting questionnaire-based programmes, SurveyXact, was used to conduct the survey(11).
The questionnaire
The questionnaire consisted of general information about the participants (5 items), a validated and reproducibility-tested FFQ (152 items)(Reference Salvesen, Hillesund and Vik12), questions about eating habits (12 items), motivational factors and barriers to healthy eating (26 items), physical activity and sedentary behaviour (8 items) and tobacco use (6 items).
Weekly consumption of alcoholic beverages was assessed with six questions regarding type and frequency of use on weekdays, and the same questions about use during weekends. The frequency of intake of the following types of beverages with predefined item size was asked for non-alcoholic beer (0·5 l), beer (0·5 l), cider or alcopops (0·5 l), wine (1 glass) and spirits (1 drink). Frequency of use during weekdays was reported as ‘do not drink’, 1–3 items/month, 1–3 items/week, 4–6 items/week, 1 item/d, 2–3 items/d and >3 items/d. Frequency of use during weekends was reported as ‘do not drink’, 1–3 items/month, 1–2 items/weekend, 3–4 items/weekend, 5–6 items/weekend and >6 items/weekend. Frequency of intake for each alcoholic beverage was averaged across the reported range and recoded into frequency per month (e.g., 1–2 items/weekend averaged 1·5 item/weekend × 4 weekends/month). Frequency of intake of the predefined units per month was further recoded into frequency of intake per day. The size of the item and its alcohol content according to the food composition table were used to compute grams of alcohol per day that was further recoded into units of alcohol per week.
For descriptive purposes, we combined the various smoking variables into one smoking variable (comprising cigarettes, cigars, pipe, etc.), but kept snuff as a separate tobacco variable. We then dichotomised these variables into never/seldom v. sometimes/daily. The food frequency part of the questionnaire was composed of different categories, for example, beverages, bread and grain products, spreads, dairy products, main dishes, side dishes, fruit and vegetables, desserts, cakes, sweets and snacks. The response alternatives given in the survey ranged from never eating the specific food item to eating it every day. There were in total 5–7 different frequency categories depending on the nature of the question. Every product had a definition of how much one portion would equal. Participants were asked to report diet according to their consumption the last 4 weeks.
Participants had to answer every question to complete the questionnaire, with self-reported height and weight being the only voluntary information. Satisfactory test–retest reproducibility and fair relative validity of the FFQ assessed against a 7-day food record have been documented(Reference Valen, Engeset and Øverby10). Median test–retest Spearman’s r correlations for energy and nutrients was r = 0·85, ranging from r = 0·56 for vitamin D to r = 0·93 for Ca. Median Spearman’s r correlations with 7-day food record was r = 0·59, ranging from < 0·005 for saturated fat to r = 0·78 for folate. For alcohol intake, the respective correlations were r = 0·83 for test–retest reproducibility and r = 0·71 for relative validity.
We used Python(13) and FoodCalc(Reference Lauritsen14) to calculate energy and nutrient intake. Python calculates the quantity of individual food items, while FoodCalc estimates the nutrient intake by pairing the registered quantity of each food item with its corresponding nutrient content from the relevant food item code given in the Norwegian Food Composition Table(15).
Definition of units of alcohol and categorisation of levels of alcohol consumption
The definition of what constitutes a unit of alcoholic drinks varies across countries from approximately 8–12 g(Reference Brien, Ronksley and Turner16). We applied the UK definition of one alcohol unit equalling 8 g of alcohol by weight to be able to compare findings with studies presenting outcomes based on this unit definition(Reference Nykjaer, Alwan and Greenwood17).
The UK cut-off for keeping health risks from alcohol to a low level is defined as 14 alcohol units/week(18–Reference Holmes, Beard and Brennan19). We categorised participants into three categories according to the level of weekly alcohol intake: zero alcohol consumption (abstaining from alcohol), ≤ 14 units/week (moderate alcohol consumption) and > 14 units/week (excessive alcohol consumption). We also assessed the proportion of participants with excessive alcohol consumption according to the 2012 Nordic Nutrition Recommendations definition: the contribution of alcohol to total energy intake of more than 5 %(20).
Statistical analysis
We used IBM SPSS 25.0(21) for data analysis. As women and men differ in energy and nutrient requirements, all analyses were carried out stratified by gender. We compared participant characteristics (age, education, weight, height, BMI, smoke and snuff), food and beverage consumption, and nutrient intakes (absolute and energy-adjusted intake) across the previously described three categories of increasing alcohol consumption. We also assessed the proportion of participants with micronutrient intakes below the average requirement (AR) for age and gender across alcohol consumption level(20). The AR for a specific micronutrient is estimated to cover the requirement for approximately half of an age- and gender-specific population(20). Intake below this value for a specific micronutrient therefore implies a relatively high probability of inadequate intake(20).
For comparisons across levels of alcohol intake, we used one-way ANOVA for continuous variables, Kruskal–Wallis test for food variables and χ 2 test for categorical variables. Results are presented as mean (SD), median (interquartile range) or number with proportions (%). Significance level was set to P ≤ 0·05.
We estimated associations between level of alcohol consumption and nutrient intake in linear regression models both in absolute terms and energy-adjusted (nutrient intake/MJ). We computed a continuous variable of weekly alcohol intake in two-unit increments (16 g of alcohol), ranging from 0 until 40 units of alcohol (306 g of alcohol) or more per week and modelled energy-adjusted nutrient intake (nutrient intake/MJ) as a function of weekly alcohol intake in linear regression analyses. We applied log-transformed energy and nutrient variables to approach normality and improve assumptions in the linear regression models. Estimates are presented as beta (β), se, standardised beta and 95 % CI. In the interest of comprehension, we exponentiated the coefficient, subtracted one from this number and multiplied by 100 (exp(coefficient)–1)) × 100) to yield the percentage increase or decrease in the response variable (energy and nutrient intake) for every two-unit increase in the independent variable (weekly alcohol consumption).
Results
Approximately 13 000 students were approached with the invitation to participate in the survey. Out of 743 participants who responded and answered at least one or more questions, 617 completed the entire survey and were included in the analyses. We included five additional participants who had completed the food frequency part of the questionnaire and could be included in the calculations of alcohol consumption and nutrient intake. The final sample for the present analyses was therefore 622 participants of which five lacked information on one or more background variables (4·8 % of those potentially eligible for participation). Women constituted 71·4 % of the sample. Mean age was 23·4 and 23·6 years for female and male students, respectively. One in two were first-year students (n 299, 48·1 %).
Approximately 17 % of men and 16 % of women reported no intake of alcohol the previous 4 weeks. Alcohol intake varied from 0 to 493 g/week for men and 0 to 387 g/week for women. Applying the UK definition of 8 g of alcohol/unit and the recommended limitation of alcohol intake to a maximum of 14 units/week for both genders, 33 % of male and 13 % of female students had excessive alcohol intake. These proportions were almost identical when the Nordic Nutrition Recommendations definition of excessive alcohol intake was used (33 % of men and 15 % of women). The Norwegian definition of one alcohol unit equals 13 g of alcohol by weight. Applying the Norwegian definition of 13 g alcohol/unit with the upper limit of 14 units/week for both genders (equal to 182 g alcohol/week), only 4 % of women and 12 % of men were categorised as having excessive alcohol intake.
Participant age, height, weight, BMI, education and tobacco use across categories of increasing alcohol intake are presented in Table 1. The only covariance with alcohol intake was a substantially higher prevalence of obesity among women with excessive alcohol intake v. alcohol abstainers and those with alcohol intake < 14 units/week (19·3 v. 6·6 and 6·0 %, respectively).
Table 1 Socio-demographic information according to categories of weekly alcohol consumption*. Men and women participating in StudentKost

* 1 unit of alcohol equivalent to 8 g of alcohol by weight and 14 units of alcohol/week represents the UK Chief Medical Officers’ Low Risk Drinking Guidelines 2016 cut-off for low-risk alcohol consumption(18).
† BMI: 9 missing values for women.
‡ BMI > 30 P trend (linear-by-linear association) 0·009, χ 2 P = 0·002.
Food and beverages, energy and macronutrient intake in relation to alcohol intake
Table 2 describes intake of alcoholic beverages, foods and other beverages across categories of alcohol consumption. With increasing alcohol intake, a larger proportion of total intake of alcoholic beverages consisted of beer. Beer represented, by far, the largest volume of alcoholic beverages consumed for men while this pattern was not as explicit for women. For most foods and beverages, there was no significant difference in consumption across alcohol categories, except for higher consumption of sugar-sweetened beverages for both men and women (P = 0·018 and 0·006, respectively). A higher consumption of sweets and snacks (P = 0·016) and sweetened beverages total (P = 0·011) and a lower consumption of cakes and desserts (P = 0·012) across alcohol consumption categories were observed for men only.
Table 2 Daily food and beverage consumption across categories of weekly alcohol consumption*. Men and women participating in StudentKost

* 1 unit of alcohol equivalent to 8 g of alcohol by weight and 14 units of alcohol per week represents the UK Chief Medical Officers’ Low Risk Drinking Guidelines 2016 cut-off for low-risk alcohol consumption(18).
† P < 0·05 for men only (Kruskal–Wallis).
‡ P < 0·05 for both men and women (Kruskal–Wallis).
Energy intake, absolute intake of carbohydrate, fat, protein and alcohol in grams per day and their relative contribution to total energy intake across increasing alcohol intake are presented in Table 3. Energy intake increased with increasing alcohol intake for both genders (P > 0·001), as did the absolute intake of fat (P = 0·027 for men and P = 0·031 for women), carbohydrates (P < 0·001) and added sugar (P = 0·011 for men and P < 0·001 for women) (Table 3).
Table 3 Energy, macronutrient and micronutrient intake according to categories of weekly alcohol consumption*. Men and women participating in StudentKost
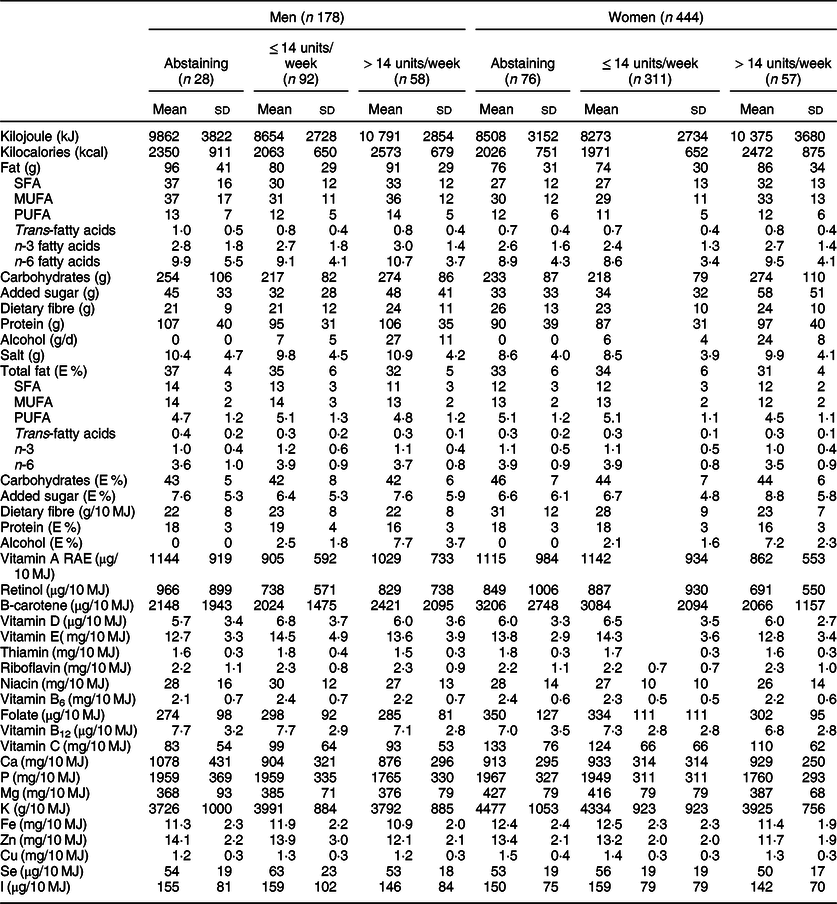
RAE, retinol activity equivalents.
* 1 unit of alcohol equivalent to 8 g of alcohol by weight and 14 units of alcohol per week represents the UK Chief Medical Officers’ Low Risk Drinking Guidelines 2016 cut-off for low-risk alcohol consumption(18).
Estimates of the associations between weekly alcohol consumption in 2-unit increments and log-transformed nutrient variables are presented in Table 4. For male students, energy intake and absolute intake of carbohydrates, added sugar and PUFA were positively associated with alcohol consumption. The relative contribution of energy from total fat, SFA, MUFA and protein was, however, inversely associated with weekly alcohol consumption. For female students, energy intake and absolute intake of fat, SFA, MUFA, PUFA, carbohydrates, added sugar, salt and protein were positively associated with alcohol consumption, as was the contribution of energy from added sugar. The relative contribution of energy from total fat, MUFA, PUFA and protein was inversely associated with alcohol intake.
Table 4 Associations between alcohol consumption and log-transformed energy and nutrient intake among men and women in StudentKost. Alcohol intake measured per 2 units of alcohol/week intervals*

RAE, retinol activity equivalents.
* 1 unit of alcohol equivalent to 8 g of alcohol by weight.
Micronutrient intake in relation to alcohol intake
Estimates of the associations between weekly alcohol consumption in 2-unit increments and log-transformed energy-adjusted micronutrient variables are presented in Table 4. Among men, we observed significant inverse associations between alcohol consumption and energy-adjusted intake of thiamine, phosphate, Fe, Zn and Se, on the order of 0·3–0·6 % lower nutrient density per 2-unit weekly increase in alcohol consumption. This translates into a difference of 6–10 % for thiamine, Fe and P, and a difference of 12 % for Zn and Se from the lowest to the highest category of alcohol consumption.
Among women, there were significant inverse associations between alcohol consumption and energy-adjusted intake vitamin A, β-carotene, vitamin E and C, as well as thiamine, vitamin B6, folate, P, Mg, K, Fe, Zn and Cu on the order of 0·3–1·9 % lower nutrient density per 2-unit weekly increase in alcohol consumption. This translates into a difference of 6–10 % for vitamin E, thiamine, vitamin B6, folate, P, Mg, K, Fe, Zn and Cu, 12–20 % for vitamin A and C and 38 % for β-carotene from the lowest to the highest category of alcohol consumption.
Probability of inadequate micronutrient intake across alcohol intake categories
Finally, we assessed the proportion of participants with relatively high probability of inadequate micronutrient intake, defined as a total intake of the respective micronutrient lower than age- and gender-specific AR(20) (Table 4). The proportion of participants with micronutrient intakes below AR varied between alcohol consumption categories and was generally high for vitamin A, vitamin D, folate and I for both genders, in addition to thiamine and vitamin C for men, and Fe for women. The magnitude of these proportions was not, however, related to level of alcohol intake. If anything, there was indication of a lower probability of inadequate intake with higher weekly alcohol intake (Table 5).
Table 5 Proportion % of participants with micronutrient intake below average requirement (AR)* across alcohol intake categories† among men and women in StudentKost
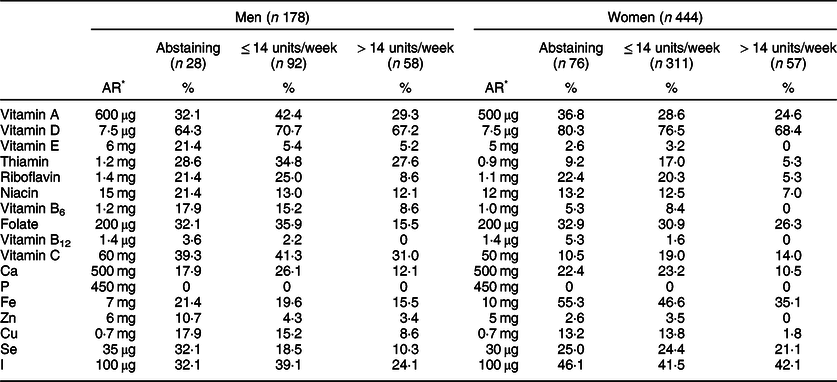
* Age- and gender-specific average requirement of micronutrients according to Nordic Nutrition Recommendations 2012(20)
† 1 unit of alcohol equivalent to 8 g of alcohol by weight and 14 units of alcohol per week represents the UK Chief Medical Officers’ Low Risk Drinking Guidelines 2016 cut-off for low-risk alcohol consumption(18).
Discussion
More than four in five men and women in this sample of Norwegian students reported having consumed alcoholic beverages the past 4 weeks and one-third of the men exceeded the upper recommended limit of 14 UK alcohol units/week. Alcohol intake was positively associated with energy and macronutrient intake but inversely associated with the micronutrient density of their diet. A substantial proportion of participants had vitamin D, folate, Fe and I intakes below AR, indicating relatively high probability of inadequate intake. No relationship between alcohol consumption level and the proportion of participants with micronutrient intake below AR was observed.
The prevalence of alcohol consumption in the current study is in line with regional data from the Global Burden of Disease project showing that > 80 % of male and female Norwegians aged 18–49 years are alcohol consumers(1). The fact that one-third of the men in our sample exceeded the low risk alcohol consumption cut-off should alert public health authorities that alcohol is a prevalent exposure among the young and a potential threat to public health. The true prevalence of risky alcohol behaviour among Norwegian students could be even higher. The nation-wide SHOT-survey that was carried out in 2018 among 50 054 Norwegian full-time students with 31 % response rate categorised 44 % of the students as having a risky alcohol consumption level, although this classification was based on more aspects of alcohol consumption than ours(Reference Knapstad and Heradstvei22). Even though fewer women were categorised as having excessive alcohol consumption in our study, the widespread lower level of consumption may still have the potential to influence health(1). Except for advising total abstinence from alcohol during pregnancy, Norwegian health authorities have not issued specific limits regarding weekly alcohol consumption beyond encouraging limited alcohol intake and to avoid getting drunk. The strikingly different prevalence of excessive alcohol use depending on different definitions demonstrated in our sample, point to a need for standardisation across countries and agreed-upon recommendations on what constitutes risky alcohol-related behaviours.
Alcohol is metabolised in the body to the toxic and highly reactive metabolite, acetaldehyde and further to acetoacetate which is less toxic and can be completely metabolised in liver cells(Reference Lieber3). The peak concentration of acetaldehyde depends upon several factors, among them nutritional intake and nutritional status(Reference Lieber3). One of the mechanisms by which alcohol metabolism exerts its metabolic and toxic effects is by disturbing the intracellular tightly controlled ratio of nicotinamide adenine dinucleotide (NAD+) to reduced NAD (NADH), leading in turn to high levels of NADH and disturbed fat metabolism(Reference Lieber3). Inherent to these disturbances is an increased level of oxidative stress.
Nutritional status is always affected among high alcohol consumers(Reference Lieber3). A high level of alcohol consumption impairs intestinal absorption of nutrients and leads to increased loss of nutrients in urine(Reference Lieber3). Deficiencies in ascorbic acid, thiamine, Mg, P, vitamin D and protein are frequent among high alcohol consumers(Reference Lieber3). In addition, nutritional status may be compromised by the toxic and metabolic effects of alcohol degradation. Alcohol also promotes the breakdown of vitamin A and reduces cell levels of vitamin E and glutathione(Reference Lieber3), all important components in cell antioxidant defence systems.
Alcohol is an energy-dense compound that over time may contribute to unwanted or undesirable weight gain and overweight/obesity. In our study, increasing alcohol intake was positively and consistently associated with higher energy intake among both men and women, but only women with excessive alcohol intake had higher mean BMI and a significantly higher proportion of obesity compared to those with lower or no alcohol consumption (Tables 1 and 3). Given the cross-sectional nature of our data, we do not know whether these observations reflect causal associations. As weight and height were self-reported, we cannot exclude under- or overreporting of height and weight, nor differential degree of misreporting between genders and across alcohol consumption categories. A higher degree of underreporting might be the case among women in the lower alcohol consumption groups contributing to the large difference in obesity, but this remains to be investigated. As a group, women with high alcohol intake had indications of a less healthy diet, with lower intake of fruits and vegetables and higher intake of non-core foods (Table 2). In a systematic review and meta-analysis of twenty-two studies involving 701 participants, Kwok et al. demonstrated that alcoholic beverage consumption significantly increased food energy intake by a mean of 343 kJ (95 % CI 161, 525) and total energy intake by 1072 kJ (95 % CI 820, 1323) compared with no consumption(Reference Kwok, Dordevic and Paton7). The authors conclude that adults do not seem to compensate appropriately for alcohol energy by eating less and that even a relatively modest amount of alcohol may lead to increased food consumption (ibid). As overweight and obesity represent a threat to public health, not least in a preconception health perspective(Reference Fleming, Watkins and Velazquez4), this aspect of alcohol consumption should not be neglected. Albani et al. (Reference Albani, Bradley and Wrieden23) examined associations between BMI and energy intake from alcohol and found that young adults drinking the highest levels of alcohol on a single occasion were more likely to be obese than those with the lowest intakes(Reference Albani, Bradley and Wrieden23). Sprake et al. (Reference Sprake, Russell and Cecil24)investigated associations between dietary patterns of university students and associated nutrient profiles and reported that a ‘convenience, red meat and alcohol’ dietary pattern exhibited strong correlation with energy intake. In the National FINRISK 2007 study, alcohol consumption among men and women was associated with the so-called normal weight obesity, defined as BMI < 25 kg/m2, but with excessive body fat (≥ 20 % for men and ≥ 30 % for women)(Reference Männistö, Harald and Kontto25). Fazzino et al. prospectively examined students’ alcohol consumption during the first year of college in relation to changes in weight and adiposity during the same period(Reference Fazzino, Forbush and Sullivan26). Although 28 % experienced a weight gain of more than 2·3 kg, differences in anthropometric changes could not be explained by alcohol consumption.
The magnitude of the associations between alcohol intake and the micronutrient density of diet seemed modest for most micronutrients. Yet, the estimates translated into 6–38 % lower micronutrient density from the lowest to the highest alcohol consumption level depending on the micronutrient in question. For women, the observed inverse association between alcohol intake and nutrient intake was strongest for the natural antioxidants, that is, vitamin A, β-carotene, vitamin C and vitamin E. This may be of particular concern given the oxidative stress induced by alcohol consumption combined with the adverse effect of alcohol on antioxidant enzymes and chemicals such as the catalase and superoxide dismutase enzyme and glutathione(Reference Wu and Cederbaum27). In addition, the lower dietary nutrient density of Fe, Zn and Cu, all cofactors in enzymatic oxidative defence systems, could contribute to compromised oxidative defence(Reference Wu and Cederbaum27). For male students, the inverse associations between alcohol intake and nutrient intake were evident for Zn, Se, thiamine, Fe and P. Se and Zn are cofactors in enzymatic oxidative defence systems that may ameliorate the oxidative stress of alcohol metabolism(Reference Wu and Cederbaum27). Deficiency of thiamine and other B-vitamins is prevalent among high alcohol users, likely due to a combination of reduced intake and increased metabolic need(Reference Lieber3). Sprake et al. reported inverse correlations between increasing adherence to a ‘convenience, red meat and alcohol’ dietary pattern and most energy-adjusted micronutrients(Reference Sprake, Russell and Cecil24). Even though the mentioned factor analysis-derived dietary pattern only partly reflects absolute alcohol intake, their observations are in line with our findings.
Although micronutrient density of diet was inversely associated with weekly alcohol intake in our study, this did not translate into an increased probability of inadequate micronutrient intake across categories of alcohol intake. This means that the lower micronutrient density across alcohol categories was, at least to some extent, compensated for by increased absolute intake of energy and micronutrients. At any level of alcohol consumption, a surprisingly high proportion of both male and female students had micronutrient intakes below AR and thus a relatively high probability of inadequate intake of vitamin A, vitamin D, vitamin C (men), folate, Ca, Fe (women), Se and I. As our findings are confined to dietary data, we do not know whether and to which degree participants with or without excessive alcohol consumption had biochemical indications of compromised nutritional status. It is, however, conceivable that higher levels of alcohol consumption could render individuals more vulnerable to the metabolic effects of inadequate micronutrient intake(Reference Lieber3,20) .
In a preconception public health perspective, both alcohol consumption and suboptimal micronutrient intake among young adults are of concern. Many pregnancies are not planned for(Reference Sedgh, Singh and Hussain28) and unintended pregnancy is more common among the young, people with less education, those not living with a partner and students(Reference Lukasse, Laanpere and Karro29). Alcohol intake affects developing eggs and sperm which in the case of conception represents the origins of hundreds of stable cell lineages, making up organs and body structures in the fetus(Reference Finegersh, Rompala and Martin30). What may be considered as normal alcohol-related behaviours among young adults have the potential to unintentionally affect long-term health, cognitive development and behaviour in their prospective children(Reference Rompala and Homanics6). Nykjaer et al. found a strong inverse association between women’s reported alcohol intake 4 weeks before pregnancy and offspring birthweight and subsequent pattern of growth(Reference Nykjaer, Alwan and Greenwood31). Compared with non-drinkers, alcohol intake above two units/week in the last 4 weeks before conception was associated with a significant decrease (–7·7) in customised birth centile(Reference Nykjaer, Alwan and Greenwood31). Two-thirds of participants in the study of Nykjaer et al. had an alcohol intake above two units/week.
The high proportion of participants with potentially inadequate intake of vitamin A, D, folate, Fe and I is of concern per SE, as these nutrients have targeted roles in embryogenesis and early fetal development. Vitamin A is essential for male and female reproductive health, and for many events in the developing embryo(Reference Clagett-Dame and Knutson32). More than one-third (38 %) of men in our study had a high probability of inadequate vitamin A intake, while the corresponding number for women was 30 % (data not shown). Likewise, vitamin D has fundamental roles in both male(Reference Boisen, Bollehuus Hansen and Mortensen33) and female reproductive function(Reference Heyden and Wimalawansa34). Inadequate folate status in women prior to conception is a well-known risk factor for neural tube defects in the fetus(Reference De-Regil, Peña-Rosas and Fernández-Gaxiola35). More recently, there has been increasing focus on folate in relation to male fertility(Reference Hoek, Koster and Schoenmakers36). Marginal folate status has been associated both with erectile dysfunction(Reference Karabakan, Erkmen and Guzel37,Reference Attia, Amer and Hassan38) and with impaired fertility and spermatogenesis(Reference Hoek, Koster and Schoenmakers36,Reference Yuan, Zhao and Zang39) .
The stable carbohydrate contribution to total energy intake across alcohol intake, but lower contribution of protein, total fat and fatty acids to total energy intake, probably reflects the necessary dilution effect by the contribution of energy from alcohol in combination with increased carbohydrate intake associated with the consumption of alcohol-containing beverages. When simple carbohydrates replace essential nutrients such as protein and essential fatty acids, there is a risk for compromised nutritional status. In the present case, both protein and total fat intake were relatively high and not likely to compromise nutritional status in any group. Besides, absolute intake of fats and protein was not lower in the higher alcohol consumption groups.
Study strengths and limitations
The aim of the current study was to assess alcohol intake among students and investigate whether level of alcohol intake is associated with nutritional parameters. Strengths of the study are the detailed data on consumption of alcoholic beverages and the comprehensive information on energy and nutrient intake based on calculations from a validated and reproducibility-tested FFQ(Reference Salvesen, Hillesund and Vik12). Since participants had to respond to all questions to complete the questionnaire, there were few missing values in the dataset. There are, however, also limitations that need to be discussed. The cross-sectional design of the present study only allows for description of energy and nutrient intake across alcohol consumption categories and does not imply causal associations between alcohol consumption and nutritional indicators. Some dietary information may have been missed due to crude categorisations of fruits and vegetables in the questionnaire. This may have contributed to the seemingly high proportion of students with inadequate intake of vitamin A and C. Potential misreporting of alcohol consumption may have led to misclassification of level of alcohol intake, meaning that the prevalence of excessive alcohol consumption may be higher or lower than reported in this paper. Potential misreporting of diet would likewise lead to misrepresentation of true energy and nutrient intake. The fact that dietary data from FFQ may not accurately represent true dietary intake must also be taken into account. Absolute energy and nutrient intakes and the proportions of participants with a high probability of inadequate intake should therefore be interpreted with caution. On the other hand, given that underreporting of unhealthy foods and overreporting of healthy foods is common in dietary surveys(Reference Cade, Burley and Warm40), true challenges related to suboptimal nutrient intakes could be even greater than our findings suggest. The fact that participants were asked to report on dietary intake pertaining to the last 4 weeks could also limit the reliability and generalisability of our findings. Four weeks is a short time period regarding nutritional adequacy, as short-term changes in diet due to dieting, illness or mental distress could detract from what would be habitual longer-term diet. It could, however, also be argued that recall bias is likely to be less when participants report from the previous month.
We present dietary intakes as reported by the participants and did not exclude participants on the basis of implausible energy intakes. This may have influenced the proportion of participants with high probability of inadequate intake, especially for energy intake-sensitive nutrient intakes such as Fe and folate. For vitamin A, D, C and I, potential underreporting of energy intake is less likely to have biased our findings.
Generalisability from the current study is clearly an issue considering the low participation rate among those invited to participate. Self-selection favouring a more health-conscious group of students is likely, and even if the sample were representative of students in general, our sample is not likely to be representative of the broader population of young adults. In the previously mentioned nation-wide SHOT-survey among Norwegian full-time students, only 8 % of the responders defined themselves as alcohol abstainers(Reference Knapstad and Heradstvei22). This underpins that our sample could be somewhat selected, but also makes our findings regarding alcohol use and dietary weaknesses among students even more alarming in a preconception public health perspective.
Relative to their fundamental importance to preconception health, diet and alcohol are not frequently debated. There is a need to discuss how to foster public knowledge and motivation in preparation for parenthood by avoiding actions that may influence the health and benefit of prospective children. Estimates from the Global Burden of Disease (GBD) project show that the level of alcohol consumption that minimises health loss is zero and urges health authorities to aim at reduced levels of consumption throughout populations(1). While zero alcohol would be an unrealistic and unobtainable goal among those not actively planning a pregnancy, the protection of developing egg and sperm against harmful substances is highly relevant to intergenerational public health. Protective action should be taken to avoid conceiving during periods of excessive alcohol consumption and precautionary advice may be needed for students regarding use of contraception in periods of alcohol use. A range of societal factors could adversely influence students’ diet quality, such as limited economic resources, limited time for food planning, inadequate food preparation skills and lack of knowledge regarding the dividends of healthy eating. An increased focus in young adulthood on how to prepare nutritionally for parenthood seems warranted.
In conclusion, alcohol consumption was common among students in the present study and one-third of male students exceeded the criteria for excessive consumption. Weekly alcohol consumption was positively associated with absolute energy and nutrient intake but inversely associated with micronutrient density of diet. Even though the magnitude of most of these associations was modest, many students had micronutrient intakes below AR for age and gender irrespective of alcohol consumption level and, thus by definition, a relatively high probability of inadequate intake.
The high prevalence of excessive alcohol consumption, the inverse associations with micronutrient density and the prevalence of potential micronutrient inadequacy in this sample of university students are of concern in a preconception public health perspective. Our findings call for investigations into young adults’ knowledge, beliefs and reflections regarding drinking habits and dietary behaviour in relation to the health and well-being for themselves and their future children.
Acknowledgements
Acknowledgments: The authors would like to thank Lorentz Salvesen and Ida U. Valand for their contribution to this project. Salvesen conducted the nutrition calculations, and Valand was involved in the recruitment of participants. Financial support: This research received no specific grant from any funding agency, commercial or not-for-profit sectors. Conflict of interests: None. Authorship: E.R.H., E.L.V., N.C.Ø. and D.E. invented and designed the study. E.L.V. carried out the data collection. E.R.H. formulated the research questions, analysed the data and drafted the paper. N.C.Ø., E.L.V. and D.E. contributed to the interpretation of findings and the intellectual content of the paper. All authors critically read and approved the final version. Ethics of human subject participation: The current study was conducted according to the guidelines laid down in the Declaration of Helsinki and all procedures involving research study participants were approved by the institutional Ethics committee and Norwegian Centre for Research Data. Electronically signed informed consent was obtained from all subjects/patients.


