


Introduction
The order Chiroptera, represented by bats (Whitaker et al., Reference Whitaker Júnior, Ritzi, Dick, Kunz and Parsons2009), has high diversity and wide geographic distribution; bats are found in different types of natural environments and urban areas (Reis et al., Reference Reis, Shibatta, Peracchi, Pedro, Lima, Reis, Peracchi, Pedro and Lima2007). Similar to other animals, bats are subject to parasitism, and it is possible to observe numerous populations of mites, dipterans and ticks that feed on their hair follicles, body fluids or blood (Anderson and Ortêncio-Filho, Reference Anderson and Ortêncio-Filho2006; Peracchi et al., Reference Peracchi, Lima, Reis, Nogueira, Ortêncio-Filho, Reis, Peracchi, Pedro and Lima2011). When an ecological system is formed by several species interacting with each other, as in parasitism, it can be represented by networks. It is essential to consider all species as integral parts of ecological networks and not as isolated groups (Montoya and Raffaelli, Reference Montoya and Raffaelli2010). Studying networks of interactions aids in the search for patterns of abundance, distribution and specialization of species, their degree of redundancy and their vulnerability to extinction (Tylianakis et al., Reference Tylianakis, Tscharntke and Lewis2007; Clayton et al., Reference Clayton, Bush, Johnson and Thompson2015; Zarazúa-Carbajal et al., Reference Zarazúa-Carbajal, Saldaña-Vázquez, Sandoval-Ruiz, Stoner and Benitez-Malvido2016). In addition, networks can provide detailed information on ecological systems, helping elucidate how biological communities are organized, and how species are connected, underscoring the implications of these interactions for the ecosystem (Poulin, Reference Poulin2010; Freitas Júnior et al., Reference Freitas Júnior, De Araújo and Falcão2020).
The network structure may differ according to the type of interaction represented (Bascompte, Reference Bascompte2010; Thébault and Fontaine, Reference Thébault and Fontaine2010). For example, mutualistic interactions can be more nested, connected, characterized by a group of generalist species and less modular, whereas in antagonistic interactions, such as parasitism, there would likely be the formation of modules, and the species can be less connected (Thébault and Fontaine, Reference Thébault and Fontaine2010; Pires and Guimarães, Reference Pires and Guimarães2013). Considering parasitism, the expected high modularity would result from the evolutionary history of the species and the high specificity of the interactions (Pires and Guimarães, Reference Pires and Guimarães2013).
High specificity is a frequent feature in the relationship between bats and ectoparasites (Fritz, Reference Fritz1983; Giorgi et al., Reference Giorgi, Arlettaz, Guillaume, Nusslé, Ossola, Vogel and Christe2004), which can vary from 1 to several species and result from the adaptation to the host and phylogeny of the species involved (Balashov, Reference Balashov1984); the presence of the same parasite species on more than 1 host species may occur because of the inheritance of genetic characteristics (Poulin and Rohde, Reference Poulin and Rohde1997). However, a nested pattern in the interaction between bats and their parasites has been recorded (Presley, Reference Presley2007) and may be associated with the differences in species abundance or parasite adaptability (Lewinsohn et al., Reference Lewinsohn, Prado, Jordano, Bascompte and Olesen2006; Canard et al., Reference Canard, Mouquet, Marescot, Gaston, Gravel and Mouillot2012).
Among the factors influencing the interaction network, changes in the landscape principally caused by habitat fragmentation and alteration are important aspects to be evaluated (Haila, Reference Haila2002). For example, changes in habitat availability resulting from urbanization can directly affect the survival and structure of biological communities, altering the strength of interactions between species and the topology of networks (Patterson et al., Reference Patterson, Dick and Dittmar2009; Pilosof et al., Reference Pilosof, Dick, Korine, Patterson and Krasnov2012; Ferreira et al., Reference Ferreira, Boscolo and Viana2013). Thus, aspects related to community structuring (richness, abundance and composition) resulting from environmental changes could result in changes in the interaction networks (Kruess, Reference Kruess2003; Tylianakis et al., Reference Tylianakis, Tscharntke and Lewis2007; Bartomeus et al., Reference Bartomeus, Gravel, Tylianakis, Aizen, Dickie and Bernard-Verdier2016).
Thus, the goals of this study were to represent, through a bipartite network, the interactions between bats and ectoparasites in the urban green areas of Grande Aracaju, Sergipe; identify the interaction pattern through network topology and calculate the metrics of connectance, specialization, nesting, modularity and centrality. We expected that the host–parasite interaction network presents a modular topology because of the high specificity of the parasites, with low connectivity and nesting values and high specialization and modularity values. We hypothesized that the most central species will be the most abundant in the study because of the greater probability of interactions.
Materials and methods
Study area
The study was conducted in 3 urban green areas located in Grande Aracaju, Sergipe, northeastern Brazil (Fig. 1). The sampled areas belong to the Campus São Cristóvão da Universidade Federal de Sergipe (UFS; 10°55ʹ34.3ʺS; 37°06ʹ09.2ʺW), Secretaria de Estado da Fazenda de Sergipe (SEFAZ; 10°54ʹ38.8ʺS; 37°05ʹ27.9ʺW) and Vila Militar dos Oficiais do Exército (Vila; 10°55ʹ31.6ʺS; 37°03ʹ36.7ʺW). During the study period, the accumulated precipitation was 1773.4 mm, with an average temperature ranging from 24.7 to 29.3°C. The month with the lowest rainfall was December 2019 (8 mm) and the month with the highest rainfall was April 2020 (284.6 mm) (INMET, 2021).

Fig. 1. (a) Brazil with state of Sergipe in highlight; (b) the municipalities with indication of the urban green areas (UFS, SEFAZ and Vila) used for capturing bats located in Grande Aracaju, Sergipe.
The UFS area corresponded to a remnant of the Atlantic Forest, approximately 0.99 ha, and near a fragment of native forest to the Poxim river (Bezerra and Bocchiglieri, personal observation). This area is characterized by dense vegetation, closed canopies and intense artificial light. Despite being considered a remnant of the Atlantic Forest, the use of exotic species for afforestation of the UFS campus caused de-characterization of the natural environment (White et al., Reference White, Ribeiro, White and Nascimento Júnior2011), with approximately 34% of its vegetation being exotic (Gomes et al., Reference Gomes, Ferreira, Mello, Santos, Santana, Gonçalves and Santos2017).
The SEFAZ is 1.58 ha with a plantation of bananas (Musa sp.), resulting in an area with low vegetation and a dense understory. Besides this plantation, the vegetation presents itself differently, having other plant species that occur more widely, with a less dense understory and closed canopy. This area is next to a soccer field and has intense public lighting on the surrounding streets. In addition, solid residue and dense litter were observed (personal observation).
In Vila, an area of 1.56 ha is characterized by the predominance of Terminalia catappa L. (almond trees), with a closed canopy. Despite corresponding to a residential area, the artificial lighting of houses close to the studied green area was less intense than that of the UFS. At the site, it is possible to observe large amounts of solid waste, construction rubble and dense litter (personal observation).
Data collection and analysis
In the areas of UFS and SEFAZ, the campaigns were conducted in September and November of 2019, January, June, July, August, September and November of 2020 and January of 2021. In the Vila area, the campaigns were carried out in September and November of 2019, January and December of 2020 and January and February of 2021. These campaigns were carried out during 2 consecutive monthly nights in each area. Because of the COVID-19 pandemic, 9 campaigns were conducted at UFS and SEFAZ and 6 at Vila during this period.
For the capture of bats, 10 mist nets (9 × 3 m2, mesh 20 mm) were used in each area, arranged at the ground level. They were set from sunset to midnight and inspected at 30 min intervals. The bats were identified based on the method described by Reis et al. (Reference Reis, Peracchi, Batista, Lima and Pereira2017) and posteriorly released at the same capture site. After capture, each bat was inspected with the naked eye for ectoparasites that, when found, were collected manually, stored in ‘Eppendorf’ microtubes with 70% alcohol and the data of each host were properly identified. The identification of the ectoparasite species was realized under a Bell stereomicroscope (SZT model) according to the keys proposed by Guerrero (Reference Guerrero1994a, Reference Guerrero1994b, Reference Guerrero1995) and Whitaker et al. (Reference Whitaker Júnior, Ritzi, Dick, Kunz and Parsons2009).
The data corresponding to the 3 sampled urban green areas were grouped for a more robust analysis. A weighted data matrix was used to generate the interaction network, where bats were represented in the rows, ectoparasites were represented in the columns and the interactions corresponded to the number of times an association was observed in different hosts, considering only the primary associations. The bipartite interaction network was generated using the ‘bipartiteD3’ package in R software (R Core Team, 2021).
Connectivity was determined based on the proportion of interactions occurring relative to the number of possible interactions (Mello et al., Reference Mello, Rodrigues, Costa, Kissling, Şekercioğlu, Marquitti and Kalko2015). The specialization index, which indicates complementary specialization, was separately calculated for the ectoparasite species (d′) and the network as a whole (H 2′), representing how sets of interactions between species differed from each other and varied from 0 (complete generalization) to 1 (complete specialization) (Blüthgen et al., Reference Blüthgen, Menzel and Blüthgen2006; Mello et al., Reference Mello, Rodrigues, Costa, Kissling, Şekercioğlu, Marquitti and Kalko2015).
For nesting, the metric ‘nestedness metric based on overlap and decreasing fill’ (wNODF) was used for weighted matrices, where the values ranged from 0 (no nesting) to 100 (complete nesting) (Almeida-Neto and Ulrich, Reference Almeida-Neto and Ulrich2011). The QuanBiMo (wQ) algorithm was used for modularity, where values ranged from 0 (no modularity) to 1 (complete modularity) (Dormann and Strauss, Reference Dormann and Strauss2014). To verify the significance of connectance, specialization, nesting and modularity, 1000 random networks were generated using the vaznull null model, which reorganizes the interactions while preserving the same marginal totals and connectance as the observed network (Vázquez et al., Reference Vázquez, Melián, Williams, Blüthgen, Krasnov and Poulin2007).
Three widely used metrics were considered (relative degree, closeness centrality and betweenness centrality). The relative degree (Kr) corresponds to the number of interactions a species makes in relation to the total number of interactions it could make (Mello et al., Reference Mello, Rodrigues, Costa, Kissling, Şekercioğlu, Marquitti and Kalko2015). The closeness centrality (CC) measures the proximity of a species to other species in the network, corresponding to the smallest number of links separating 2 species (Mello et al., Reference Mello, Rodrigues, Costa, Kissling, Şekercioğlu, Marquitti and Kalko2015). Betweenness centrality (BC) measures the importance of a species as a connector between different parts of the network (Mello et al., Reference Mello, Rodrigues, Costa, Kissling, Şekercioğlu, Marquitti and Kalko2015). Centralities were calculated only for the bat species. The graph generated for the centrality metrics was generated using Gephi software (Bastian et al., Reference Bastian, Heymann and Jacomy2009). All analyses were conducted using R software with a significance level of 5% (R Core Team, 2021).
Results
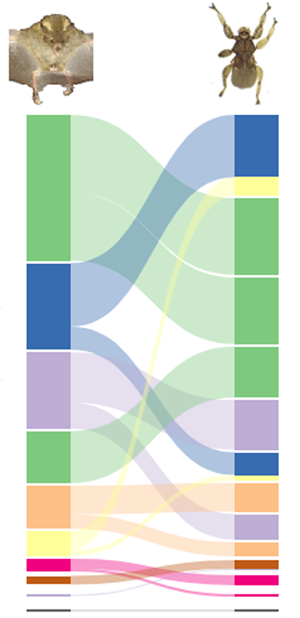
We captured 278 parasitized bats and 875 ectoparasites. The interaction network consisted of 10 species of bats belonging to the families Phyllostomidae (S = 8) and Vespertilionidae (S = 2) and 13 species of ectoparasites belonging to the families Streblidae (S = 12) and Nycteribiidae (S = 1; Appendix 1), totalling 16 interactions. The most representative bat species were Artibeus lituratus (Olfers, 1818) and Artibeus planirostris (Spix, 1823). The most abundant ectoparasites were Megistopoda aranea (Coquillett, 1899) and Paratrichobius longicrus (Miranda-Ribeiro, 1907) (Fig. 2).

Fig. 2. Interaction network between bats and ectoparasites captured in urban green areas of Grande Aracaju, Sergipe, Brazil. The lines and their different colours represent interactions between species, and the width of the line indicates the strength of the interactions. The values in parentheses indicate the frequency of occurrence of the species.
The observed connectance for the bat–ectoparasite interaction network was 0.12, which was lower than expected by the null model (C = 0.53; P < 0.05). This result indicated that the species that made up the network had few interactions, and a maximum of 2 interactions per species was observed (Fig. 1). The values obtained for ectoparasites (d′) for the specialization index ranged from 0.50 to 1.00 (Table 1). For the entire network, the specialization value was 0.96, which was higher than expected (H 2′ = 0.06; Z-score = 81.60; P < 0.05). Thus, the network was highly specialized, with most parasite species (77%) infesting only 1 host.
Table 1. Values referring to the complementary specialization index (d′) of the ectoparasites parasitizing bats captured in urban green areas of Grande Aracaju, Sergipe

Nesting obtained for the network was extremely low (wNODF = 1.47), and differed from that expected by the null model (wNODF = 81.43; Z-score = −17.66; P < 0.05). For modularity, the value obtained was higher (wQ = 0.74) than that expected by the null model (wQ = 0.12; P < 0.05), indicating that the studied network had a modular topology, with the formation of 8 modules. Of the modules formed, only 2 were composed of more than 1 species of bats, Artibeus obscurus (Schinz, 1821) and A. planirostris, and Myotis lavali Moratelli, Peracchi, Dias & de Oliveira, 2011 and Myotis riparius Handley, 1960.
Regarding centrality metrics, the relative degree ranged from 0.5 to 1.0, with the highest values for A. obscurus, A. planirostris, M. lavali and M. riparius. For CC, the values obtained ranged from 0.0 to 1.0, with the highest values corresponding to A. obscurus and M. lavali. In relation to BC, all values were equal to 0, indicating that in the studied network, no species was considered important for maintaining structure connections (Fig. 3).

Fig. 3. Unipartite projections of the original bipartite nets: the circles represent the bat species captured in urban green areas of Grande Aracaju, Sergipe. Brazil; 2 species are connected when they are parasitized by at least 1 common species of parasite. The stronger the colour, the greater the value of centrality observed [(a) relative degree, (b) closeness centrality and (c) betweenness centrality]. The numbers correspond to bat species (1: Artibeus lituratus, 2: Phyllostomus discolor, 3: Sturnira lilium, 4: Artibeus obscurus, 5: Artibeus planirostris, 6: Carollia perspicillata, 7: Myotis lavali, 8: Phyllostomus hastatus, 9: Platyrrhinus lineatus and 10: Myotis riparius).
Discussion
The Phyllostomidae family corresponded to 51.38% of the species recorded in Brazil (Garbino et al., Reference Garbino, Gregorin, Lima, Loureiro, Moras, Moratelli, Nogueira, Pavan, Tavares, do Nascimento and Peracchi2020) and was the most abundant family in this study. According to Pech-Canche et al. (Reference Pech-Canche, Estrella, López-Castillo, Hernández-Betancourt and Moreno2011), the capture method used in this study is highly effective in capturing representatives of this family. Richness of other families, such as Vespertilionidae, Molossidae and Emballonuridae, may have been underestimated as their representatives can fly higher and detect the mist net more easily (Simmons and Voss, Reference Simmons and Voss1998; Rinehart and Kunz, Reference Rinehart and Kunz2001). For ectoparasites, the high occurrence of M. aranea and P. longicrus could be associated with the high capture rate of their primary hosts, A. planirostris and A. lituratus, respectively (Graciolli and Rui, Reference Graciolli and Rui2001). Species of the genus Artibeus are commonly recorded in urban areas, being considered opportunistic, with varied feeding habits and can benefit from fruit plants used in local afforestation, allowing their high occurrence in this type of environment (Zortéa and Chiarello, Reference Zortéa and Chiarello1994; Barros et al., Reference Barros, Bisaggio and Borges2006; Lima, Reference Lima, Reis, Peracchi and Santos2008).
The interaction network obtained in this study exhibited low connectance, low nesting, high general and complementary specialization and high modularity. Thus, the network topology was modular. Such a pattern has been reported for other host–parasite interactions (e.g. Poulin, Reference Poulin2010; Krasnov et al., Reference Krasnov, Fortuna, Mouillot, Khokhlova, Shenbrot and Poulin2012; Morris et al., Reference Morris, Gripenberg, Lewis and Roslin2014) and bats and their ectoparasites (Urbieta et al., Reference Urbieta, Graciolli and Vizentin-Bugoni2021). This modularity may be caused by the evolutionary history of the bats and ectoparasites contributing to the high specificity index of the interactions (Pires and Guimarães, Reference Pires and Guimarães2013).
The high degree of specialization and modular pattern observed in this study could be associated with the high specificity of ectoparasites, as 77% were parasitized by only 1 host species (monoxenes). For parasitism, the physical approach of the hosts is necessary, and it is believed that most of the parasites are monoxenes (Marshall, Reference Marshall and Kunz1982; Dick et al., Reference Dick, Esbérard, Graciolli, Bergallo and Gettinger2009) or stenoxenes (Dick, Reference Dick2007), with this high specificity being a frequent characteristic of the relationship between parasites and bats (Fritz, Reference Fritz1983), as reported in other studies conducted in Sergipe (Bezerra et al., Reference Bezerra, Vasconcelos and Bocchiglieri2016; Bezerra and Bocchiglieri, Reference Bezerra and Bocchiglieri2018).
A modular network is characterized by species with few links that relate preferentially within a cohesive subgroup of species rather than other species in the network (Olesen et al., Reference Olesen, Bascompte, Dupont and Jordano2007; Krasnov et al., Reference Krasnov, Fortuna, Mouillot, Khokhlova, Shenbrot and Poulin2012). In the present study, only 2 groups formed by more than 1 bat species were observed, and these groups were formed by bats belonging to the same genus (Artibeus spp. and Myotis spp.). In modular networks, owing to high species specificity, modules are often created by phylogenetically related bat species with similar parasitic fauna (Mello et al., Reference Mello, Marquitti, Guimaraes Júnior, Kalko, Jordano and de Aguiar2011; Krasnov et al., Reference Krasnov, Fortuna, Mouillot, Khokhlova, Shenbrot and Poulin2012; Freitas Júnior et al., Reference Freitas Júnior, De Araújo and Falcão2020). According to Wenzel et al. (Reference Wenzel, Tipton, Kiewlicz, Wenzel and Tipton1966) and Marshall (Reference Marshall and Kunz1982), parasites belonging to the Streblidae and Nycteribiidae families are highly specific, and each fly species generally parasitizes only a single species or genus of bat.
In urban areas, it is expected that there will be a reduction in specialization and a consequent increase in nesting resulting from the lower availability of shelters in these areas, which would lead to an increase in the aggregation of different species of bats in a single shelter, facilitating the transmission of parasites among them (Urbieta et al., Reference Urbieta, Graciolli and Vizentin-Bugoni2021). However, this was not observed in this study because the network obtained exhibited high specialization and low nesting. Urbieta et al. (Reference Urbieta, Graciolli and Vizentin-Bugoni2021) demonstrated that bat–ectoparasite interaction networks maintained their structural characteristics (specialization and modularity) even in areas with different levels of land use. However, Hernández-Martinez et al. (Reference Hernández-Martínez, Morales-Malacara, Alvarez-Añorve, Amador-Hernández, Oyama and Avila-Cabadilla2018) recorded differences in the degree of specialization of networks, which were more specialized in areas with a lower degree of fragmentation.
Habitat loss can influence host–parasite interactions, affecting the survival of both groups involved, where the extinction of a given host species can cause secondary extinctions of highly specific parasites (Gómez and Nichols, Reference Gómez and Nichols2013). In addition, vegetation loss can affect the availability of food and shelter, influencing the abundance and occurrence of hosts and altering the structure of the interaction network (Cottontail et al., Reference Cottontail, Wellinghausen and Kalko2009; Pilosof et al., Reference Pilosof, Dick, Korine, Patterson and Krasnov2012).
In this study, the centrality values showed low variation, with most species having values equal to 0, especially for BC. The species richness of a community determines the size of the network, which can influence characteristics such as vulnerability, generality, connectivity and link density (Tylianakis et al., Reference Tylianakis, Tscharntke and Lewis2007). This can indirectly affect the size of the network, favouring parasite richness (Kruess, Reference Kruess2003; Albrecht et al., Reference Albrecht, Duelli, Schmid and Müller2007). In addition, species abundance can influence the frequency and detectability of interactions (Pellissier et al., Reference Pellissier, Rohr, Ndiribe, Pradervand, Salamin, Guisan and Wisz2013; Bartomeus et al., Reference Bartomeus, Gravel, Tylianakis, Aizen, Dickie and Bernard-Verdier2016) because more abundant species are more likely to interact (Vázquez et al., Reference Vázquez, Chacoff and Cagnolo2009; Canard et al., Reference Canard, Mouquet, Mouillot, Stanko, Miklisova and Gravel2014). Thus, the low centrality values obtained in this study could be associated with low connectance (0.12), high specialization (0.96) and the size of the network, as it was composed of only 10 bat species and 13 ectoparasites, which could have limited the number of interactions recorded, and consequently, the centrality values.
Given the importance of ectoparasites of bats in the ecology, control and population dynamics of the host, this study provides relevant information on these topics. In addition, more studies should be conducted involving host–parasite interaction networks to improve our understanding of such networks.
Data availability
Not applicable.
Acknowledgements
We are grateful to the Universidade Federal de Sergipe (UFS), Secretaria de Estado da Fazenda de Sergipe and Vila Militar dos Oficiais do Exército for logistical support.
Author's contributions
R. H. S. B.: methodology, validation, formal analysis, investigation and writing – original draft. A. B.: conceptualization, methodology, formal analysis, resources, writing – review and editing and supervision.
Financial support
This study was supported by Coordenação de Aperfeiçoamento de Pessoal de Nível Superior – Brasil (CAPES) – Finance Code 001 and AUXPE 2417/2013, 1941/2017 and process 88881.157961/2017-01.
Conflict of interest
The authors declare that they have no conflicts of interest.
Ethical standards
The animals were captured with permission granted by the Biodiversity Information and Authorization System/ICMBio (SISBIO nos. 71378-1 and 71378-5).
Appendix 1. Relationship of ectoparasites recorded in bats captured in urban green areas of Grande Aracaju, Sergipe


 Open access