


Introduction
Fluorescence imaging offers a major advantage over bright-field microscopy because it allows multiplex detection of several targets in the same specimen. Using spectrally well-separated dyes, multiple targets within the same sample can be stained or labeled. Ultraviolet (UV) or laser light is then used to excite these dyes to fluorescence, permitting target identification by color using multicolor fluorescence imaging. Since their introduction in the 1970s, diamidino-2-phenylindole (DAPI) and Hoechst dyes have been the nuclear counterstains of choice for immunofluorescence staining. Bright, nuclear-selective, and easy-to-use, the dyes occupy the blue fluorescence channel that is frequently sub-optimal for detecting other targets because of the high intrinsic blue background fluorescence of most cells and tissues. However, DAPI and Hoechst dyes can present some pitfalls for fluorescence imaging. In particular, their signal can bleed through into the green channel because of their broad fluorescence emission, leading to imaging artifacts. More recently, another source of fluorescence cross talk of DAPI and Hoechst dyes has been described [Reference Piterburg1]; this is the photoconversion of the dyes by UV light to generate fluorophores with green and red emission. This spurious emission could interfere with specific imaging of green and red fluorescent targets, especially because focusing on blue stained nuclei in the specimen is often the microscopist's first step during imaging.
The photoconversion of DAPI by UV exposure to generate green fluorescence was described by Piterburg and colleagues in 2012 [Reference Piterburg1]. Other groups have expanded upon this observation, showing that both DAPI and Hoechst dyes undergo photoconversion and that different fixation methods and mounting media can enhance the process [Reference Jež2]. Both green and red fluorescent products have been detected after UV exposure of DAPI and Hoechst [Reference Karg and Golic3]. Photoconversion of Hoechst also has been shown to occur with 405 nm laser excitation, a potential complication for studies using Hoechst dyes to photosensitize living cells to UV-induced DNA damage [Reference Hurst and Gasser4].
Photoconversion has been reported for DAPI, Hoechst dyes, and Vybrant® DyeCycle™ Violet in the presence or absence of DNA [Reference Żurek-Biesiada5]. Multiple groups reported that the appearance of photoconversion products correlated with the photobleaching of blue fluorescence and that while blue fluorescence recovered over time in the dark, the photoconversion products did not disappear completely [Reference Karg and Golic3,Reference Żurek-Biesiada5,Reference Rodic6]. Żurek-Biesiada and colleagues examined the chemical mechanisms of photoconversion. Exposure to hydrogen peroxide mimicked the effect of UV light, suggesting that photoconversion was the result of photooxidation. Mass spectrometry analysis revealed that the green fluorescent species that was generated, by peroxide or UV treatment of DAPI or Hoechst, was a protonated form of the dye; however, the pH of the environment did not influence photoconversion [Reference Żurek-Biesiada5]. A summary of the literature describing photoconversion of DAPI and similar dyes is provided in Table 1.
Table 1: Comparison of published reports of photoconversion of DAPI and similar nuclear stains. First column shows references.

Once researchers are aware of potential artifacts from photoconversion of DAPI and similar dyes, careful imaging practices can be used to minimize UV excitation of dyes before image capture. In addition, it is essential to design appropriate negative control experiments for detecting and avoiding fluorescence cross talk from a variety of sources.
Materials and Methods
Tissue staining
Rat skeletal muscle cryosections were purchased from Zyagen (San Diego, CA). DAPI, mounting media, and coverslip sealant were from Biotium (Fremont, CA). Cryosections were fixed in ice-cold methanol for 5–10 minutes at -20°C and then rinsed three times with phosphate-buffered saline (PBS). Sections were stained with 1.5 µg/mL DAPI in PBS for 3 minutes at room temperature and then rinsed once with PBS. Sections were mounted using PBS (with no antifade compounds added), EverBrite Mounting Medium, Drop-n-Stain EverBrite Mounting Medium, or EverBrite Hardset Mounting Medium and placed under coverslips. The coverslip edges were sealed with CoverGrip Coverslip Sealant. EverBrite Hardset was allowed to cure overnight at room temperature, protected from light. Slides were stored at 4°C before imaging.
Fluorescence imaging
Specimens were imaged using a Zeiss LSM700 laser scanning confocal imaging system attached to an Axio Observer Z1 inverted fluorescence microscope (Carl Zeiss, Oberkochen, Germany) with an X-Cite 120-Watt short arc lamp (EXTO Life Sciences, Mississauga, Ontario, Canada). Light exposure and imaging were performed through a Zeiss EC-Plan-NEOFLUAR 40×/1.3 DIC oil objective. For UV exposure, specimens were exposed to UV excitation through a 365 nm DAPI filter (Zeiss filter set 49), with the lamp controller set to the highest brightness setting. For 405 nm laser exposure, specimens were excited using the confocal system's 5 mW 405 nm solid-state laser at 10% power or 90% power setting. Images were scanned with laser power at 10%. The DAPI channel was scanned first, and then the fluorescein isothiocyanate (FITC) and tetramethylrhodamine isothiocyanate (TRITC) channels were scanned. After exposure of a field to UV or 405 nm light, the stage was moved to image a new field of view with low green or red autofluorescence, using 488 nm and 555 nm excitation for subsequent imaging. Images shown in Figure 3 were captured at 1× zoom; all other images were captured at 0.5× zoom. Three different fields were captured for each experimental condition. Laser power and gain settings were kept constant for comparison of fluorescence intensity between images.
Results
Photoconversion rates
In agreement with published studies, UV excitation of DAPI-stained skeletal muscle tissue sections in wet-set mounting medium resulted in rapid appearance of green and red fluorescent photoconversion products. Neither green nor red nuclear fluorescence was detected in areas of the tissue that had not been exposed to UV light through the DAPI filter cube (Figures 1E and 1I). However, after less than 5 seconds of UV exposure, green and red nuclear fluorescence could be observed (not shown). The green and red nuclear fluorescence became readily detectable after 10 seconds of UV exposure (Figures 1F and 1J) and increased in intensity with longer UV exposure times of up to 60 seconds (Figures 1H and 1L). The fluorescence intensity in the green and red channels was roughly equal. When the specimen was moved to an adjacent field of view, no green/red nuclear fluorescence was observed in areas of the section that were outside the UV-exposed field (not shown).
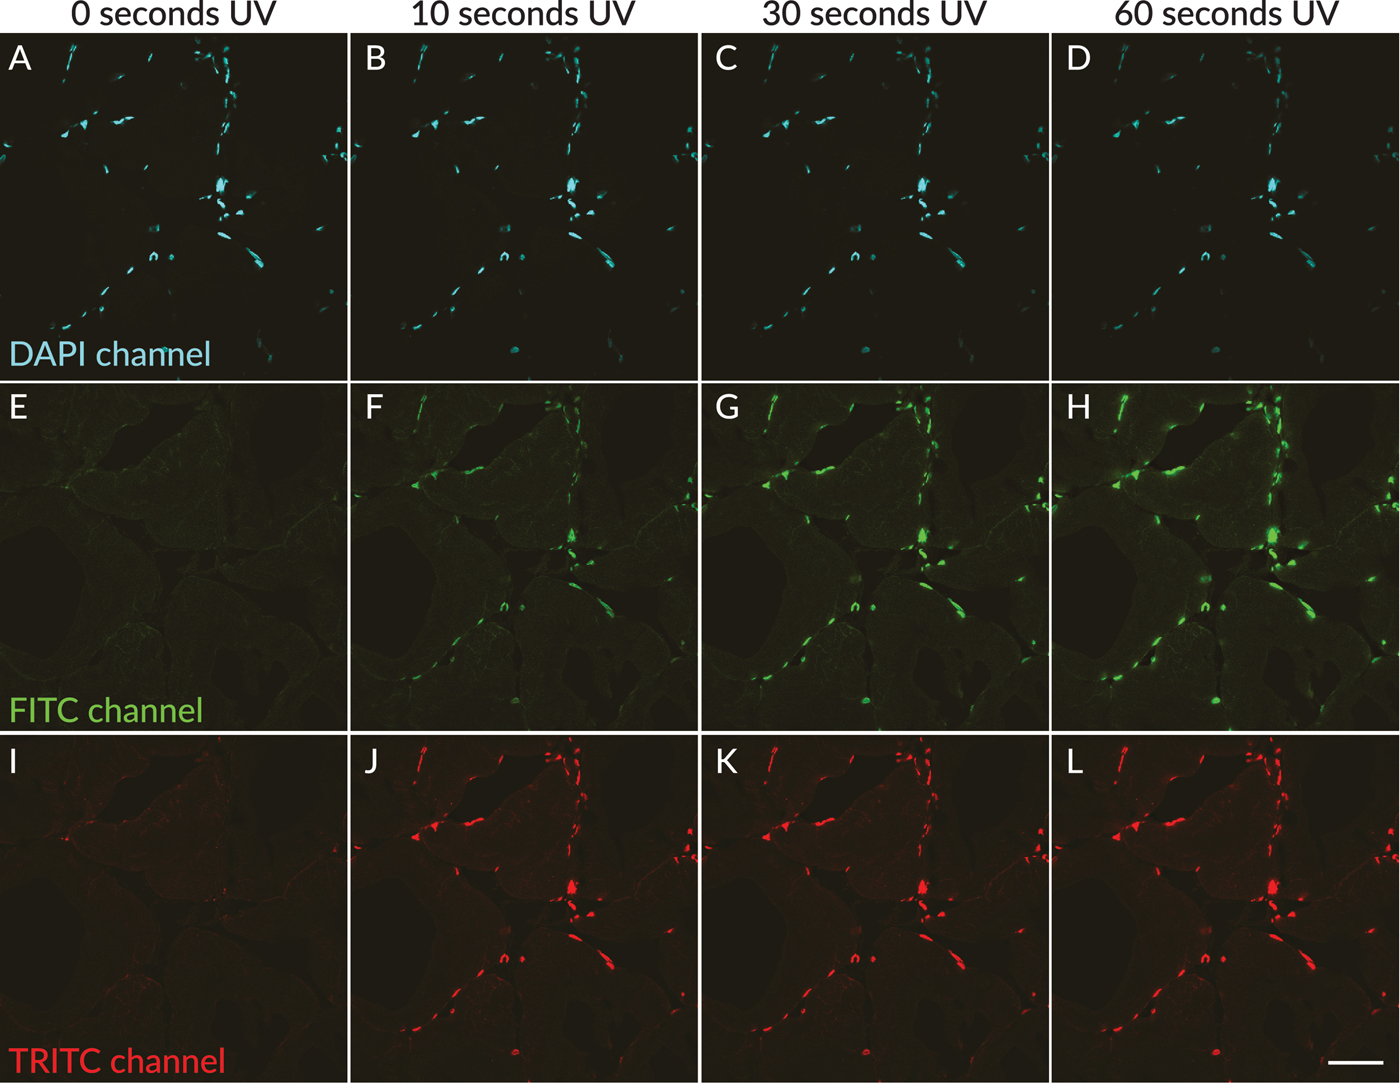
Figure 1: UV-induced photoconversion of DAPI to green and red photoconversion products in rat skeletal muscle sections mounted in EverBrite antifade mounting medium. In a field scanned without exposure to UV excitation, nuclei showed blue fluorescence (A, pseudocolored cyan), with no detectable green (E) or red (I) nuclear fluorescence. After 10 seconds of UV exposure, green and red nuclear fluorescence were detectable in the same field of view (F, J), increasing in intensity after 30 seconds (G, K) and 60 seconds (H, L) of UV exposure, with concurrent dimming of nuclear fluorescence in the DAPI channel (B–D). Scale bar = 50 µm.
Photoconversion products
Merged images of DAPI (blue) and TRITC (red) channels are shown in Figure 2 to show the color differences of nuclear staining before (Figure 2A) and after (Figure 2B) photoconversion. Nuclei with red photoconversion product appear pink to red in the merged images depending on the intensity of the photoconversion product, while nuclei in the field adjacent to the UV-exposed area without photoconversion product appear blue (Figure 2C). Green fluorescence of the photoconversion product was also observed and had similar intensity as the red fluorescence (not shown). The photoconversion products appeared to be stable because areas with green and red fluorescent nuclear fluorescence were readily detectable in the specimen when the slide was stored at 4°C in the dark for several days after initial UV exposure (not shown).
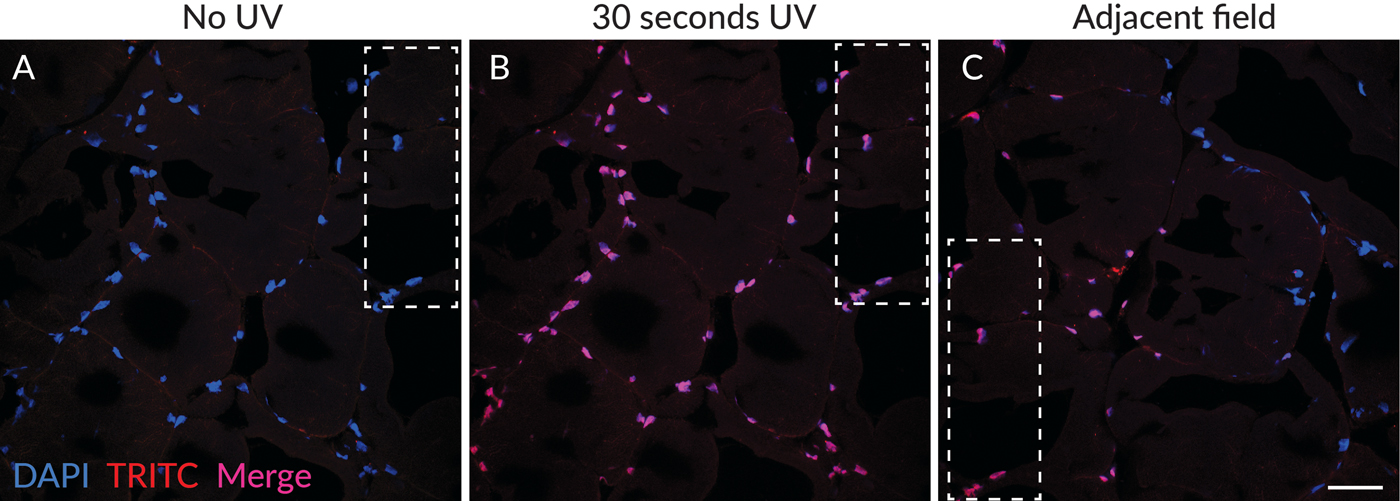
Figure 2: Photoconversion of DAPI was detectable only in areas exposed to UV excitation. (A) Merged image of DAPI (blue) and TRITC (red) channels in a field scanned without UV excitation, showing blue nuclear fluorescence without detectable red fluorescence. (B) The same field as in (A), after 30 seconds of UV exposure, showing red photoconversion product, which appears pink to red when merged with the blue DAPI signal depending on the intensity of the red fluorescence. (C) A field adjacent to that in (A) and (B), showing nuclei adjacent to the area exposed to UV. Nuclei with only blue detectable fluorescence can be imaged alongside nuclei with both blue DAPI fluorescence and red photoconverted fluorescence. The dashed outlines indicate the position of the same region of the tissue in the different fields of view. Scale bar = 50 µm.
Laser excitation
In contrast to UV excitation, exposure of sections to 405 nm laser excitation did not result in rapid appearance of photoconversion products. After 60 seconds of excitation at 10% laser power (the intensity used for image capture in these experiments), photoconversion products were not detectable (Figure 3F). Subsequent excitation of the same field of view with 405 nm laser at 90% power for 60 seconds resulted in the appearance of dim photoconversion product fluorescence (Figure 3G) that was much less intense than the fluorescence that resulted from exposure of the same field of view to UV excitation for 30 seconds (Figure 3H). Red nuclear fluorescence also was observed after UV and 405 nm exposure, which had similar intensity as the green fluorescence (not shown).
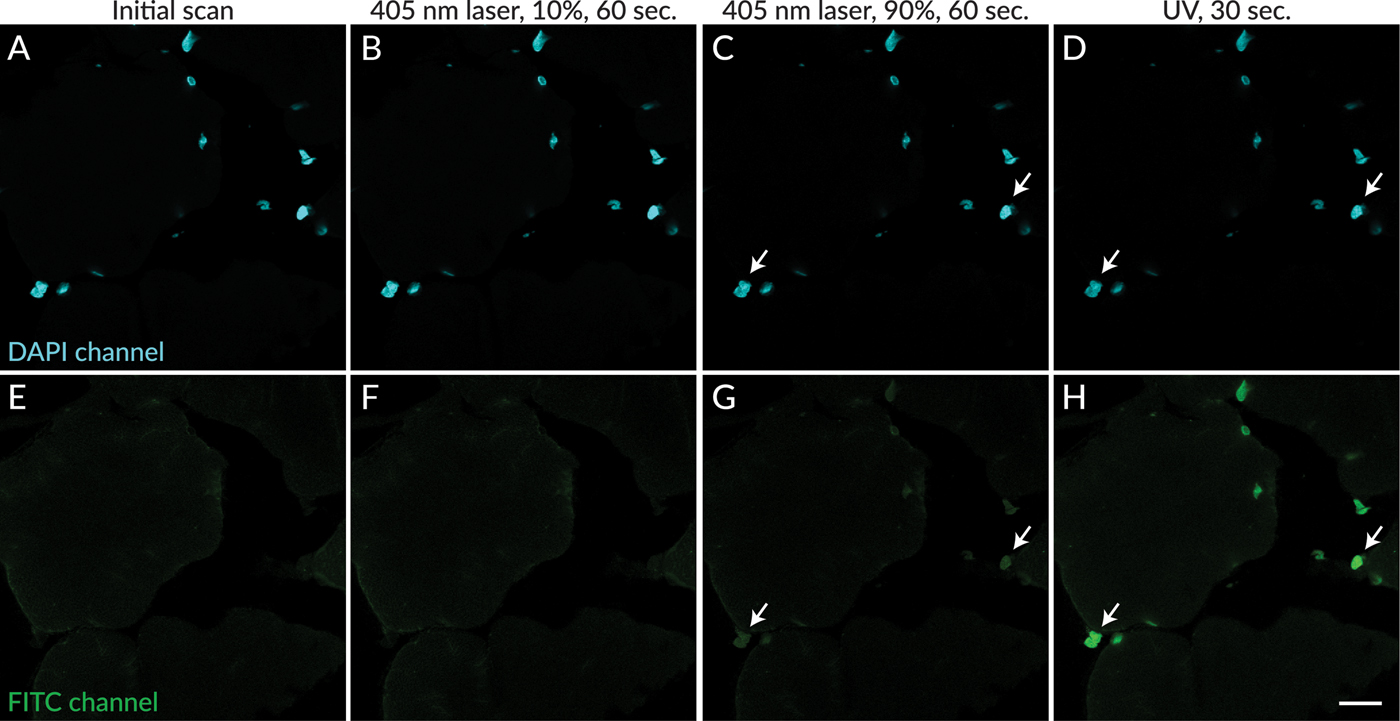
Figure 3: Photoconversion of DAPI was less apparent after exposure to 405 nm laser excitation compared to UV excitation. DAPI signal is shown in cyan (A–D). No green nuclear fluorescence was detectable in a field scanned without UV excitation (E), or after 60 seconds of exposure to 405 nm excitation at 10% power (F). Faint green nuclear signal was detected in the same field after subsequent exposure to 60 seconds of 405 nm excitation at 90% laser power (G, arrows). Green nuclear signal was readily detectable in the same field after subsequent exposure to UV light for 30 seconds (D,H, arrows indicate the same nuclei as in G). Scale bar = 20 µm.
Specimen preparation effects
Ultra-violet exposure was performed on sections mounted with different antifade formulations or PBS. EverBrite Mounting Medium is a glycerol-based wet-set medium, whereas Drop-n-Stain EverBrite is a formulation with reduced glycerol content. EverBrite Hardset is a hardening low-glycerol formulation. After 30 seconds of UV exposure, conspicuous green fluorescent photoconversion product was observed in high-glycerol EverBrite medium (Figure 4D). In reduced-glycerol Drop-n-Stain EverBrite medium, very dim nuclear photoconversion fluorescence was barely detectable (Figure 4H, arrows). Photoconversion of DAPI was not observed after 30 seconds of UV exposure in EverBrite Hardset or PBS (Figures 4L and 4P), although an increase in non-nuclear tissue autofluorescence was seen after UV exposure in EverBrite Hardset (Figure 4L). The fluorescence intensity of photoconversion product did not appear to correlate with the initial intensity of DAPI signal or the degree of DAPI photobleaching. For example, initial nuclear fluorescence intensity in the DAPI channel was comparable in sections mounted with EverBrite wet-set medium (Figure 4A) where photoconversion was readily detectable (Figure 4D) and with EverBrite Hardset medium (Figure 4I) where photoconversion was not observed (Figure 4L). Photobleaching of fluorescence in the DAPI channel was most pronounced in the section mounted in PBS (Figures 4M and 4N) where photoconversion was not detected (Figure 4P).
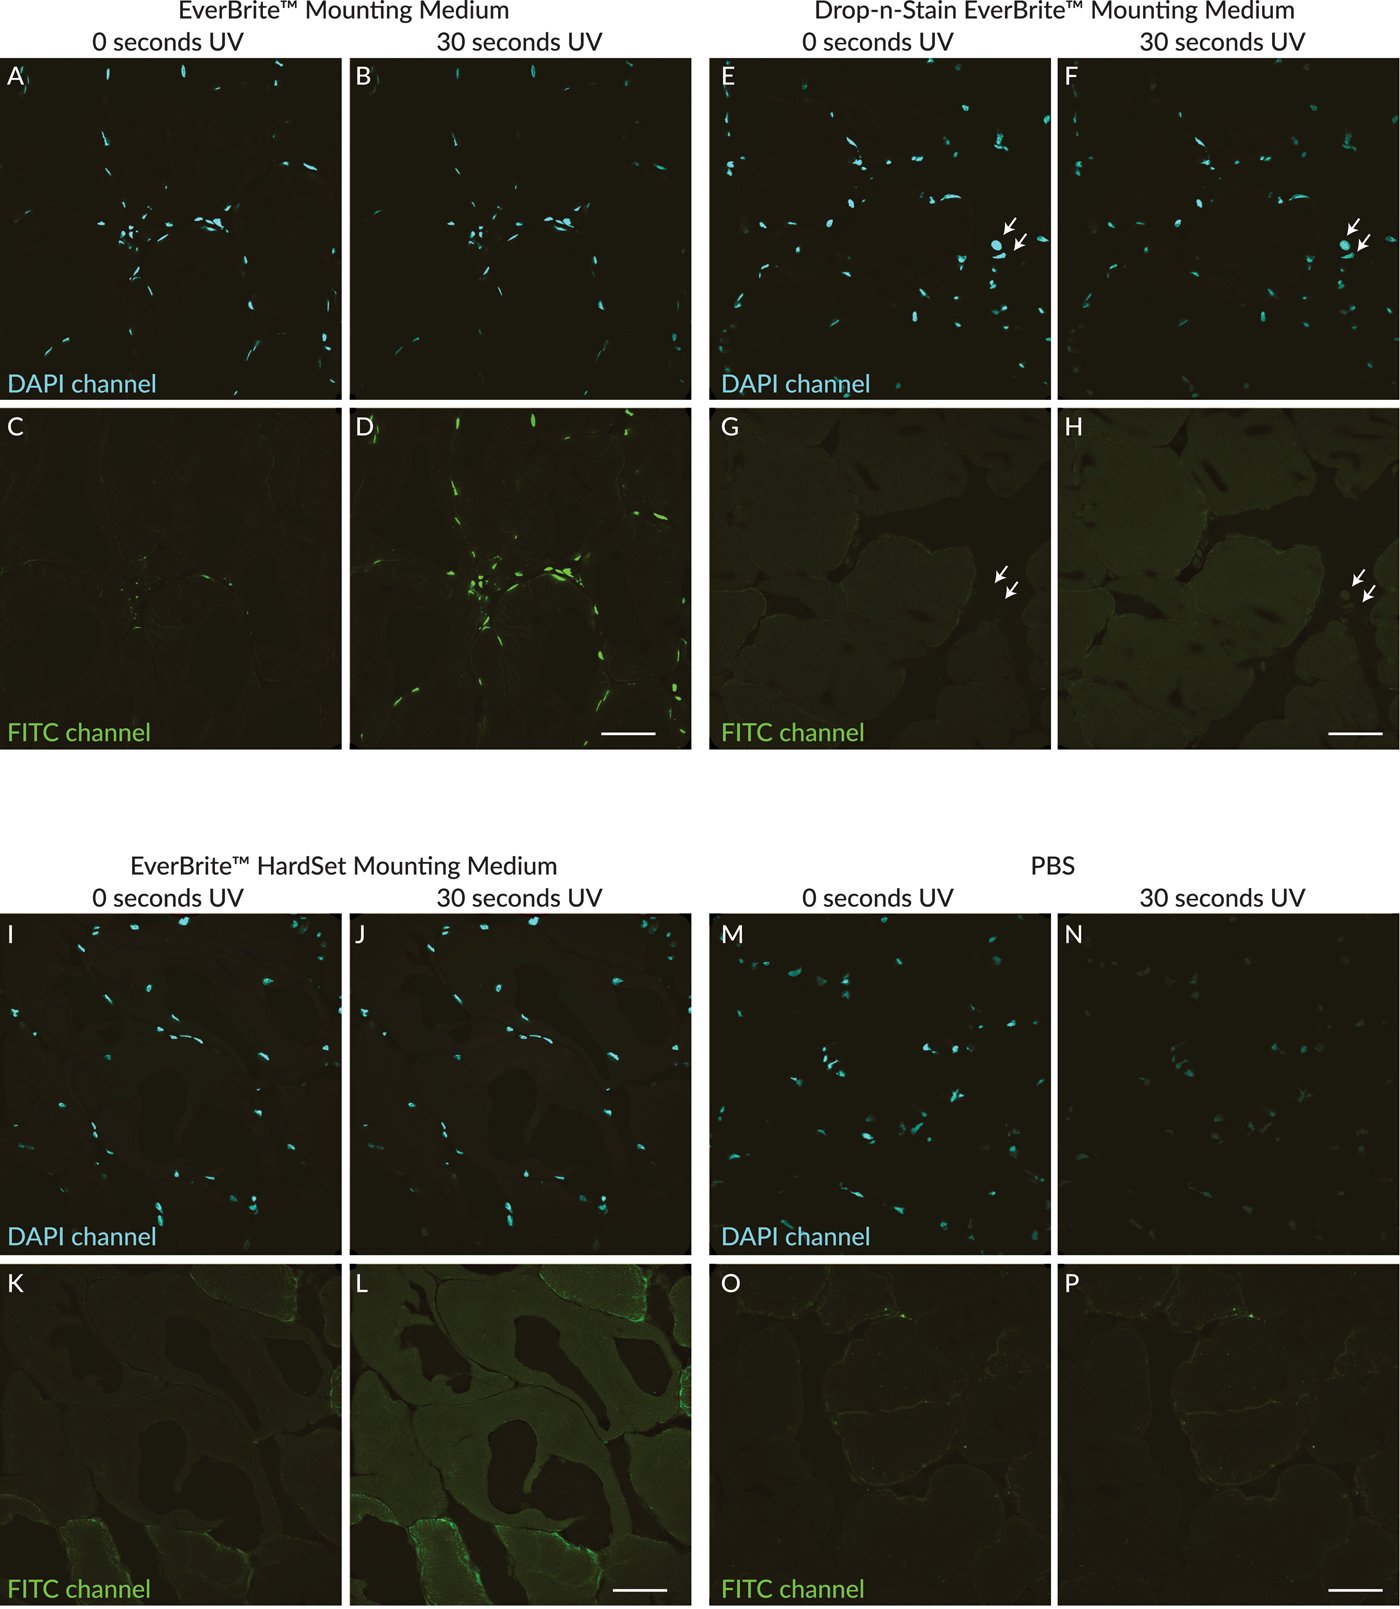
Figure 4: Comparison of UV-induced DAPI photoconversion in different mounting media. DAPI signal shown in the top panels is shown in cyan. (A–D): High-glycerol EverBrite Mounting Medium. (E–H): Reduced-glycerol Drop-n-Stain EverBrite Mounting Medium. (I–L): Low-glycerol EverBrite Hardset Mounting Medium. (M–P): PBS with no antifade compounds added. Green nuclear fluorescence was readily detectable after 30 seconds of UV exposure in EverBrite Mounting Medium (D). Very dim green nuclear fluorescence was barely detectable after 30 seconds of UV exposure in Drop-n-Stain EverBrite (H, arrows), which has lower glycerol content than EverBrite Mounting Medium. No green nuclear fluorescence was observed after 30 seconds of UV exposure in EverBrite Hardset (L) or PBS (P). Scale bars = 50 µm.
Discussion
Despite several published studies reporting the photoconversion of blue fluorescent nuclear dyes to form green and red fluorescent products, some microscopists may still be unaware of the potential for artifacts when using these near-ubiquitous stains. However, once the phenomenon is recognized, problems arising from photoconversion can be avoided through careful imaging practices, or by using different stains or mounting media.
Keep it short
The rate of photoconversion of DAPI and similar dyes may vary depending on instrument configuration. While photoconversion of DAPI can become apparent after a few seconds [Reference Jež2], detection of intense photoconversion product fluorescence more commonly requires continuous UV irradiation for 30 seconds or longer [Reference Piterburg1,Reference Karg and Golic3,Reference Rodic6]. Photoconversion artifacts can be avoided by keeping UV excitation of DAPI as brief as possible when locating and focusing on specimens. Images of the nuclear stain should be captured last, after images are collected for other fluorophores. Although 405 nm laser excitation can induce photoconversion as previously reported [Reference Hurst and Gasser4], it required longer exposure time and high laser power (Figure 3). When using confocal microscopy, one can avoid photoconversion by navigating to fields not exposed to UV light before capturing images.
Change your reagents
Fixation method may affect photoconversion; however, published reports do not consistently agree on whether formaldehyde-fixed samples show less DAPI photoconversion than alcohol-fixed samples [Reference Piterburg1,Reference Jež2]. Glycerol, a common component of antifade mounting medium, has been reported to facilitate photoconversion [Reference Jež2], and in these experiments, photoconversion was readily observed only in high-glycerol mounting medium (Figure 4). While the mechanisms of glycerol enhancement of photoconversion remain unclear, switching to a low-glycerol mounting medium may prevent the problem.
Published studies do not report consistent differences in photoconversion among DAPI, Hoechst, and other blue fluorescent stains. Using a far-red nuclear stain like RedDot™2, NucSpot® Live 650, Draq5™, or SiR-DNA avoids the use of DAPI and Hoechst altogether. Like blue dyes, far-red dyes leave the green and visible red channels open for other fluorophores, but they are more costly than DAPI or Hoechst. Another disadvantage of far-red nuclear stains is that their fluorescence emission is not visible to the human eye, so they can't be used to locate and focus on specimens through the eyepieces.
Include controls for cross talk
While photoconversion can be a significant source of fluorescence cross talk with nuclear stains, it is by no means the major source of cross talk or bleed-through with these stains. DAPI and Hoechst dyes have broad fluorescence emission that overlaps substantially with green fluorescence emission. Because the dyes are not efficiently excited at 488 nm, they can be well separated from green emitters by exciting the dyes separately. However, if blue and green fluorophores are excited simultaneously, DAPI will fluoresce brightly in the green emission channel.
Aside from nuclear stains, even spectrally well-separated fluorescent dyes used for multiplexing can show fluorescence cross talk, particularly if dyes are imaged simultaneously, or if staining with one fluorophore is much more intense than the other fluorophores. The recognition of photoconversion as another source of imaging artifacts highlights the importance of including single-stained controls to assess cross talk in multicolor fluorescence imaging experiments.
Conclusion
Photoconversion of DAPI, Hoechst, and similar dyes has been confirmed by several laboratories. Researchers should be aware of the potential for dye photoconversion in order to prevent it during imaging. However, photoconversion represents only one of multiple sources of fluorescence cross talk. Appropriate design of negative controls is essential to avoid cross talk artifacts, regardless of the dyes used.
Acknowledgments
The author thanks Alexis Madrid, James Maclean, and Daniel Wasik for critical reading of the manuscript.


